29.2 Thin Layer (TLC) and Paper Chromatography (PC)
Learning Objectives
By the end of this section, you will be able to:
- Describe the purpose and procedure of paper chromatography.
- Calculate the Rf value.
- Describe the purpose and procedure of thin layer chromatography.
Paper Chromatography (PC)
In paper chromatography, the stationary phase is a very uniform absorbent paper. The mobile phase is a suitable liquid solvent (typically, water) or mixture of solvents. Here’s a quick paper chromatography experiment you can try at home using water soluble markers (or food colouring), paper towel (or coffee filter) and water.
Watch Marker Pen Chromatography – FLEET Centre Home Science on YouTube (2 mins)
Video source: FLEET Centre. (2018, February 11). Marker pen chromatography – FLEET Centre Home Science [Video]. YouTube.
Setting up a Paper Chromatography Experiment
Suppose you have three blue pens, and you want to find out which one was used to write a message. Samples of each ink are spotted on to a pencil line drawn on a sheet of chromatography paper. Some of the ink from the message is dissolved in the minimum possible amount of a suitable solvent, and that is also spotted onto the same line. In Figure 29.2a., the pens are labeled 1, 2 and 3, and the message ink as M.

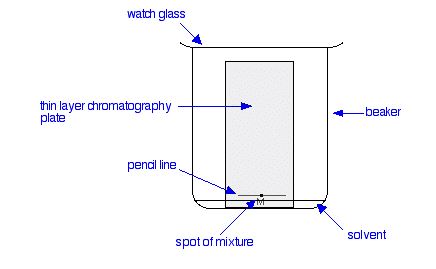
The paper is suspended in a container with a shallow layer of a suitable solvent or mixture of solvents in it. It is important that the solvent level is below the line with the spots on it. The Figure 29.2b. doesn’t show details of how the paper is suspended because there are multiple ways of doing it.
The reason for covering the container is to make sure that the atmosphere in the beaker is saturated with solvent vapour. Saturating the atmosphere in the beaker with vapour stops the solvent from evaporating as it rises up the paper.
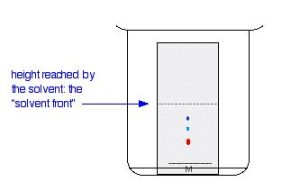
As the solvent slowly travels up the paper, the different components of the ink mixtures travel at different rates and the mixtures are separated into different coloured spots. Figure 29.2c. shows what the plate might look like after the solvent has moved almost to the top.
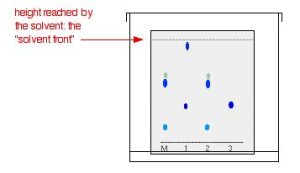
It is fairly easy to see from the final result that the pen that wrote the message contained the same dyes as pen 2. You can also see that pen 1 contains a mixture of two different blue dyes – one of which might be the same as the single dye in pen 3.
Rf values
Some compounds in a mixture travel almost as far as the solvent does; some stay much closer to the base line. The distance travelled relative to the solvent is a constant for a particular compound as long as you keep everything else constant – the type of paper and the exact composition of the solvent, for example.
The distance travelled relative to the solvent is called the Rf value. For each compound it can be worked out using the formula:
Example 29.2a
Calculate the Rf value for a paper chromatography result if one component of a mixture travelled 9.6 cm from the base line while the solvent had travelled 12.0 cm.
Solution
The Rf value for that component is:

In the example we looked at with the various pens, it wasn’t necessary to measure Rf values because you are making a direct comparison just by looking at the result.
You are making the assumption that if you have two spots in the final result which are the same colour and have travelled the same distance up the paper, they are most likely the same compound. It isn’t necessarily true of course – you could have two similarly coloured compounds with very similar Rf values.
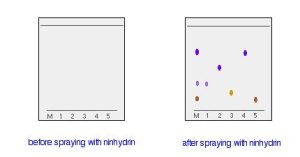
In some cases, it is possible to see the results of paper chromatography because the spots are coloured. Other times, the spots may not be visible. However, it may be possible to make the spots visible by reacting them with something which produces a coloured product. In Figure 29.2d., a paper chromatography experiment is run with different amino acids. After the experiment is run, the paper is sprayed with a solution of ninhydrin. Ninhydrin reacts with amino acids to give coloured compounds, mainly brown or purple.
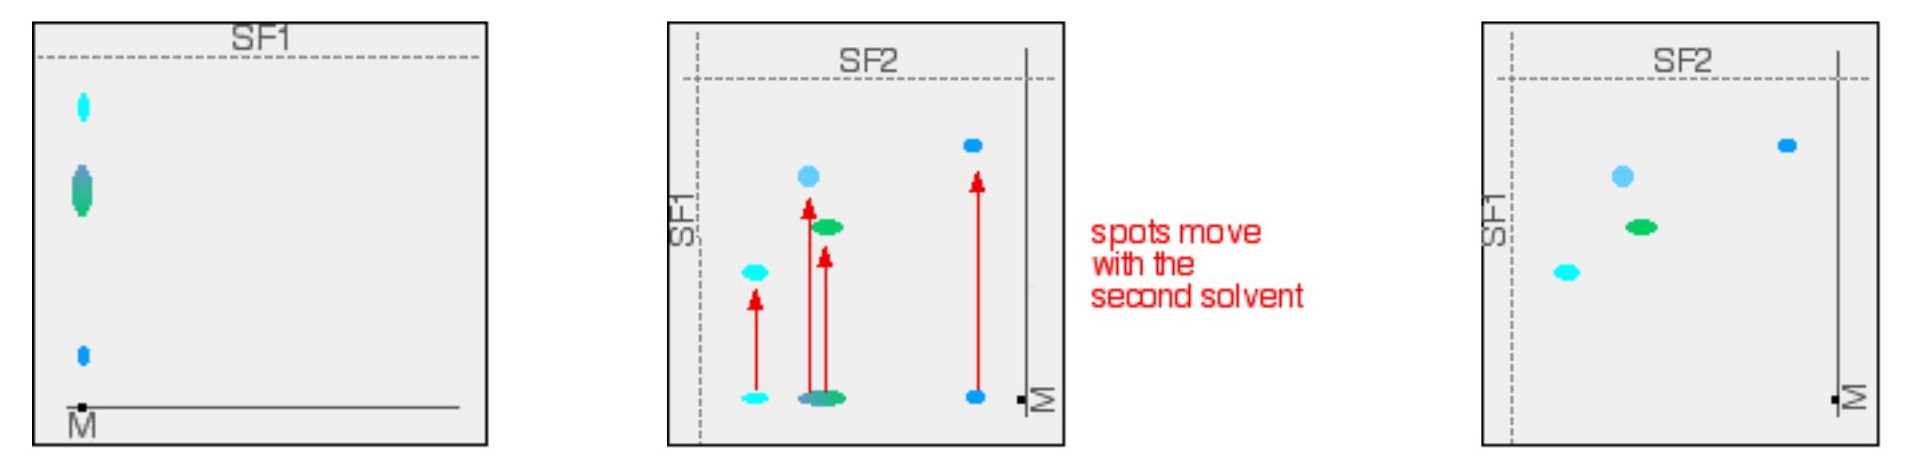
Two-way paper chromatography gets around the problem of separating out substances which have very similar Rf values (Figure 29.2e.). A single spot of mixture placed towards one end of the base line. It is stood in a solvent as before and left until the solvent front gets close to the top of the paper. Once dried, the paper is rotated through 90°, and developed again in a different solvent. The spots will separate as the compounds will interact differently with the new mobile phase.
Thin Layer Chromatography (TLC)
Thin layer chromatography (TLC) is done exactly as it says – using a thin, uniform layer of silica gel or alumina coated onto a piece of glass, metal or rigid plastic. The silica gel (or the alumina) is the stationary phase. The stationary phase for thin layer chromatography also often contains a substance which fluoresces in UV light. The mobile phase is a suitable liquid solvent or mixture of solvents.
Thin layer chromatography is very similar to paper chromatography in how it is setup, run and analyzed (Figure 29.2f.). Pencil is used to draw the starting line (not ink). The sample spot is allowed to dry before placing in the beaker. The beaker is covered to ensure the solvent vapour fills the beaker and doesn’t escape (especially important when using highly volatile solvents) allowing the solvent to travel up the plate and not evaporate. The solvent level is below that of the sample spot.
As the solvent slowly travels up the plate, the different components of the dye mixture travel at different rates and the mixture is separated into different coloured spots. Figure 29.2g. shows the plate after the solvent has moved about halfway up it. The solvent is allowed to rise until it almost reaches the top of the plate. That will give the maximum separation of the dye components for this particular combination of solvent and stationary phase.
The resulting TLC separation in then analyzed. If you wanted to know is how many different components made up the mixture, it could be determined visually. However, Rf measurements are often taken from the plate in order to help identify the compounds present. These measurements, as with paper chromatography, are the distance traveled by individual spots divided by the distance traveled by the solvent. When the solvent front gets close to the top of the plate, the plate is removed from the beaker and the position of the solvent is marked with another line before it has a chance to evaporate.
Exercise 29.2a
In this TLC experiment, three dots of purple ink are placed on the base line (1). The TLC is exposed to solvent and the solvent front is allowed to reach the top of the plate (line 4). After drying, the distance the red (3) and blue (2) dots travelled are recorded. Calculate the Rf value for each coloured dot using these values. (1) is at 0.0 cm, (2) is at 1.9 cm. (3) is at 4.7 cm and (4) is 6.1 cm.

Check Your Answer:[1]
If you could repeat this experiment under exactly the same conditions, then the Rf values for each component would always be the same. However, if anything changes (the temperature, the exact composition of the solvent, and so on), that is no longer true.
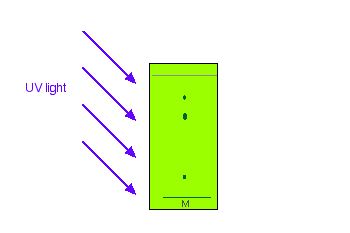
If the components of the mixture being separated are not visible (colourless), they can be spotted using fluorescence (hence the UV fluorescent compound in the TLC coating). The TLC plate will glow under UV light and the glow is masked at the position where the spots are. The spots show up as darker patches (Figure 29.2h.). Using pencil while under UV light, these spots can be marked on the plate for analysis. Exposing the TLC plate to chemicals may also allow the spots to be seen (see Figure 29.2d.).
The TLC process relies on physical differences between the stationary and mobile phases and the components of the sample being tested. As the solvent (mobile phase) begins to soak up the TLC plate (stationary phase), it first dissolves the compounds in the spot on the base line. The compounds present will then tend to get carried up the chromatography plate as the solvent continues to move upwards. How fast the compounds get carried up the plate depends on two things:
- How soluble the compound is in the solvent. This will depend on how much attraction there is between the molecules of the compound and those of the solvent.
- How much the compound sticks (adsorb) to the stationary phase – the silica gel or alumina. This will depend on how much attraction there is between the molecules of the compound and the silica gel.
Adsorption isn’t permanent – there is a constant movement of a molecule between being adsorbed onto the silica gel surface and going back into solution in the solvent. Obviously, the compound can only travel up the plate during the time that it is dissolved in the solvent. While it is adsorbed on the silica gel, it is temporarily stopped – the solvent is moving on without it. That means that the more strongly a compound is adsorbed, the less distance it can travel up the plate.
Attribution & References
- Red Rf = 0.77, Blue Rf = 0.31 ↵
