29.6 Infrared (IR) Spectroscopy
Learning Objectives
By the end of this section, you will be able to:
- Describe how molecules vibrate and how an IR spectrum is formed.
- Explain the IR spectrum in terms of general organic functional groups.
- Correlate parts of a molecule’s structure and its IR spectrum.
Vibrating Molecules
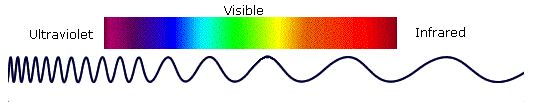
Photon energies associated with the infrared (from 1 to 15 kcal/mole) (Figure 29.6a.) are not large enough to excite electrons but may induce vibrational excitation of covalently bonded atoms and groups.
The covalent bonds in molecules are not rigid sticks or rods, such as found in molecular model kits, but are more like stiff springs that can be stretched and bent. We must now recognize that, in addition to the rotation of groups about single bonds, molecules experience a wide variety of vibrational motions, characteristic of their component atoms. Consequently, virtually all organic compounds will absorb infrared radiation that corresponds in energy to these vibrations. Infrared spectrometers permit chemists to obtain absorption spectra of compounds that are a unique reflection of their molecular structure.
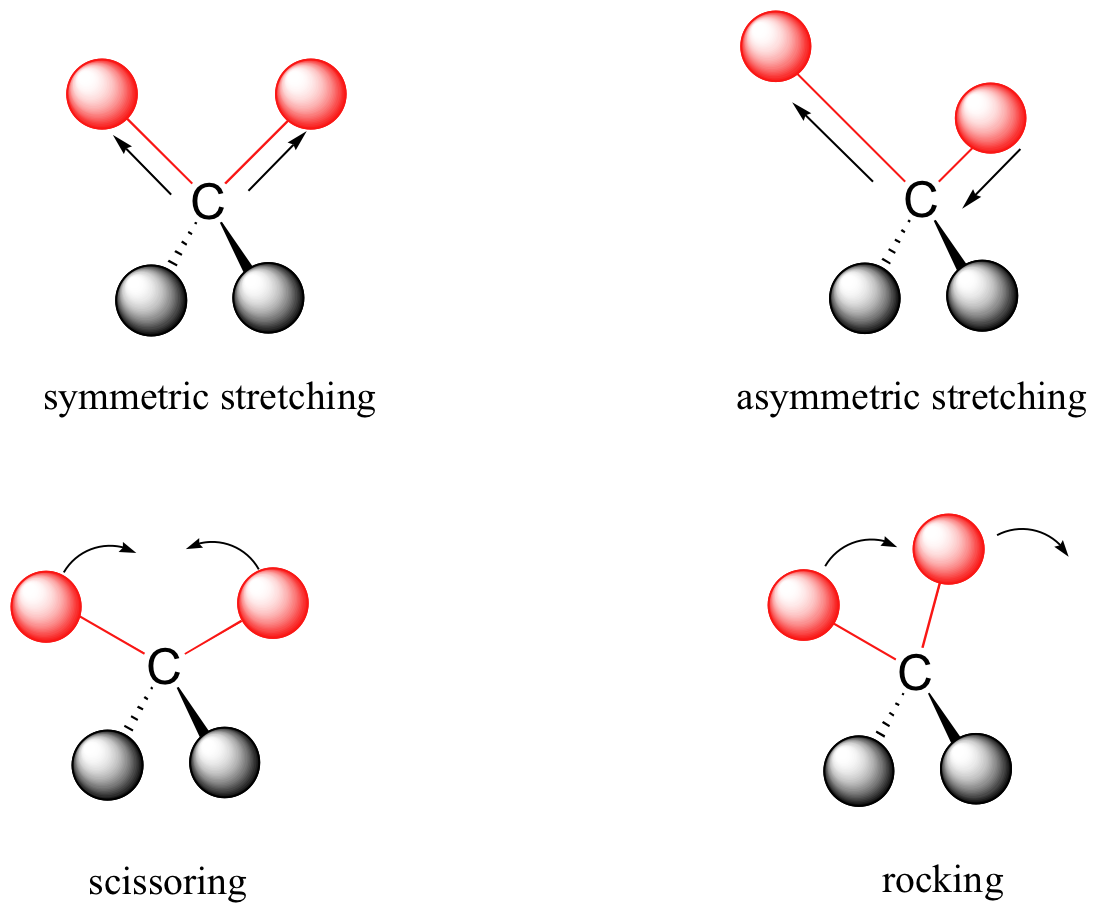
At room temperature, organic molecules are always in motion, as their bonds stretch, bend, and twist. These complex vibrations can be broken down mathematically into individual vibrational modes. Vibrational modes of bonds within molecules are often given descriptive names, such as stretching, bending, scissoring, rocking and twisting (Figure 29.6b.).
The energy of molecular vibration is quantized rather than continuous, meaning that a molecule can only stretch and bend at certain ‘allowed’ frequencies. If a molecule is exposed to electromagnetic radiation that matches the frequency of one of its vibrational modes, it will in most cases absorb energy from the radiation and jump to a higher vibrational energy state – what this means is that the amplitude of the vibration will increase, but the vibrational frequency will remain the same. The difference in energy between the two vibrational states is equal to the energy associated with the wavelength of radiation that was absorbed. It turns out that it is the infrared region of the electromagnetic spectrum which contains frequencies corresponding to the vibrational frequencies of organic bonds.
Infrared (IR) Spectrum
We will use a ketone sample to illustrate this process. The sample is irradiated with infrared light and the carbonyl bond will specifically absorb light with this same frequency. When the carbonyl bond absorbs this energy, it jumps up to an excited vibrational state (Figure 29.6c.). The molecule does not remain in its excited vibrational state for very long, but quickly releases energy to the surrounding environment in form of heat and returns to the ground state.
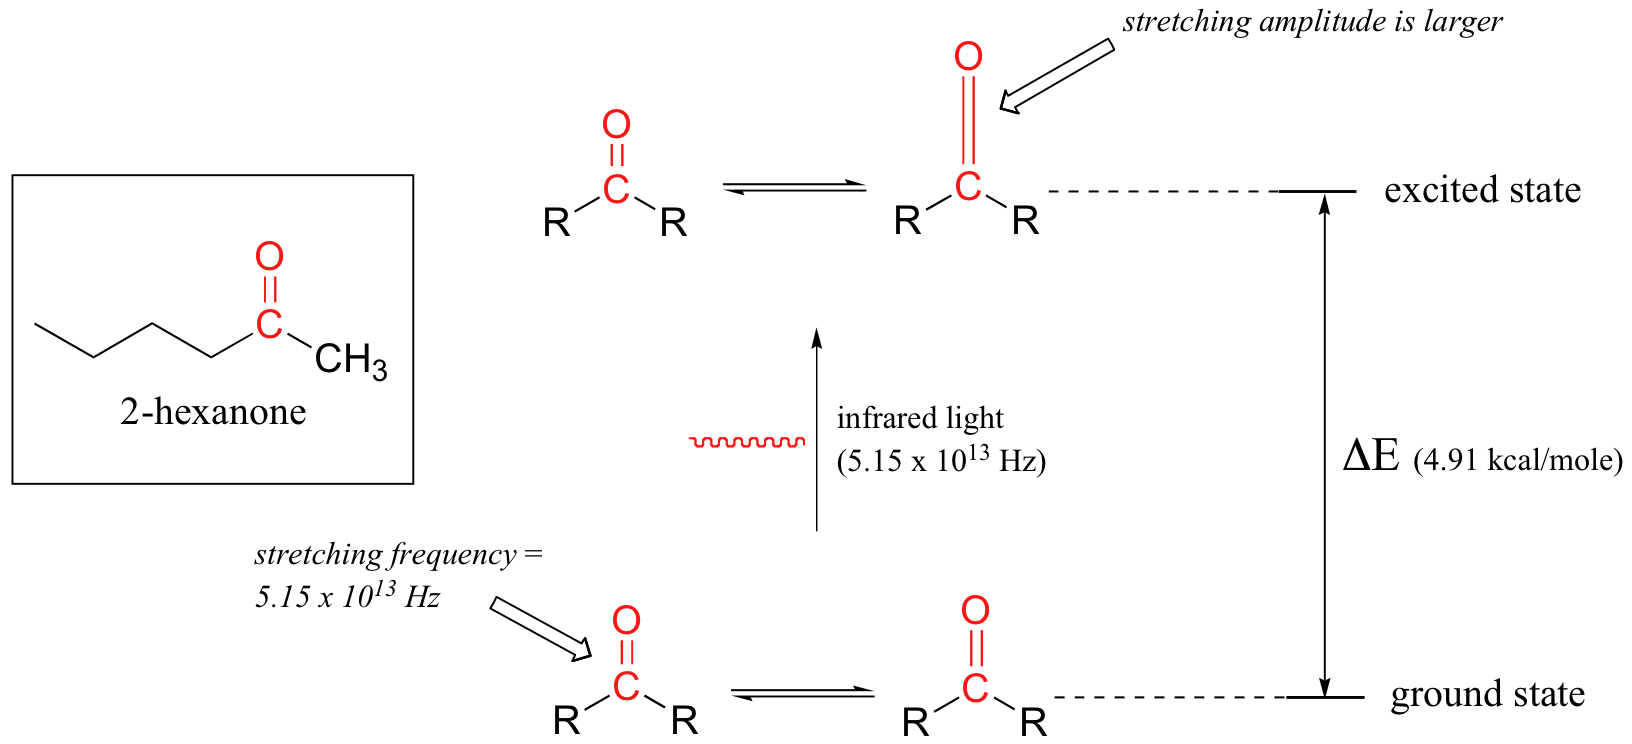
With an instrument called an infrared spectrophotometer, we can ‘see’ this vibrational transition. In the spectrophotometer, infrared light is passed through the sample. Most frequencies pass right through the sample and are recorded by a detector on the other side. Our carbonyl stretching frequency, however, is absorbed by the sample, and so the detector records that the intensity of this frequency, after having passed through the sample, is something less than 100% of its initial intensity. The vibrations of a 2-hexanone molecule are not, of course, limited to the simple stretching of the carbonyl bond. The various carbon-carbon bonds also stretch and bend, as do the carbon-hydrogen bonds, and all of these vibrational modes also absorb different frequencies of infrared light. The IR spectrum for 2-hexanone is shown in Figure 29.6d. The technique is therefore very useful as a means of identifying which functional groups are present in a molecule of interest. If we pass infrared light through an unknown sample and find that it absorbs in the carbonyl frequency range but not in the alkyne range, we can infer that the molecule contains a carbonyl group but not an alkyne.

The power of infrared spectroscopy arises from the observation that different functional groups have different characteristic absorption frequencies.
Some General Trends:
- Stretching frequencies are higher than corresponding bending frequencies. (It is easier to bend a bond than to stretch or compress it.)
- Bonds to hydrogen have higher stretching frequencies than those to heavier atoms.
- Triple bonds have higher stretching frequencies than corresponding double bonds, which in turn have higher frequencies than single bonds. (Except for bonds to hydrogen).
- Some bonds do not absorb infrared light at all and will not show in a spectrum.
Infrared spectra may be obtained from samples in all phases (liquid, solid and gaseous). Liquids are usually examined as a thin film sandwiched between two polished salt plates (note that glass absorbs infrared radiation, whereas NaCl is transparent). If solvents are used to dissolve solids, care must be taken to avoid obscuring important spectral regions by solvent absorption. Perchlorinated solvents such as carbon tetrachloride, chloroform and tetrachloroethene are commonly used. Alternatively, solids may either be incorporated in a thin KBr disk, prepared under high pressure, or mixed with a little non-volatile liquid and ground to a paste (or mull) that is smeared between salt plates.
General Functional Group Bands
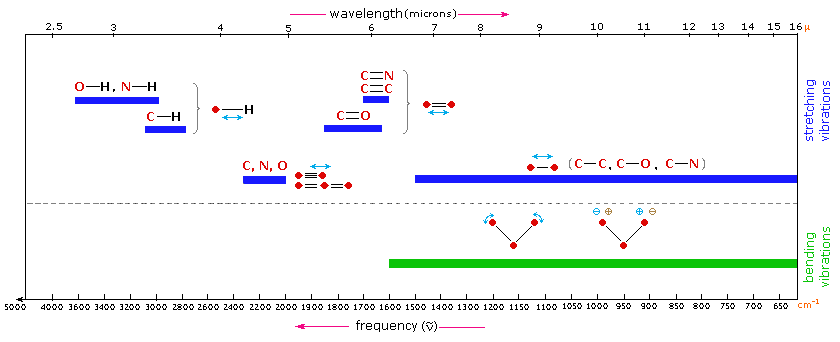
The general regions of the infrared spectrum in which various kinds of vibrational bands are observed are outlined in Figure 26.9e. and Figure 26.9f. Note that the blue coloured sections above the dashed line refer to stretching vibrations, and the green coloured band below the line encompasses bending vibrations. The complexity of infrared spectra in the 1450 to 600 cm-1 region makes it difficult to assign all the absorption bands, and because of the unique patterns found there, it is often called the fingerprint region. Absorption bands in the 4000 to 1450 cm-1 region are usually due to stretching vibrations of diatomic units, and this is sometimes called the group frequency region.
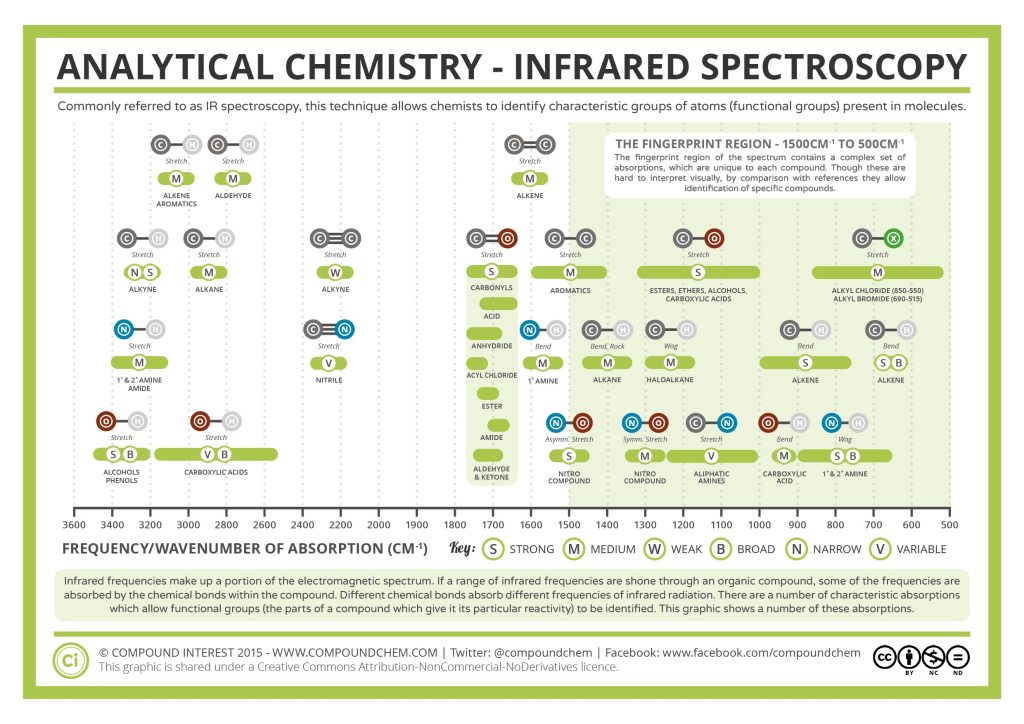
As you can imagine, obtaining an IR spectrum for a compound will not allow us to figure out the complete structure of even a simple molecule, unless we happen to have a reference spectrum for comparison. In conjunction with other analytical methods, however, IR spectroscopy can prove to be a very valuable tool, given the information it provides about the presence or absence of key functional groups. IR can also be a quick and convenient way for a chemist to check to see if a reaction has proceeded as planned. If we were to run a reaction in which we wished to convert cyclohexanone to cyclohexanol, for example, a quick comparison of the IR spectra of starting compound and product would tell us if we had successfully converted the ketone group to an alcohol.
Example 29.6a
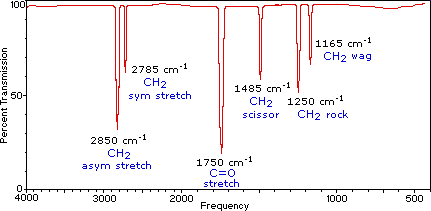
Identify the various vibrations in the infrared spectrum of methanal (formaldehyde), H2C=O, given the following data:
- 1750 cm-1
- 2785 cm-1
- 2850 cm-1
Solution
Here is the infrared spectrum of methanal. The fingerprint region from 0 to 1500 cm-1 is not typically analyzed.
Example 29.6b
Here is the IR spectrum for octanoic acid. Explain the identification of the labelled peaks.

Solution
There is a very broad ‘mountain’ centered at about 3200 cm-1. This signal is characteristic of the O-H stretching mode of alcohols, and is a dead giveaway for the presence of an alcohol group. The breadth of this signal is a consequence of hydrogen bonding between molecules.
In the spectrum of octanoic acid we see, as expected, the characteristic carbonyl peak, this time at 1709 cm-1. We also see a low, broad absorbance band that looks like an alcohol, except that it is displaced slightly to the right (long-wavelength) side of the spectrum, causing it to overlap to some degree with the C-H region. This is the characteristic carboxylic acid O-H single bond stretching absorbance.
Source: Map: Organic Chemistry (Wade) by LibreTexts, licensed under CC BY-NC-SA 4.0
Example 29.6c
Here is the IR spectrum for 1-octene. Explain the identification of the labelled peaks.

Solution
The spectrum for 1-octene shows two peaks that are characteristic of alkenes: the one at 1642cm-1 is due to stretching of the carbon-carbon double bond, and the one at 3079 cm-1 is due to stretching of the s bond between the alkene carbons and their attached hydrogens.
Alkynes have characteristic IR absorbance peaks in the range of 2100-2250 cm-1 due to stretching of the carbon-carbon triple bond, and terminal alkenes can be identified by their absorbance at about 3300 cm-1, due to stretching of the bond between the sp-hybridized carbon and the terminal hydrogen.
Source: Map: Organic Chemistry (Wade) by LibreTexts, licensed under CC BY-NC-SA 4.0
Example 29.6d
Correlate the labelled peaks in these figures to the provided structure and to the data provided in Infographic 29.6a.
Solutions
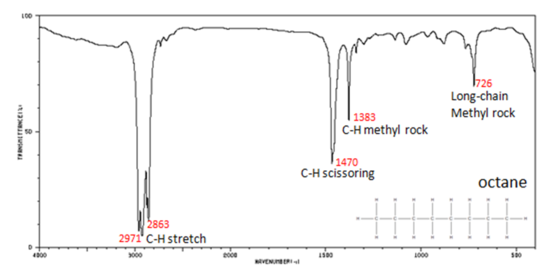
Figure 29.6i.: shows the IR spectrum of octane. Since most organic compounds have these features, these C-H vibrations are usually not noted when interpreting a routine IR spectrum. Note that the change in dipole moment with respect to distance for the C-H stretching is greater than that for others shown, which is why the C-H stretch band is the more intense. In alkanes, which have very few bands, each band in the spectrum can be assigned:
- C–H stretch from 3000–2850 cm-1
- C–H bend or scissoring from 1470-1450 cm-1
- C–H rock, methyl from 1370-1350 cm-1
- C–H rock, methyl, seen only in long chain alkanes, from 725-720 cm-1
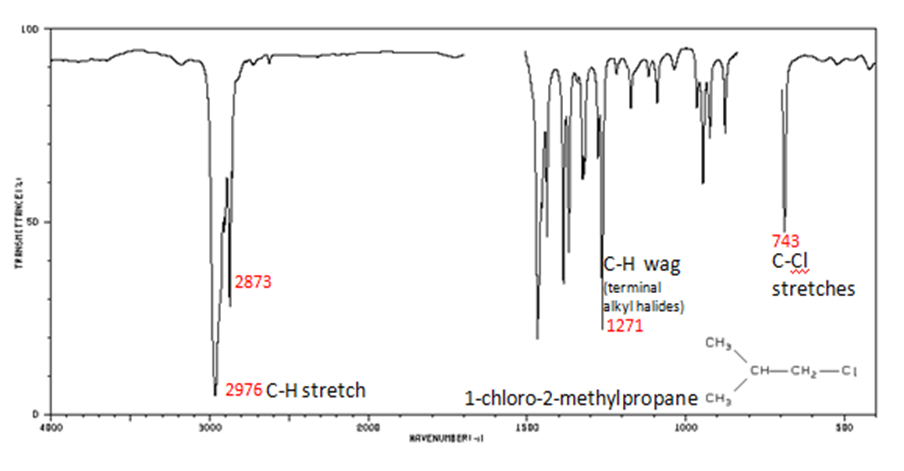
Figure 29.6j.: Alkyl halides are compounds that have a C–X bond, where X is a halogen: bromine, chlorine, fluorene, or iodine. The alkane components are similar to the answer for Figure 29.6j.
- C–H wag (-CH2X) from 1300-1150 cm-1
- C–X stretches (general) from 850-515 cm-1
- C–Cl stretch 850-550 cm-1
- C–Br stretch 690-515 cm-1
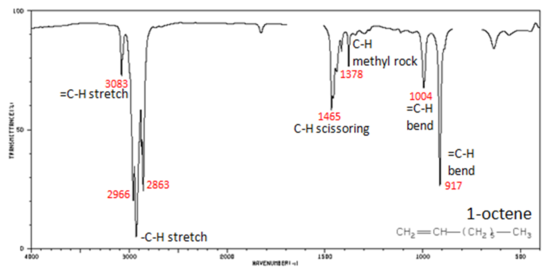
Figure 29.6k.: shows the IR spectrum of 1-octene. As alkanes compounds, these bands are not specific and are generally not noted because they are present in almost all organic molecules. In alkenes compounds, each band in the spectrum can be assigned:
- C=C stretch from 1680-1640 cm-1
- =C–H stretch from 3100-3000 cm-1
- =C–H bend from 1000-650 cm-1
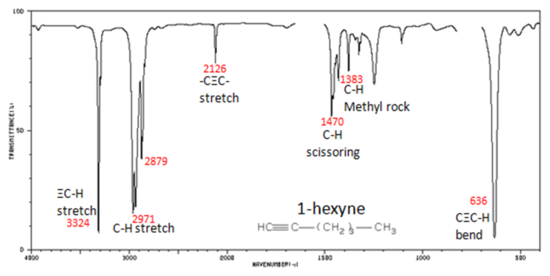
Figure 29.6l.: shows the spectrum of 1-hexyne, a terminal alkyne. In alkynes, each band in the spectrum can be assigned:
- –C≡C– (triple bond) stretch from 2260-2100 cm-1
- –C≡C–H: (triple bond) C–H stretch from 3330-3270 cm-1
- –C≡C–H: (triple bond) C–H bend from 700-610 cm-1
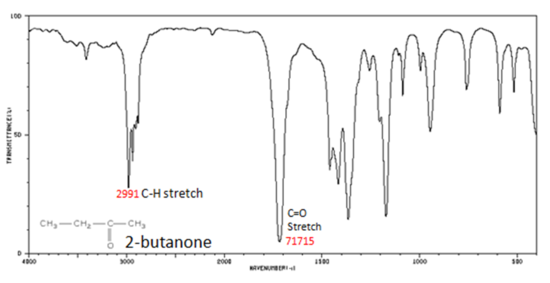
Figure 29.6m.: shows the spectrum of 2-butanone. This is a saturated ketone, and the C=O band appears at 1715 cm-1. The carbonyl stretching vibration band C=O of saturated aliphatic ketones appears:
- C=O stretch – aliphatic ketones 1715 cm-1
- C=O stretch – unsaturated ketones 1685-1666 cm-1
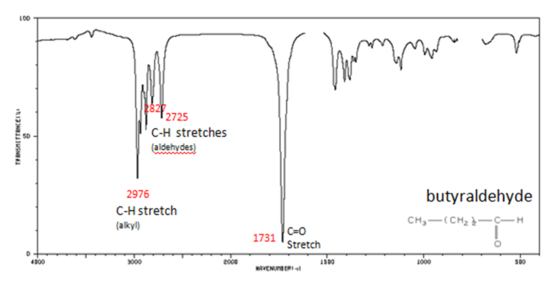
Figure 29.6n.: If a compound is suspected to be an aldehyde, a peak always appears around 2720 cm-1 which often appears as a shoulder-type peak just to the right of the alkyl C–H stretches.
- H–C=O stretch 2830-2695 cm-1
- C=O stretch:
- aliphatic aldehydes 1740-1720 cm-1
- alpha, beta-unsaturated aldehydes 1710-1685 cm-1
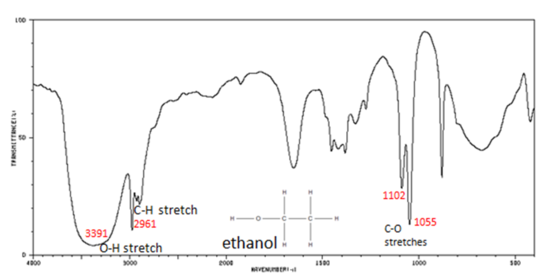
Figure 29.6o.: shows the spectrum of ethanol. Note the very broad, strong band of the O–H stretch. Alcohols have IR absorptions associated with both the O-H and the C-O stretching vibrations.
- O–H stretch, hydrogen bonded 3500-3200 cm-1
- C–O stretch 1260-1050 cm-1
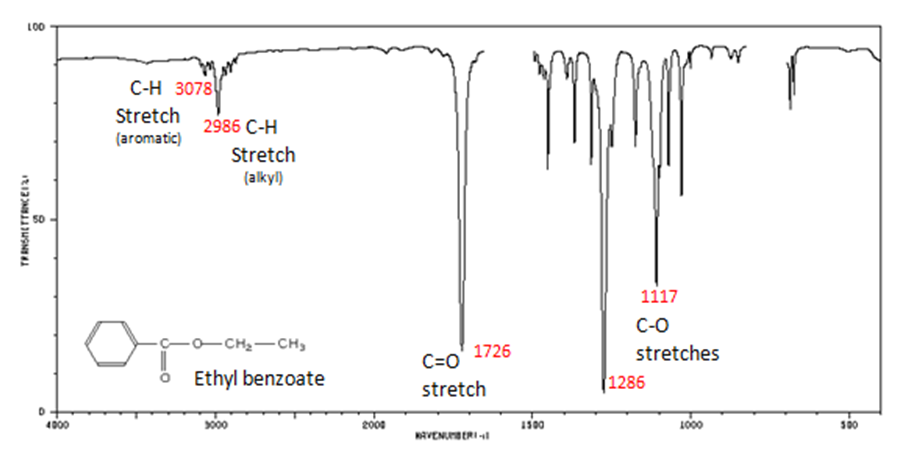
Figure 29.6p.: The carbonyl stretch C=O of esters appears as:
- C=O stretch
- aliphatic from 1750-1735 cm-1
- unsaturated from 1730-1715 cm-1
- C–O stretch from 1300-1000 cm-1
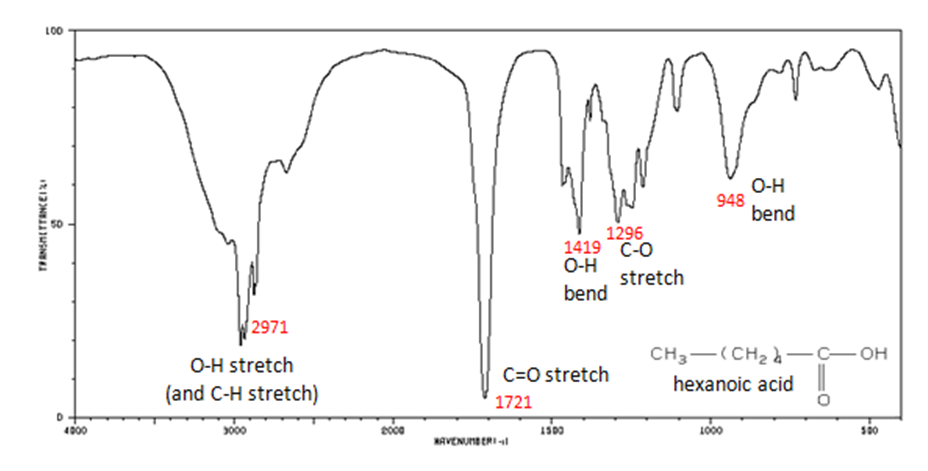
Figure 29.6q.: The carbonyl stretch C=O of a carboxylic acid appears as an intense band from 1760-1690 cm-1. The exact position of this broad band depends on whether the carboxylic acid is saturated or unsaturated, dimerized, or has internal hydrogen bonding.
- O–H stretch from 3300-2500 cm-1
- C=O stretch from 1760-1690 cm-1
- C–O stretch from 1320-1210 cm-1
- O–H bend from 1440-1395 and 950-910 cm-1
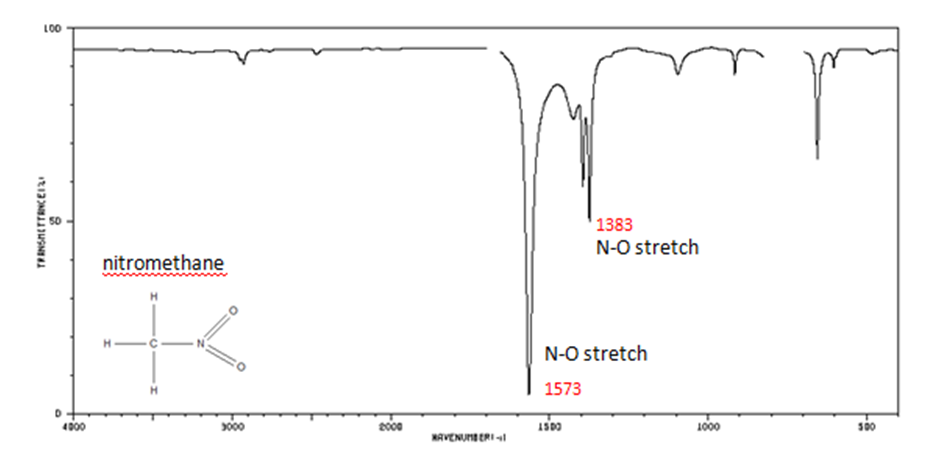
Figure 29.6r.: In organic nitrogen compounds,
- N–O asymmetric stretch from 1550-1475 cm-1
- N–O symmetric stretch from 1360-1290 cm-1
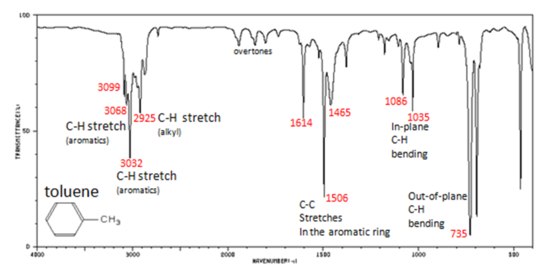
Figure 29.6s.: In aromatic compounds, each band in the spectrum can be assigned:
- C–H stretch from 3100-3000 cm-1
- overtones, weak, from 2000-1665 cm-1
- C–C stretch (in-ring) from 1600-1585 cm-1
- C–C stretch (in-ring) from 1500-1400 cm-1
- C–H “oop” from 900-675 cm-1
Note that this is at slightly higher frequency than is the –C–H stretch in alkanes. This is a very useful tool for interpreting IR spectra. Only alkenes and aromatics show a C–H stretch slightly higher than 3000 cm-1
Source: Map: Organic Chemistry (Wade) by LibreTexts, licensed under CC BY-NC-SA 4.0
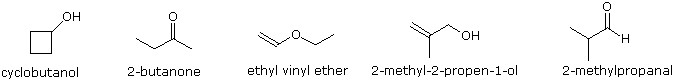
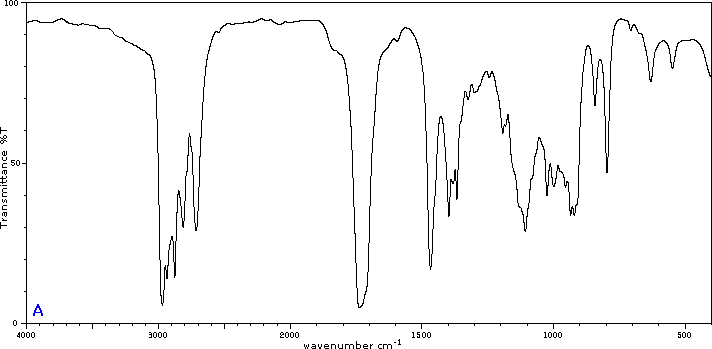
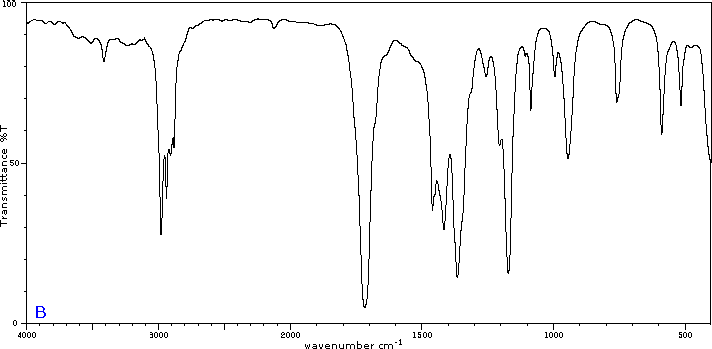
Exercise 29.6a
Five infrared spectra are provided for isomers of C4H8O. Their structural formulas are also provided in Figure 29.6t. Associate each spectrum (Figure 29.6v through z) with one of the isomers.
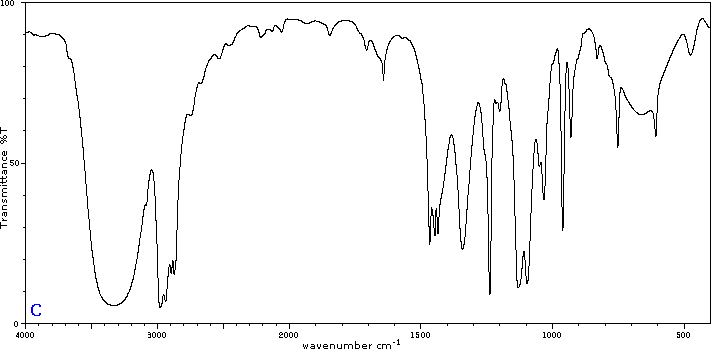
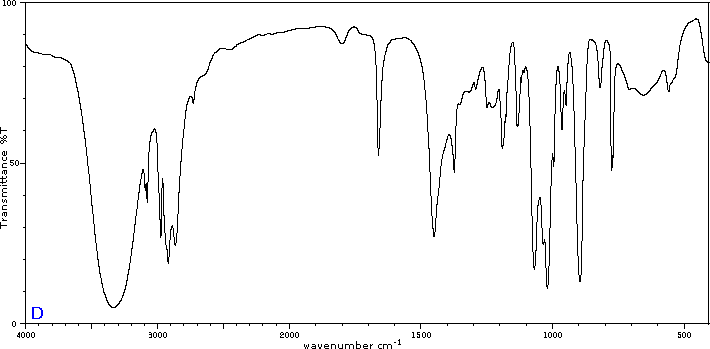
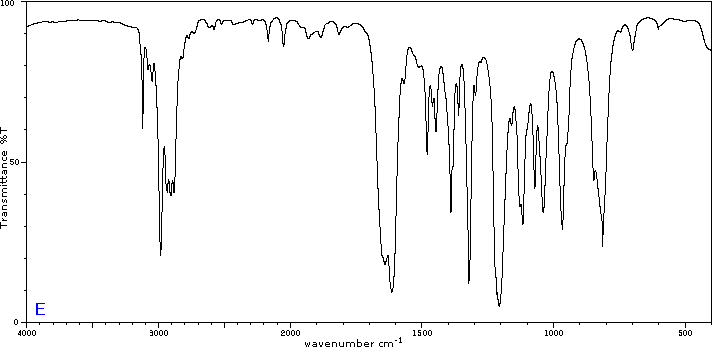
Check Your Answers:[1]
Source: Map: Organic Chemistry (Wade) by LibreTexts, licensed under CC BY-NC-SA 4.0
Links to Enhanced Learning
The Chemical Detectives app on Chemical Detectives – Apps on Google Play [New tab] and Chemical Detectives on the App Store[New tab] allows users to browse various types of spectra (IR, MS, 1H NMR, 13C NMR, and elemental microanalysis) for simple organic compounds and also complete quizzes about various compounds based on their spectra. Customize of types of functional groups is possible (e.g. only hydrocarbons or only alcohols).
Attribution & References
Except where otherwise noted, this page is adapted by Samantha Sullivan Sauer from:
- “11.2 Infrared (IR) Spectroscopy” In Map: Organic Chemistry (Wade) by LibreTexts, licensed under CC BY-NC-SA 4.0.
Attributions & contributions from original pages:- William Reusch, Professor Emeritus (Michigan State U.), Virtual Textbook of Organic Chemistry
- Dr. Dietmar Kennepohl FCIC (Professor of Chemistry, Athabasca University)
- Prof. Steven Farmer (Sonoma State University)
- Organic Chemistry With a Biological Emphasis by Tim Soderberg (University of Minnesota, Morris)
- William Reusch, Professor Emeritus (Michigan State U.), Virtual Textbook of Organic Chemistry
-
Figure 29.6v: 2-methylpropanal, Figure 29.6w: 2-butanone, Figure 29.6x: cyclobutanol, Figure 29.6y: 2-methyl-2-propen-1-ol, Figure 29.6z: ethyl vinyl ether
↵
complex region of infrared spectra in the 1450 to 600 cm-1 region
