29.9 1H NMR Spectroscopy
Learning Objectives
By the end of this section, you will be able to:
- Identify those hydrogen atoms (protons) which are equivalent in a given chemical structure.
- State the approximate chemical shift for various organic functional groups.
- Predict the approximate chemical shifts of each of the protons in an organic compound, given its structure and a table of chemical shift correlations.
- Use an integrated 1H NMR spectrum to determine the ratio of the different types of protons present in an organic compound.
- Explain the spin-spin splitting pattern observed in the 1H NMR spectrum of a simple organic compound.
- Explain what information can be obtained from an integrated 1H NMR spectrum and use this information in the interpretation of such a spectrum.
Building on the principles of NMR explained in the previous section, the interpretation of 1H NMR is the focus of this section. To start, identifying the equivalent hydrogens within an organic molecule is required. In this section, the term proton and hydrogen atom are used interchangeably as a hydrogen atom without its electron is a proton and when bonded hydrogen rarely maintains control of its electron due to its low electronegativity.
Equivalent Hydrogen Atoms
Given that chemically nonequivalent protons (hydrogen atoms) have different resonance frequencies in the same applied magnetic field, we can see how NMR spectroscopy can provide us with useful information about the structure of an organic molecule.
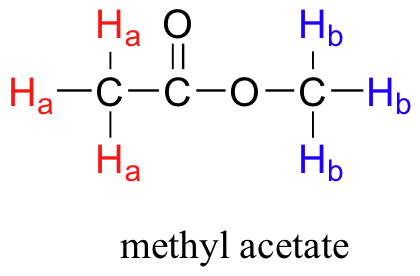
In general, to obtain a NMR spectrum, a sample compound, methyl acetate (methyl ethanoate) (Figure 29.9a.) is placed inside a very strong applied magnetic field (B0). All of the protons begin to precess: the Ha protons at different frequency than the Hb protons. At first, the magnetic moments of (slightly more than) half of the protons are aligned with B0, and half are aligned against B0. Then, the sample is hit with electromagnetic radiation in the radio frequency range. The two specific frequencies which match those of Ha protons and the Hb protons cause those Ha and Hb protons which are aligned with B0 to ‘flip’ so that they are now aligned against B0. In doing so, the protons absorb radiation at the two resonance frequencies. The NMR instrument records which frequencies were absorbed, as well as the intensity of each absorbance.
In most cases, a sample being analyzed by NMR is in solution. If we use a common laboratory solvent (diethyl ether, acetone, dichloromethane, ethanol, water, etc.) to dissolve our NMR sample, however, we run into a problem – there many more solvent protons in solution than there are sample protons, so the signals from the sample protons will be overwhelmed. To get around this problem, we use special NMR solvents in which all protons have been replaced by deuterium. Recall that deuterium is NMR-active, but its resonance frequency is very different from that of protons, and thus it is `invisible` in 1H-NMR. A common NMR solvent is CDCl3 (deuterated trichloromethane/chloroform).
NMR Spectrum
The 1H-NMR spectrum for methyl acetate (methyl ethanoate) is shown in Figure 29.9b. The vertical axis corresponds to intensity of absorbance, the horizontal axis to frequency (typically the vertical axis is not shown in an NMR spectrum).
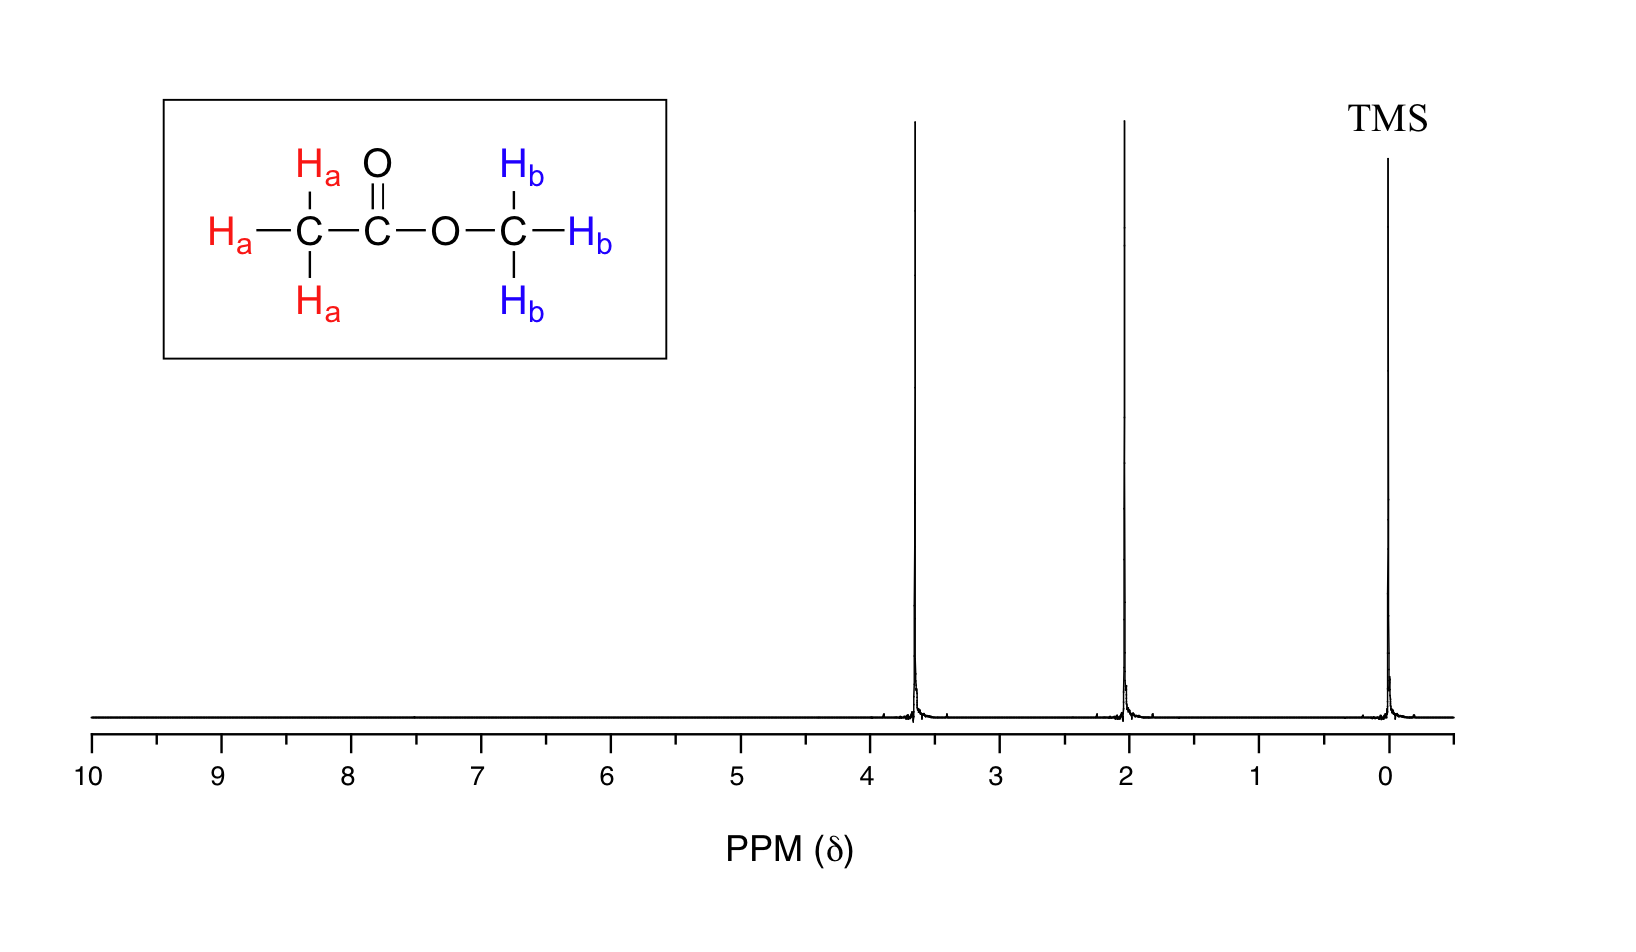
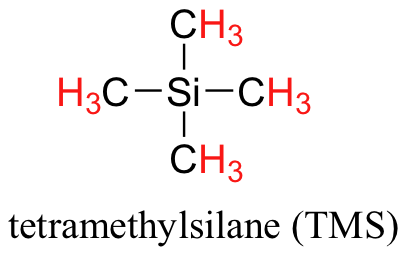
There are three absorbance signals: two of these correspond to Ha and Hb, while the peak at the far right (0 ppm) of the spectrum corresponds to the 12 chemically equivalent protons in tetramethylsilane (TMS) (Figure 29.9c.), a standard reference compound that was added to the sample. Very few organic molecules contain protons with chemical shifts that are negative relative to TMS.
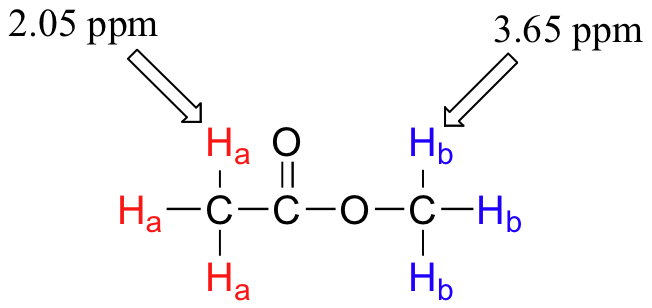
The two proton groups in our methyl ethanoate sample are recorded as resonating at frequencies 2.05 and 3.67 ppm higher than TMS. Expressed this way, the resonance frequency for a given proton in a molecule is called its chemical shift. A frequently used symbolic designation for chemical shift in ppm is the lower-case Greek letter delta (δ). Most protons in organic compounds have chemical shift values between 0 and 12 ppm from TMS, although values below zero and above 12 are occasionally observed. By convention, the left-hand side of an NMR spectrum (higher chemical shift) is called downfield, and the right-hand direction is called upfield.
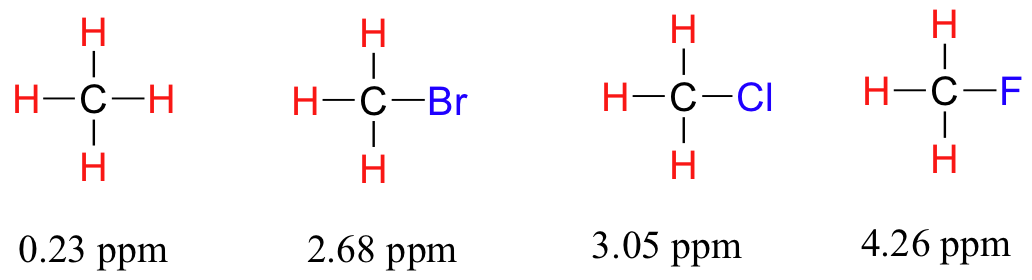
Why do nonequivalent protons have different chemical shifts? The chemical shift of a given proton is determined primarily by its immediate electronic environment. Consider fluoromethane fluoride, CH3F, in which the protons have a chemical shift of 4.26 ppm, significantly higher than that of methane at 0.23 ppm. Because fluorine is more electronegative than carbon, it pulls valence electrons away from the carbon, effectively decreasing the electron density around each of the protons. For the protons, lower electron density means less shielding and lower chemical shift. As the electronegativity of the substituent increases, so does the extent of deshielding, and so does the chemical shift. This is evident in Figure 29.9d. with the chemical shifts of methane and three halomethane compounds. As the number of electronegative substituents increases in a compound, the more deshielding that happens and the greater the chemical shift. The deshielding effect of an electronegative substituent diminishes sharply with increasing distance.
Armed with this information, the two peaks in the 1H-NMR spectrum (Figure 29.9b.) of methyl ethanoate can be identified (Figure 29.9e.). The signal at 3.65 ppm corresponds to the THREE methyl protons (Hb), which are deshielded by the adjacent oxygen atom. The signal at 2.05 ppm corresponds to the THREE ethanoate protons (Ha), which is deshielded – but to a lesser extent – by the adjacent carbonyl group.
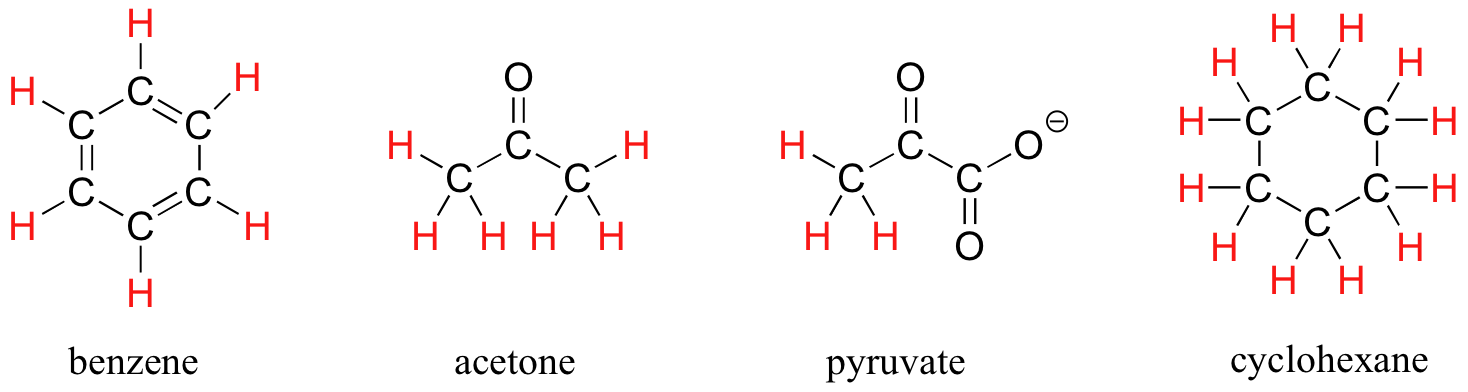
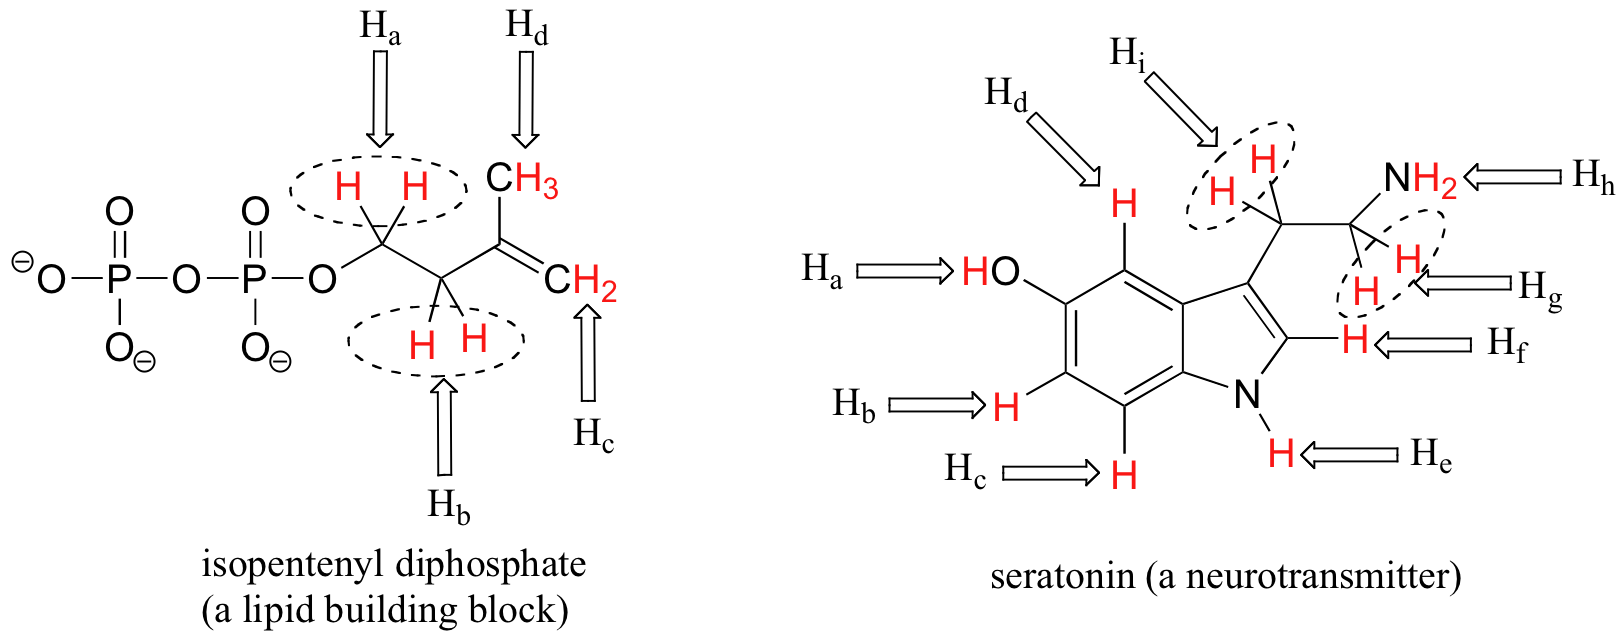
The ability to recognize chemical equivalency and nonequivalency among atoms in a molecule will be central to understanding NMR. In each of the molecules in Figure 29.9f., all protons are chemically equivalent, and therefore will have the same resonance frequency in an NMR experiment.
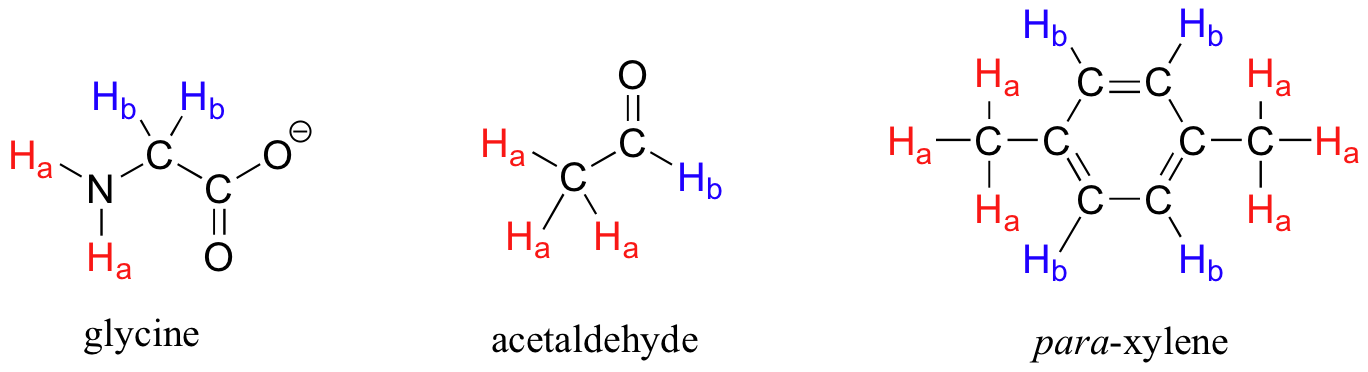
Each the molecules in Figure 29.9g. contains two sets of protons, just like the previous example of methyl ethanoate, and again in each case the resonance frequency of the Ha protons will be different from that of the Hb protons. Notice how the symmetry of para-xylene results in there being only two different sets of protons.
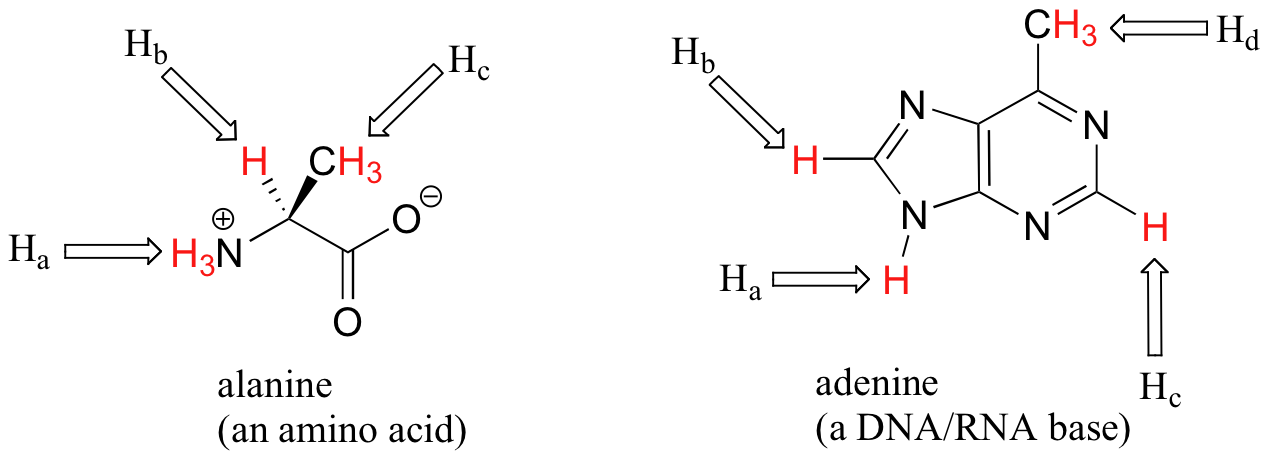
Most organic molecules (Figures 29.9h. and 29.9i.) have several sets of protons in different chemical environments, and each set, in theory, will have a different resonance frequency in 1H-NMR spectroscopy.
Example 29.9a
Identify the number different hydrogen signals in each compound and list the number of hydrogen atoms making each signal.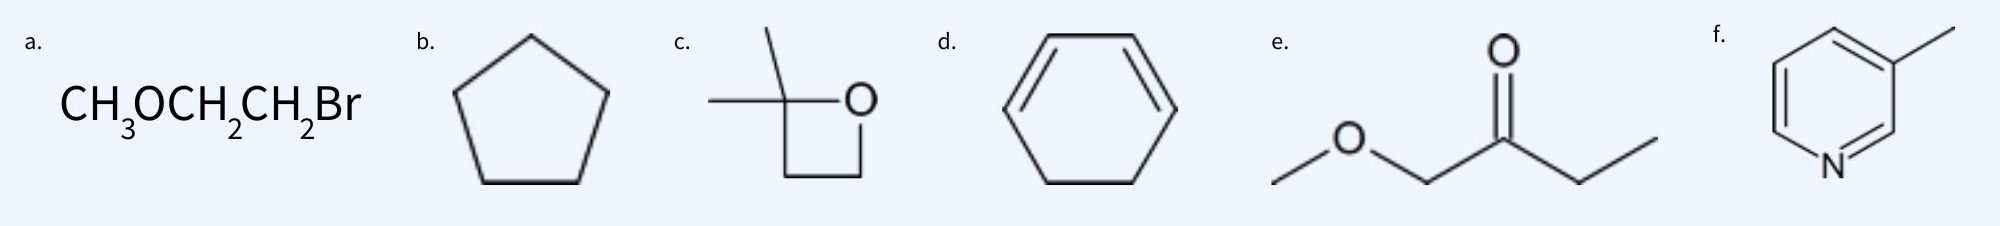
Solutions
| Structure | Number of Signals | Ratio of Signals | Reasoning | |
|---|---|---|---|---|
| CH3OCH2CH2Br | 3 | A : B : C | 3 : 2 : 2 | Each CH2 group is located next to different electronegative atoms so their shifts will be different. |
 |
1 | All H’s are equivalent. Each carbon (point) has 2 H’s on it. Total of 10 H’s in the compound. | ||
 |
3 | A : B : C | 2 : 2 : 6 (or 1 : 1 : 3) | The two CH3 groups in the left are equivalent (6 H’s). The carbon on the lower left has 2 H’s. These are different than the 2 H’s on the lower right carbon (which is next to an electronegative O atom). |
 |
3 | A : B : C | 2 : 4 : 2 (or 1 : 2 : 1) | At the top of the ring, there is one H attached to each carbon. These two H’s are connected in the same manner to double bonds so create one signal. Each carbon at the other end of the double bonds has one H. These create another signal. The two carbons at the bottom of the ring have two H’s each. These four H’s create one signal. |
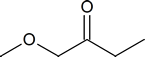 |
4 | A : B : C : D | 3 : 2 : 2 : 3 | Starting on the right, the CH3 group is one signal. The CH2 next to it is another group (next to carbonyl group). Between the O and the carbonyl group is another CH2 which different as it’s next to two electronegative groups. The final CH3 group attached to the O atom is the final signal. |
 |
5 | A : B : C : D : E | 3 : 1 : 1 : 1 : 1 | The CH3 group is one signal. Each carbon in the ring has one H except where the methyl group is attached. Each H attached to the ring is a different distance from the N atom as well as the double bond presence, so each creates its own signal. |
-
Source: Example 29.9a is adapted from Map: Organic Chemistry (Wade), CC BY-NC-SA 4.0.
Exercise 29.9a
How many non-equivalent hydrogens are in the following molecules? (How many different signals will be seen in a 1H NMR spectrum?)
- CH3CH2CH2Br
- CH3OCH2C(CH3)3
- Ethyl Benzene
- 2-methyl-1-hexene
Check Your Answers: [1]
- Source: Exercise 29.9a is adapted from Map: Organic Chemistry (Wade), CC BY-NC-SA 4.0.
Chemical Shifts in 1NMR Spectrum
It is important to understand trend of chemical shift in terms of NMR interpretation. The proton NMR chemical shift is affected by nearness to electronegative atoms (O, N, halogen) and unsaturated groups (C=C, C=O, aromatic). 1H chemical shifts play a role in identifying many functional groups. Infographic 29.9a. and Figure 29.9j. indicate chemical shifts of important functional groups. Tetramethylsilane (TMS) is generally used for standard to determine chemical shift of compounds: δTMS=0ppm. In other words, frequencies for chemicals are measured for a 1H or 13C nucleus of a sample from the 1H or 13C resonance of TMS.
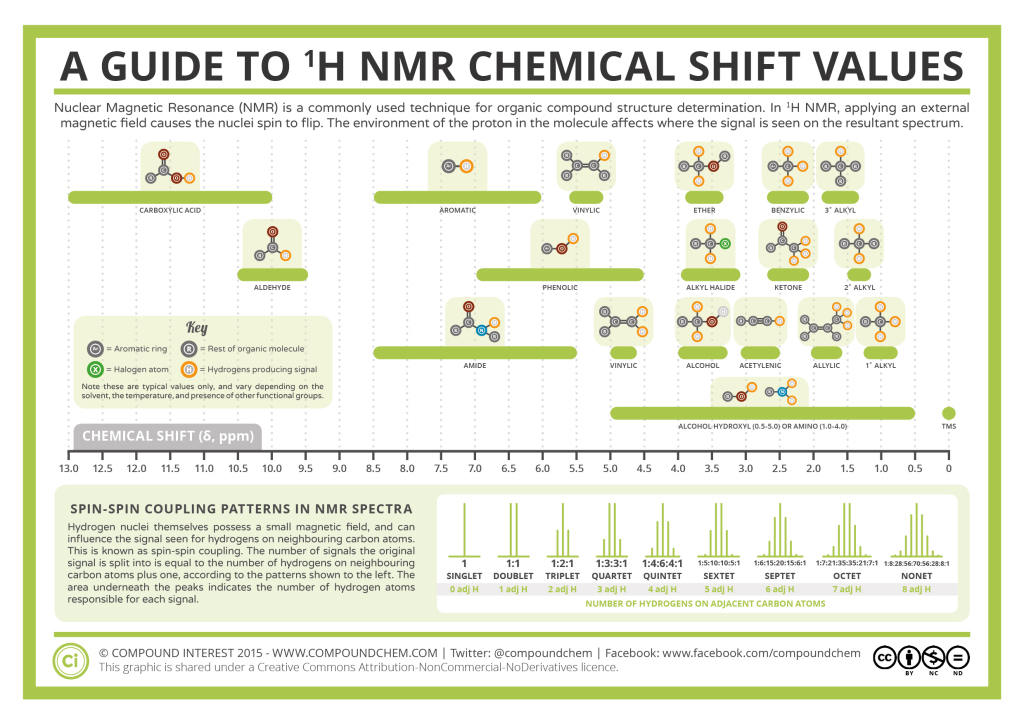
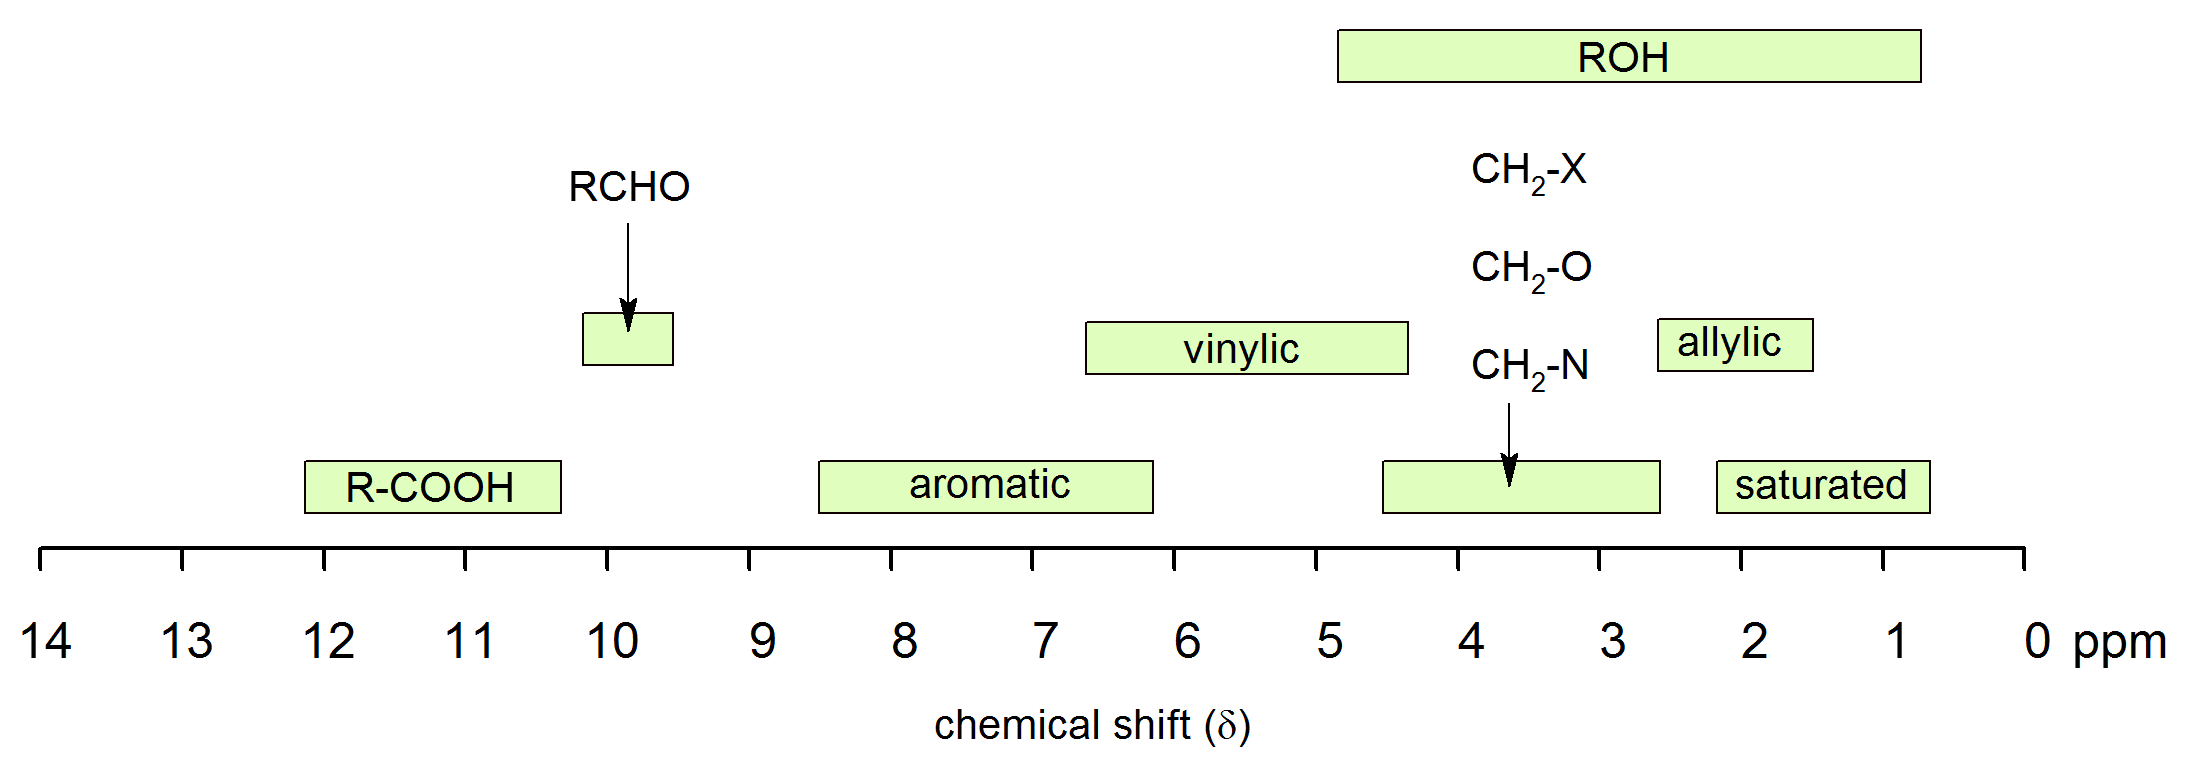
Table 29.9a. lists the chemical shift values are in parts per million (ppm) relative to TMS. The listed values may vary slightly from Figure 29.9j. and Infographic 29.9a. Note, Hydrogen (H) is underlined in each hydrogen type.
| Hydrogen type[2] | Chemical shift (ppm) |
|---|---|
|
RCH3 |
0.9 – 1.0 |
|
RCH2R |
1.2 – 1.7 |
|
R3CH |
1.5 – 2.0 |
|
|
1.5 – 1.8 |
|
RNH2 |
1 – 3 |
|
ArCH3 |
2.2 – 2.4 |
|
|
2.3 – 3.0 |
|
ROCH3 |
3.7 – 3.9 |
|
|
3.7 – 3.9 |
|
ROH |
1 – 5 |
|
|
3.7 – 6.5 |
|
|
5 – 9 |
|
ArH |
6.0 – 8.7 |
|
|
9.5 – 10.0 |
|
|
10 – 13 |


Source: “12.5: Functional Groups and Chemical Shifts in 1H NMR Spectroscopy” In Map: Organic Chemistry (Wade), CC BY-NC-SA 4.0.
Watch How to Identify Molecules – Proton NMR: Crash Course Organic Chemistry #26 on YouTube (11 mins)
Video source: Crash Course. (2021, April 21). How to identify molecules – Proton NMR: Crash Course Organic Chemistry #26 [Video]. YouTube.
Example 29.9b
How do different functional groups (of comparable compounds) show in NMR spectra? Use Figure 29.9k to help.
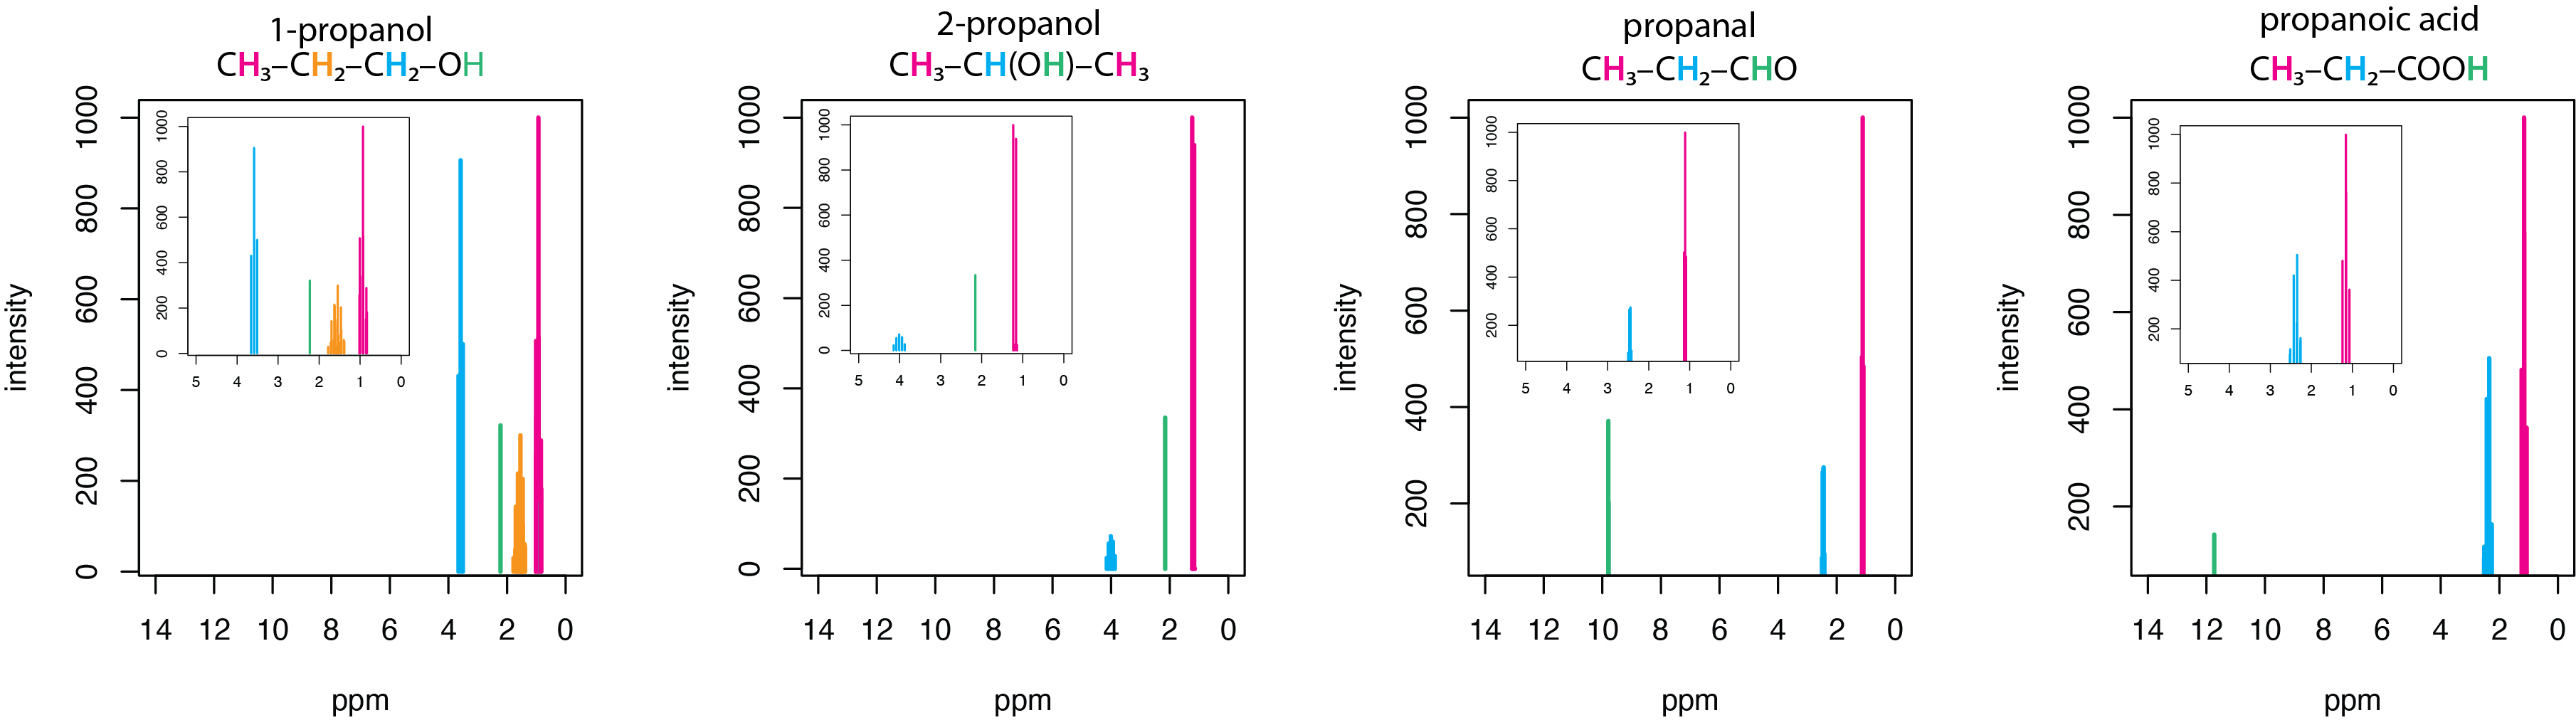
Solution
The spectra in Figure 29.9k. are for a set of four simple organic molecules, each of which has a chain of three carbons and an oxygen: 1-propanol, CH3CH2CH2OH, 2-propanol, CH3CH(OH)CH3, propanal, CH3CH2CHO, and propanoic acid, CH3CH2COOH. The first two of these molecules are alcohols, the third is an aldehyde, and the last is a carboxylic acid. The main spectrum runs from 0–14 ppm, with insets showing the spectra over a narrower range of 0–5 ppm.
Each of these molecules has a terminal –CH3 group that is the most upfield peak in its spectrum, appearing between 0.94 – 1.20 ppm. Each of these molecules has a hydrogen that either is bonded to an oxygen or a hydrogen bonded to the same carbon as the oxygen. The hydrogens in the –OH groups of the two alcohols have similar shifts of 2.16 ppm and 2.26 ppm, but the aldehyde hydrogen in the –CHO group and the acid hydrogen in –COOH are shifted further downfield appearing at 9.793 ppm and 11.73 ppm, respectively. The hydrogens in the two –CH2– groups of 1-propanol have very different shifts, with the one adjacent to the –OH group appearing more downfield at 3.582 ppm than the one next to the –CH3 group at 1.57 ppm. Not surprisingly, the –CH– hydrogen in 2-proponal, which is adjacent to the –OH group appears at 4.008 ppm.
Example source: Instrumental Analysis (LibreTexts), CC BY-NC-SA 4.0
Exercise 29.9b
What would the 1H NMR spectrum of this compound look like?
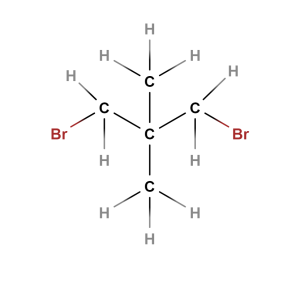
Check Your Answers: [3]
Source: Exercise created by Samantha Sullivan Sauer, CC BY-NC 4.0
Signal Integration
The concept of peak integration is that the area of a given peak in a 1H NMR spectrum is proportional to the number of (equivalent) protons giving rise to the peak. Thus, a peak which is caused by a single, unique proton has an area which measures one third of the area of a peak resulting from a methyl (CH3) group in the same spectrum.
In practice, we do not have to measure these areas ourselves: it is all done electronically by the spectrometer, and an integration curve is superimposed on the rest of the spectrum. The integration curve appears as a series of steps, with the height of each step being proportional to the area of the corresponding absorption peak, and consequently, to the number of protons (hydrogens) responsible for the absorption. The two signals in the methyl acetate spectrum, for example, integrate to approximately the same area, because they both correspond to a set of three equivalent protons.
Example 29.9c
Figure 29.9m. is the spectrum of para-xylene (IUPAC name 1,4-dimethylbenzene). Explain the equivalent protons and the integration results.
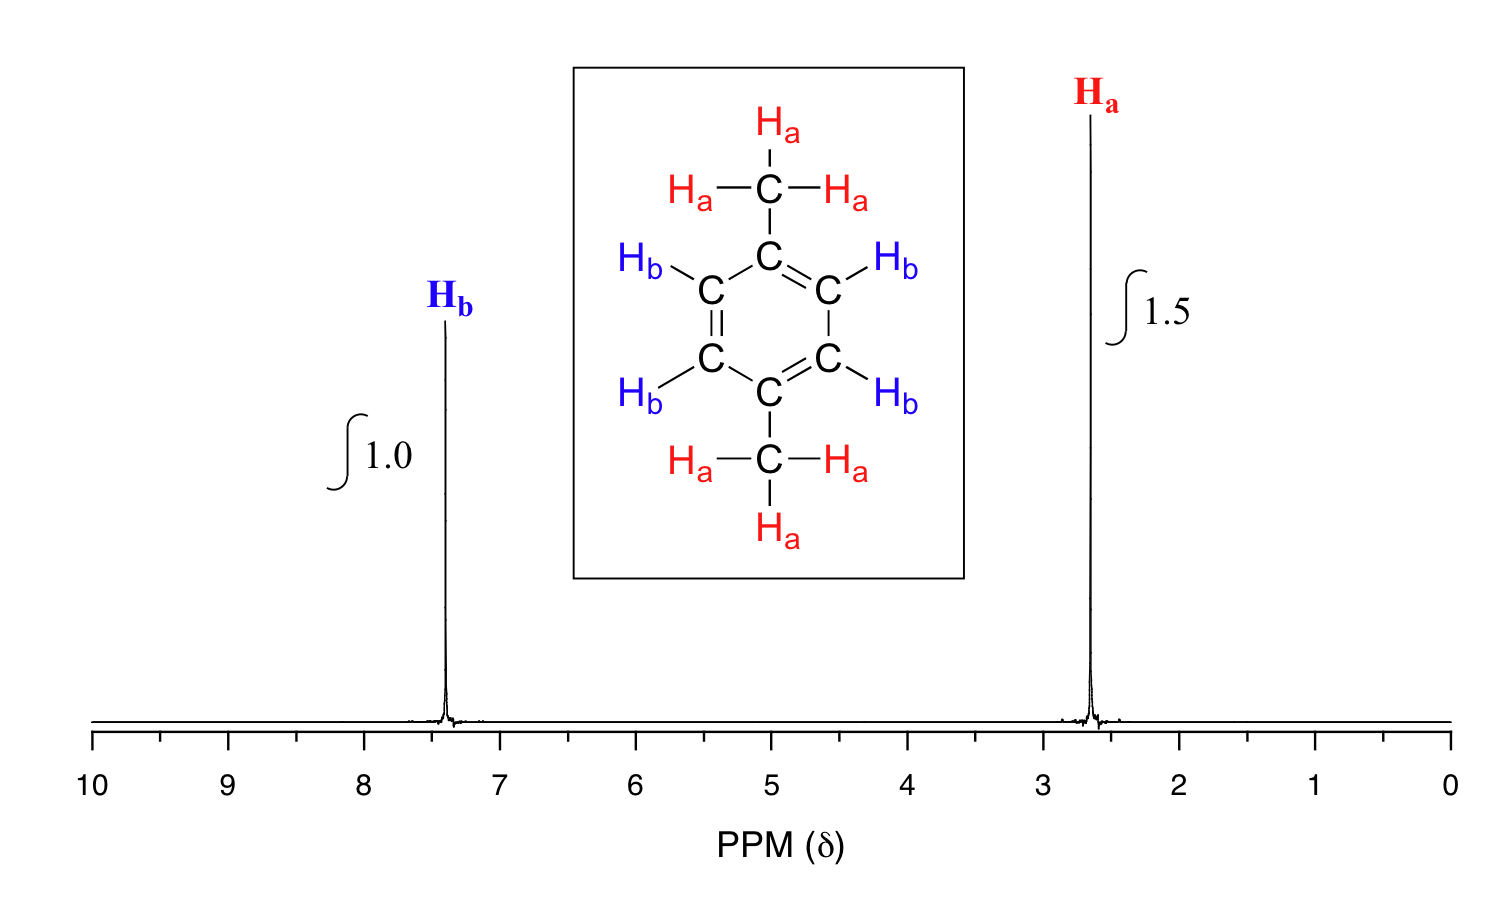
Solution
This molecule has two sets of protons: the six methyl (Ha) protons and the four aromatic (Hb) protons. When the instrument integrates the areas under the two signals, we find that the area under the peak at 2.6 ppm is 1.5 times greater than the area under the peak at 7.4 ppm. This along with the actual chemical shift values tells us which set of protons corresponds to which NMR signal. The peak at 2.6 ppm represents the 6 methyl protons because they are attached to the aromatic ring (Ar-CH3) and the peak at 7.4 ppm represents the four aromatic protons because they are directly attached to the aromatic ring (Ar-H).
Source: Example is adapted from Organic Chem: Biological Emphasis Vol I (page 246), CC BY-NC-SA 4.0.
The integration function can also be used to determine the relative amounts of two or more compounds in a mixed sample. If a sample is a 50:50 (mole/mole) mixture of benzene and acetone, for example, the acetone signal should integrate to the same value as the benzene sample, because both signals represent six equivalent protons. If a sample is a 50:50 mixture of acetone and cyclopentane, on the other hand, the ratio of the acetone peak area to the cyclopentane peak area will be 3:5 (or 6:10), because the cyclopentane signal represents ten protons.
Exercise 29.9c
A 1H-NMR spectrum of a mixed 50:50 (mole: mole) sample of acetone (propanone) (CH3(CO)CH3) and dichloromethane (CH2Cl2). What is the ratio of the acetone peak area to the dichloromethane peak area?
Check Your Answer: [4]
Source: Exercise is adapted from Map: Organic Chemistry (Wade), CC BY-NC-SA 4.0.
Exercise 29.9d
The 1H-NMR spectrum of a mixed sample of 50% para-xylene and 50% acetone in CDCl3 solvent (structures are shown in Figure 29.9f. and 29.9g.). How many peaks do you expect to see? What is the expected ratio of integration values for these peaks?
Check Your Answer: [5]
Source: Exercise is adapted from Map: Organic Chemistry (Wade), CC BY-NC-SA 4.0.
Spin-Spin Coupling
The 1H-NMR spectra seen in Figures 29.9b. and 29.9m. (of methyl acetate and para-xylene) are somewhat unusual in the sense that in both of these molecules, each set of protons generates a single NMR signal. In fact, the 1H-NMR spectra of most organic molecules contain proton signals that are ‘split’ into two or more sub-peaks. Rather than being a complication, however, this splitting behavior actually provides a lot of information about the sample molecule.
Consider the spectrum for 1,1,2-trichloroethane in Figure 29.9n. In this and in many spectra to follow, we show enlargements of individual signals so that the signal splitting patterns are recognizable.
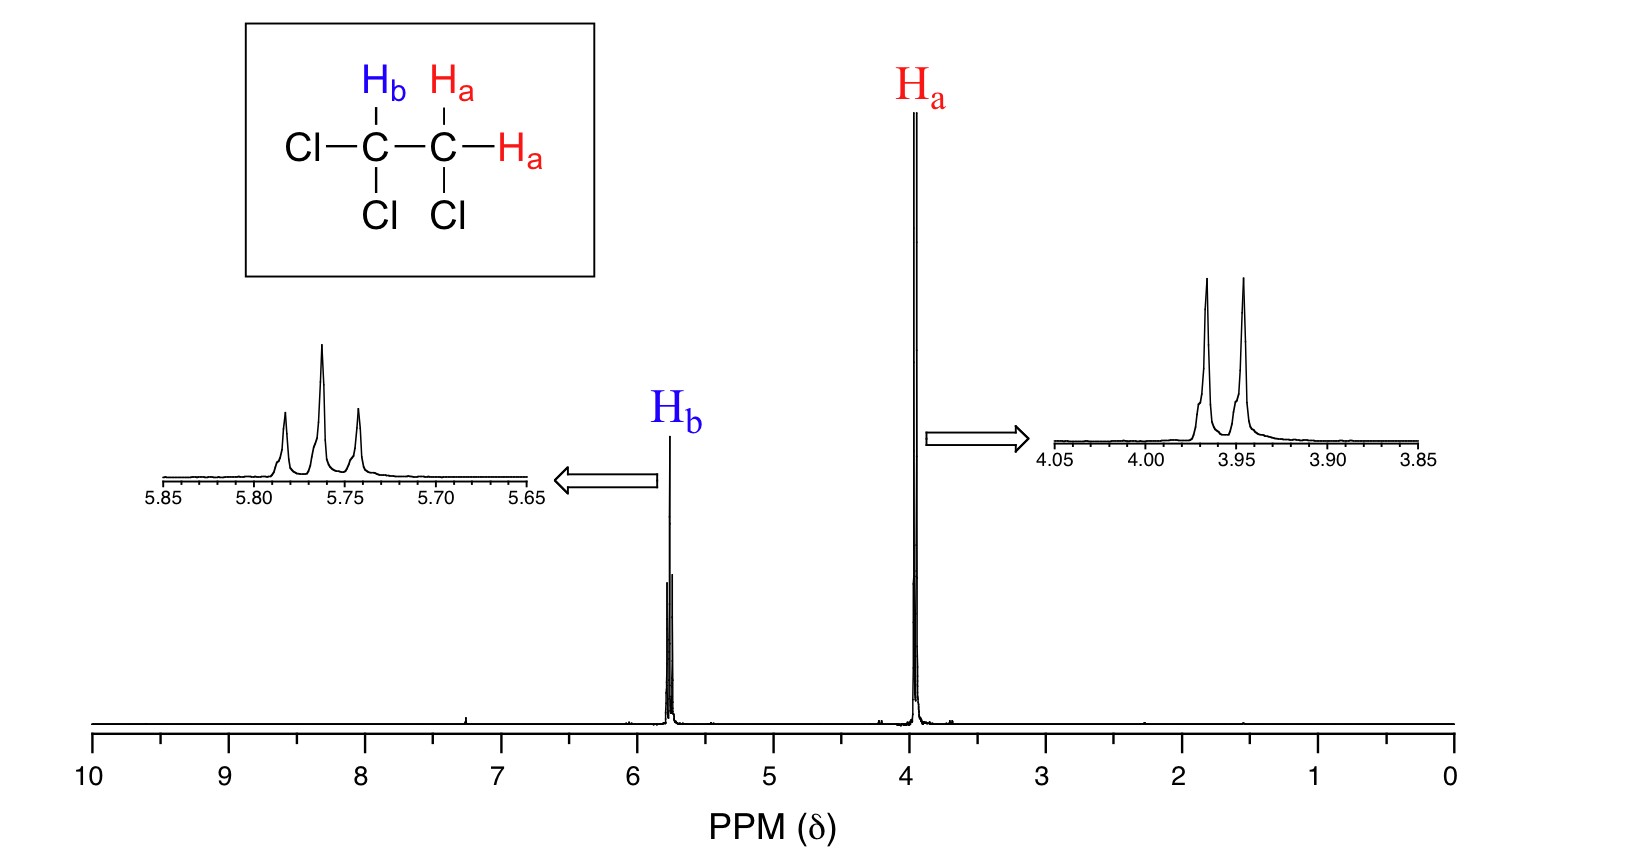
From what we have learned about 1H NMR spectra so far, we might predict that the spectrum of 1,1,2-trichloroethane, CHCl2CH2Cl, would consist of two peaks—one, at about 2.5-4.0 δ, expected for CH2-halogen compounds and one shifted downfield because of the presence of an additional electronegative chlorine atom on the second carbon. The signal at 3.96 ppm, corresponding to the two Ha protons, is split into two subpeaks of equal height (and area) – this is referred to as a doublet. The Hb signal at 5.76 ppm, on the other hand, is split into three sub-peaks, with the middle peak double the area of each of the two outside peaks. This is called a triplet. The split peaks (multiplets) arise because the magnetic field experienced by the protons of one group is influenced by the spin arrangements of the protons in an adjacent group. Spin-spin coupling is often referred to as spin-spin splitting and is based on the n + 1 rule and the associated coupling patterns.
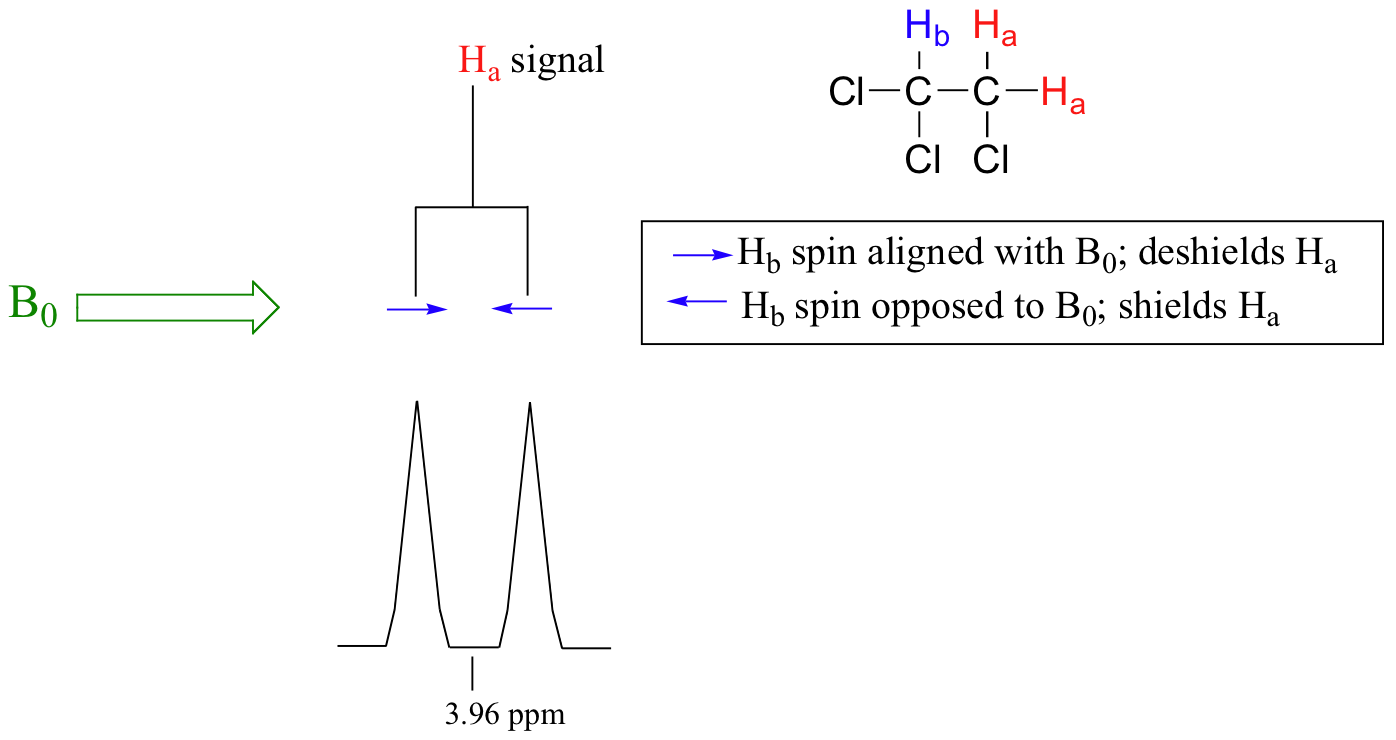
The source of signal splitting is a phenomenon called spin-spin coupling, a term that describes the magnetic interactions between neighbouring, non-equivalent NMR-active nuclei. In 1,1,2-trichloromethane, the Ha and Hb protons are spin-coupled to each other. Looking first at the Ha signal: in addition to being shielded by nearby valence electrons, each of the Ha protons is also influenced by the small magnetic field generated by Hb next door (remember, each spinning proton is like a tiny magnet). The interaction ‘felt’ by Ha is a slightly weaker if Hb is aligned against B0, or slightly stronger if Hb is aligned with B0. In other words, in half of the molecules, Ha is shielded by Hb (thus the NMR signal is shifted slightly upfield) and in the other half Ha is deshielded by Hb(and the NMR signal shifted slightly downfield). What would otherwise be a single Ha peak has been split into two sub-peaks (a doublet), one upfield and one downfield of the original signal. These ideas can be illustrated by a splitting diagram, as shown in Figure 29.9o.
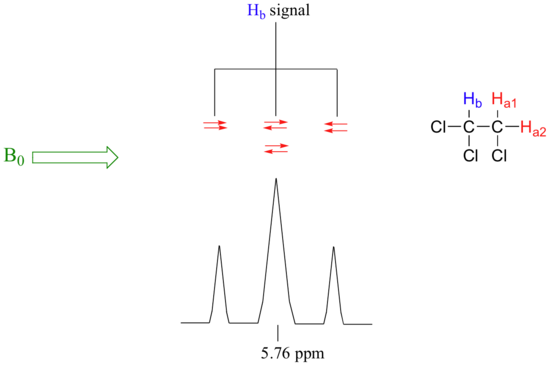
A similar explanation now applies to the Hb signal. The magnetic environment experienced by Hb is influenced by the fields of both neighbouring Ha protons, called Ha1 and Ha2. There are four possibilities here, each of which is equally probable. First, the magnetic fields of both Ha1 and Ha2 could be aligned with B0, which would deshield Hb, shifting its NMR signal slightly downfield. Second, both the Ha1 and Ha2 magnetic fields could be aligned opposed to B0, which would shield Hb, shifting its resonance signal slightly upfield. Third and fourth, Ha1 could be with B0 and Ha2 opposed, or Ha1 opposed to B0 and Ha2 with B0. In each of the last two cases, the shielding effect of one Ha proton would cancel the deshielding effect of the other, and the chemical shift of Hb would be unchanged. In the end, the signal for Hb is a triplet (Figure 29.9p), with the middle peak twice as large as the two outer peaks because there are two ways that Ha1 and Ha2 can cancel each other out.
Example 29.9d
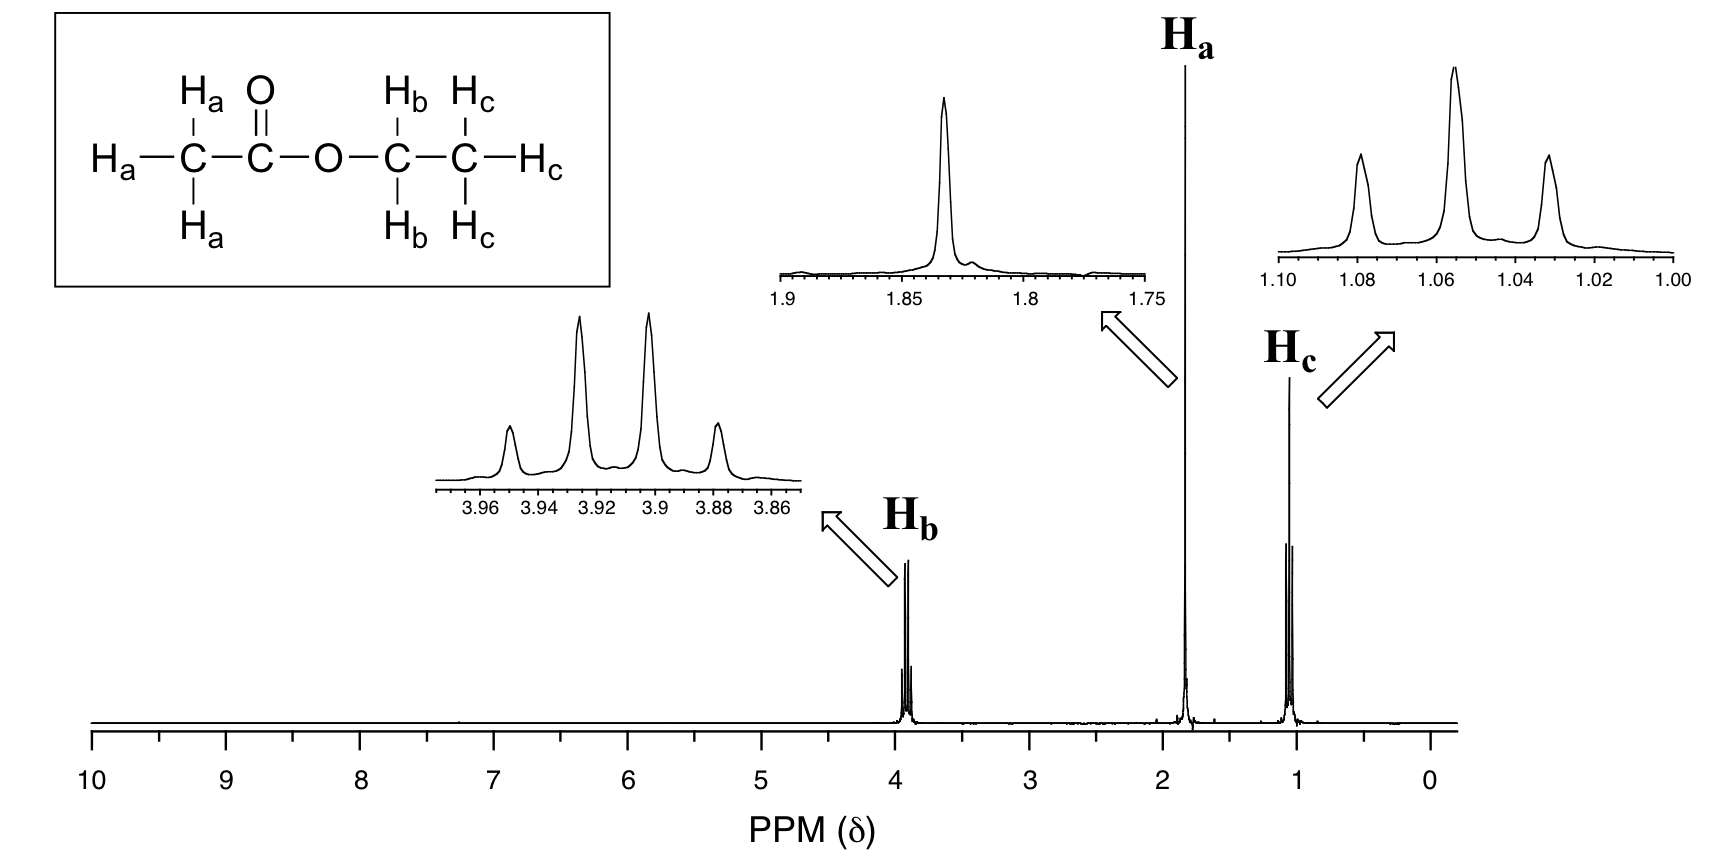
Explain the spin-spin coupling in the NMR spectrum (Figure 29.9q.) for ethyl ethanoate.
Solution
We see an unsplit ‘singlet’ peak at 1.833 ppm that corresponds to the ethanoate (Ha) hydrogens – this is similar to the signal for the ethanoate hydrogens in methyl ethanoate (Figure 29.9b). This signal is unsplit because there are no adjacent hydrogens on the molecule. The signal at 1.055 ppm for the Hc hydrogens is split into a triplet by the two Hb hydrogens next door. The explanation here is the same as the explanation for the triplet peak seen in Figure 29.9m. The Hb hydrogens give rise to a quartet signal at 3.915 ppm – notice that the two middle peaks are taller than the two outside peaks. This splitting pattern results from the spin-coupling effect of the three Hc hydrogens next door and can be explained by an analysis similar to that used to explain the doublet and triplet patterns.
Source: Example is adapted from Map: Organic Chemistry (Wade), CC BY-NC-SA 4.0.
The spin-spin coupling pattern is usually referred to as the n + 1 rule: if a set of hydrogens has n neighbouring, non-equivalent hydrogens, it will be split into n + 1 subpeaks. Thus, the two Hb hydrogens in ethyl ethanoate split the Hc signal into a triplet, and the three Hc hydrogens split the Hb signal into a quartet. This is very useful information if trying to determine the structure of an unknown molecule: a triplet signal means that the corresponding hydrogen or set of hydrogens has two neighbours.
Keep in mind that:
- Signal splitting only occurs between non-equivalent hydrogens – in other words, Ha1 in 1,1,2-trichloroethane is not split by Ha2, and vice-versa.
- Splitting occurs primarily between hydrogens that are separated by three bonds. This is why the Ha hydrogens in ethyl ethanoate form a singlet – the nearest hydrogen neighbours are five bonds away, too far for coupling to occur.
- Splitting is most noticeable with hydrogens bonded to carbon. Hydrogens that are bonded to heteroatoms (alcohol or amino hydrogens, for example) are coupled weakly – or not at all – to their neighbours.
Figures 29.9r. and 29.9s. are a few more examples of chemical shift and splitting pattern information for some relatively simple organic molecules.


Exercise 29.9e
How many proton signals would be expected in the 1H-NMR spectrum of triclosan (a common antimicrobial agent found in detergents)? For each of the proton signals, predict the splitting pattern.

Check Your Answers:[6]
Source: Exercise is adapted from Organic Chem: Biological Emphasis Vol I (page 258), CC BY-NC-SA 4.0.
Links to Enhanced Learning
The Chemical Detectives app on Chemical Detectives – Apps on Google Play [New tab] and Chemical Detectives on the App Store [New tab] allows users to browse various types of spectra (IR, MS, 1H NMR, 13C NMR, and elemental microanalysis) for simple organic compounds and also complete quizzes about various compounds based on their spectra. Customize of types of functional groups is possible (e.g. only hydrocarbons or only alcohols).
Other options:
- Predict 1H proton NMR spectra [New tab]
- Searchable database of spectra AIST:Spectral Database for Organic Compounds,SDBS [New tab]
Attribution & References
Except where otherwise noted, this section has been adapted by Samantha Sullivan Sauer from:
-
- “19.4: Applications of Proton NMR” by David Harvey In Instrumental Analysis (LibreTexts) , CC BY-NC-SA 4.0
- “12.7: Spin-Spin Splitting in ¹H NMR Spectra” In Map: Organic Chemistry (Wade), Complete and Semesters I and II, CC BY-NC-SA 4.0. Contributors from original source:
- Dr. Dietmar Kennepohl FCIC (Professor of Chemistry, Athabasca University)
- Prof. Steven Farmer (Sonoma State University)
- Organic Chemistry With a Biological Emphasis by Tim Soderberg (University of Minnesota, Morris)
- Chris P Schaller, Ph.D., (College of Saint Benedict / Saint John’s University)
- “12.2: NMR Spectra – an introduction and overview“, “12.4: ¹H NMR Spectroscopy and Proton Equivalence“, “12.5: Functional Groups and Chemical Shifts in ¹H NMR Spectroscopy“, “12.6: Integration of ¹H NMR Absorptions- Proton Counting” In Map: Organic Chemistry (Wade), Complete and Semesters I and II by LibreTexts, licensed under CC BY-NC-SA 4.0. Contributors from original source:
- Dr. Dietmar Kennepohl FCIC (Professor of Chemistry, Athabasca University)
- Prof. Steven Farmer (Sonoma State University)
- Organic Chemistry With a Biological Emphasis by Tim Soderberg (University of Minnesota, Morris)
-
A. 3; B. 3; C. 5; D. 7
↵
- R stands for any alkyl chain; Ar stands for any aryl group (benzene based). ↵
-
The spectrum will have two signals. One represents the two CH3 groups totaling 6 Hs. This will be about 0.9-1.0 ppm. The other represents the two CH2 groups next to the Br atoms totaling 4 Hs. This will be about 3.4-3.6
↵
-
Acetone has 6 equivalent protons. Dichloromethane has 2 equivalent protons. This is a 6:2 or 3:1 ratio.
↵
-
para-xylene has two peaks with a 6:4 ratio. Acetone has one peak representing 6 protons. The ratio between all peaks in this 50:50 mixture is 6:4:6 or 3:2:3.
↵
-
There will be four signals in the spectrum. Each peak represents two hydrogens given the symmetry of the molecule. The H on the OH and the H on the ring between OH and Cl will be single peaks. The other two Hs will be doublets due to the neighbouring Hs.
↵
