29.7 Mass Spectrometry (MS)
Learning Objectives
By the end of this section, you will be able to:
- Identify the essential features of a mass spectrometer.
- Identify peaks in a simple mass spectrum, and explain how they arise.
- Determine the molecular weight of a compound given it’s MS spectrum.
Mass spectrometry is an analytic method that employs ionization and mass analysis of compounds in order to determine the mass, formula and structure of the compound being analyzed. A mass analyzer is the component of the mass spectrometer that takes ionized masses and separates them based on charge to mass ratios and outputs them to the detector where they are detected and later converted to a digital output.
Mass spectrometers are large and expensive, and usually operated only by fully trained personnel. Research chemists often rely quite heavily on mass spectra to assist them in the identification of compounds. Note that in most attempts to identify an unknown compound, chemists do not rely exclusively on the results obtained from a single spectroscopic technique. A combination of chemical and physical properties and spectral evidence is usually employed.
The Mass Spectrometer
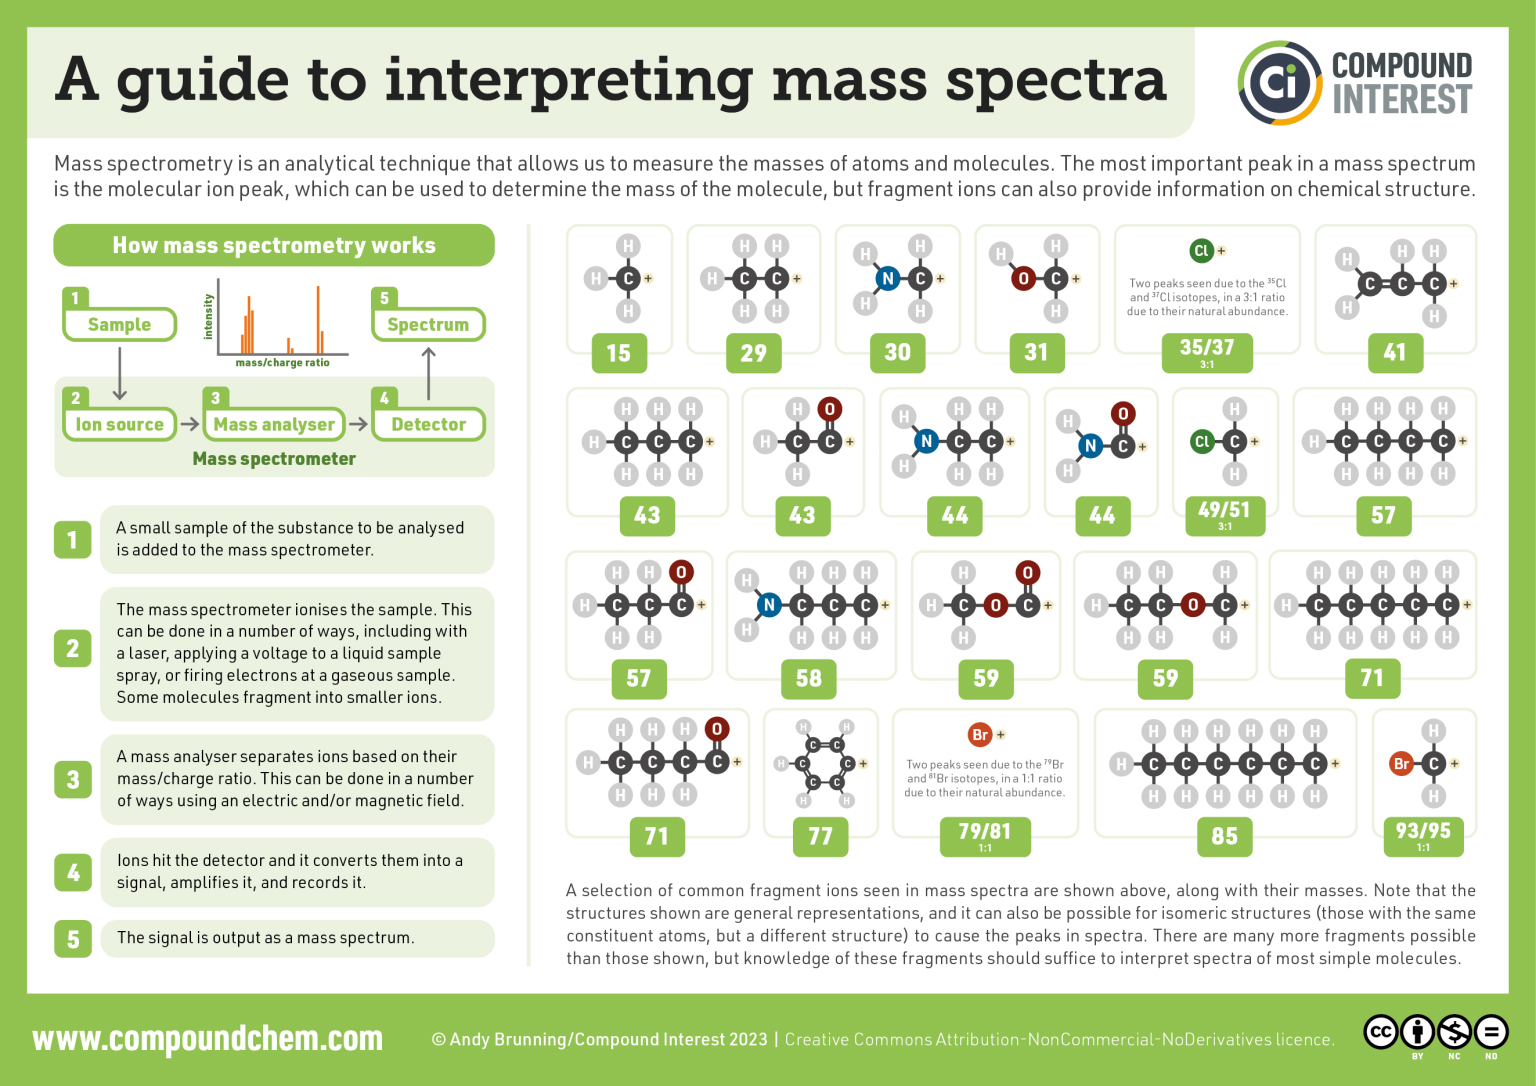
In order to measure the characteristics of individual molecules, a mass spectrometer converts them to ions so that they can be moved about and manipulated by external electric and magnetic fields. The essential functions of a mass spectrometer (Figure 29.7a.) are:
- Ionization: The atom is ionized by knocking one or more electrons off to give a positive ion. This is true even for things which you would normally expect to form negative ions (chlorine, for example) or never form ions at all (argon, for example). Mass spectrometers always work with positive ions.
- Acceleration: The ions are accelerated so that they all have the same kinetic energy.
- Deflection: The ions are then deflected by a magnetic field according to their masses. The lighter they are, the more they are deflected. The amount of deflection also depends on the number of positive charges on the ion – in other words, on how many electrons were knocked off in the first stage. The more the ion is charged, the more it gets deflected.
- Detection: The beam of ions passing through the machine is detected electrically.
Because ions are very reactive and short-lived, their formation and manipulation must be conducted in a vacuum. The heart of the spectrometer is the ion source. Here molecules of the sample (black dots) are bombarded by electrons (light blue lines) issuing from a heated filament. This is called an EI (electron-impact) source. Gases and volatile liquid samples are allowed to leak into the ion source from a reservoir. Non-volatile solids and liquids may be introduced directly. Cations formed by the electron bombardment (red dots) are pushed away by a charged repeller plate (anions are attracted to it), and accelerated toward other electrodes, having slits through which the ions pass as a beam. Some of these ions fragment into smaller cations and neutral fragments. A perpendicular magnetic field deflects the ion beam in an arc whose radius is inversely proportional to the mass of each ion. Lighter ions are deflected more than heavier ions. By varying the strength of the magnetic field, ions of different mass can be focused progressively on a detector fixed at the end of a curved tube (also under a high vacuum).
Formation of Ions and Fragments
When a high energy electron collides with a molecule it often ionizes it by knocking away one of the molecular electrons (either bonding or non-bonding). This leaves behind a molecular ion (coloured red in Figure 29.7b.). Residual energy from the collision may cause the molecular ion to fragment into neutral pieces (coloured green) and smaller fragment ions (coloured pink and orange). The molecular ion is a radical cation, but the fragment ions may either be radical cations (pink) or carbocations (orange), depending on the nature of the neutral fragment.
The MS Spectrum
Figure 29.7c. is typical output for an electron-ionization MS experiment of acetone (MS data is derived from the Spectral Database for Organic Compounds, a free, web-based service provided by AIST in Japan).

On the horizontal axis is the value for m/z. On the vertical axis is the relative abundance of each ion detected. On this scale, the most abundant ion, called the base peak, is set to 100%, and all other peaks are recorded relative to this value.
For acetone, the base peak corresponds to a fragment with m/z = 43. The molecular weight of acetone is 58, so we can identify the peak at m/z = 58 as that corresponding to the molecular ion peak, or parent peak.
Notice that there is a small peak at m/z = 59: this is referred to as the M+1 peak. How can there be an ion that has a greater mass than the molecular ion? Simple: a small fraction – about 1.1% – of all carbon atoms in nature are actually the 13C rather than the 12C isotope. The 13C isotope is, of course, heavier than 12C by 1 mass unit. In addition, about 0.015% of all hydrogen atoms are actually deuterium, the 2H isotope. So the M+1 peak represents those few acetone molecules in the sample which contained either a 13C or 2H.
Infographic 29.7a. shows some common anticipated fragmentation ions for interpreting mass spectra.
Example 29.7a
Suggest a way of distinguishing between pentan-2-one and pentan-3-one using their mass spectra.
- pentan-2-one – CH3COCH2CH2CH3
- pentan-3-one – CH3CH2COCH2CH3
Solution
Each of these is likely to split to produce ions with a positive charge on the CO group. In the pentan-2-one case, there are two different ions like this:
- [CH3CO]+
- [COCH2CH2CH3]+
That would give you strong lines at m/z = 43 and 71. With pentan-3-one, you would only get one ion of this kind:
- [CH3CH2CO]+
In that case, you would get a strong line at 57. You don’t need to worry about the other lines in the spectra – the 43, 57 and 71 lines give you plenty of difference between the two. The 43 and 71 lines are missing from the pentan-3-one spectrum, and the 57 line is missing from the pentan-2-one one.
The two mass spectra look like this:
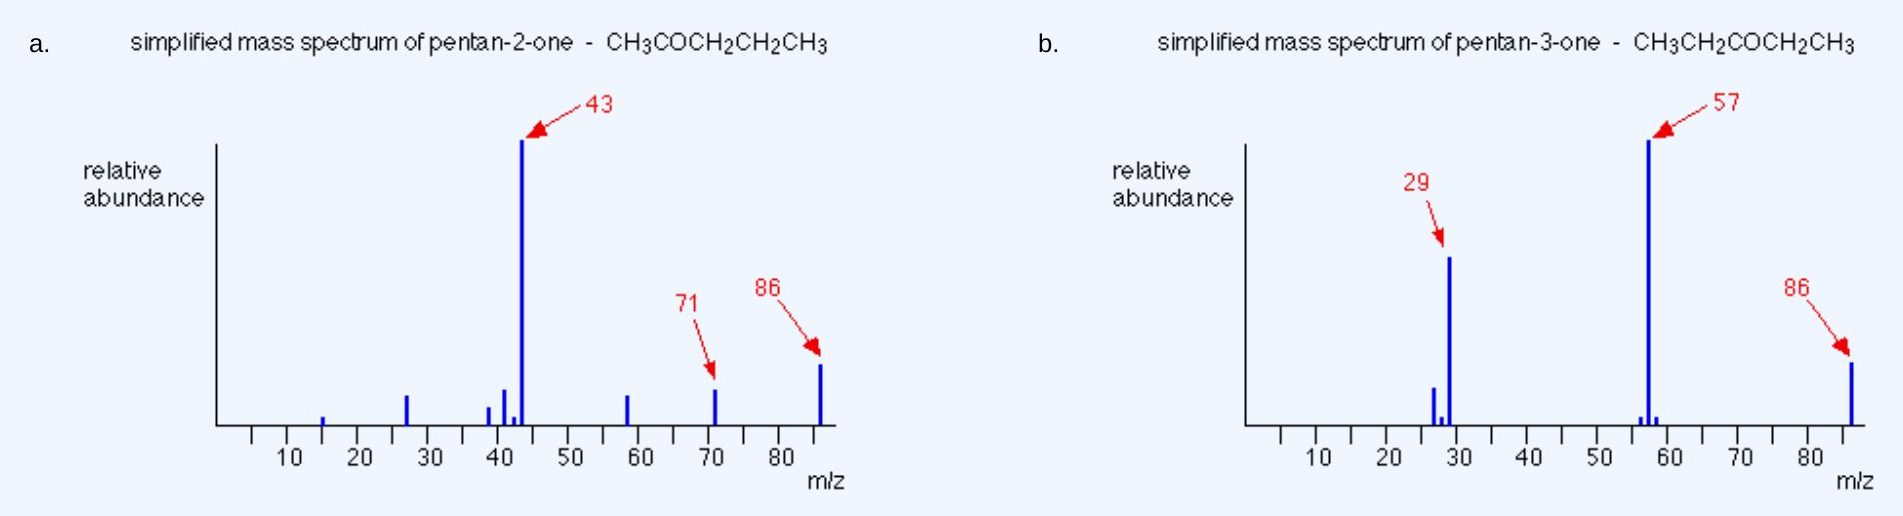
As you’ve seen, the mass spectrum of even very similar organic compounds will be quite different because of the different fragmentation patterns that can occur.
Source: Example 29.7a is adapted from Map: Organic Chemistry (Wade), CC BY-NC-SA 4.0.
Exercise 29.7a
Caffeine has a mass of 194.19 amu, determined by mass spectrometry, and contains C, N, H, O. What is a molecular formula for this molecule?
Check Your Answer: [1]
Source: Map: Organic Chemistry (Wade), CC BY-NC-SA 4.0.
Exercise 29.7b
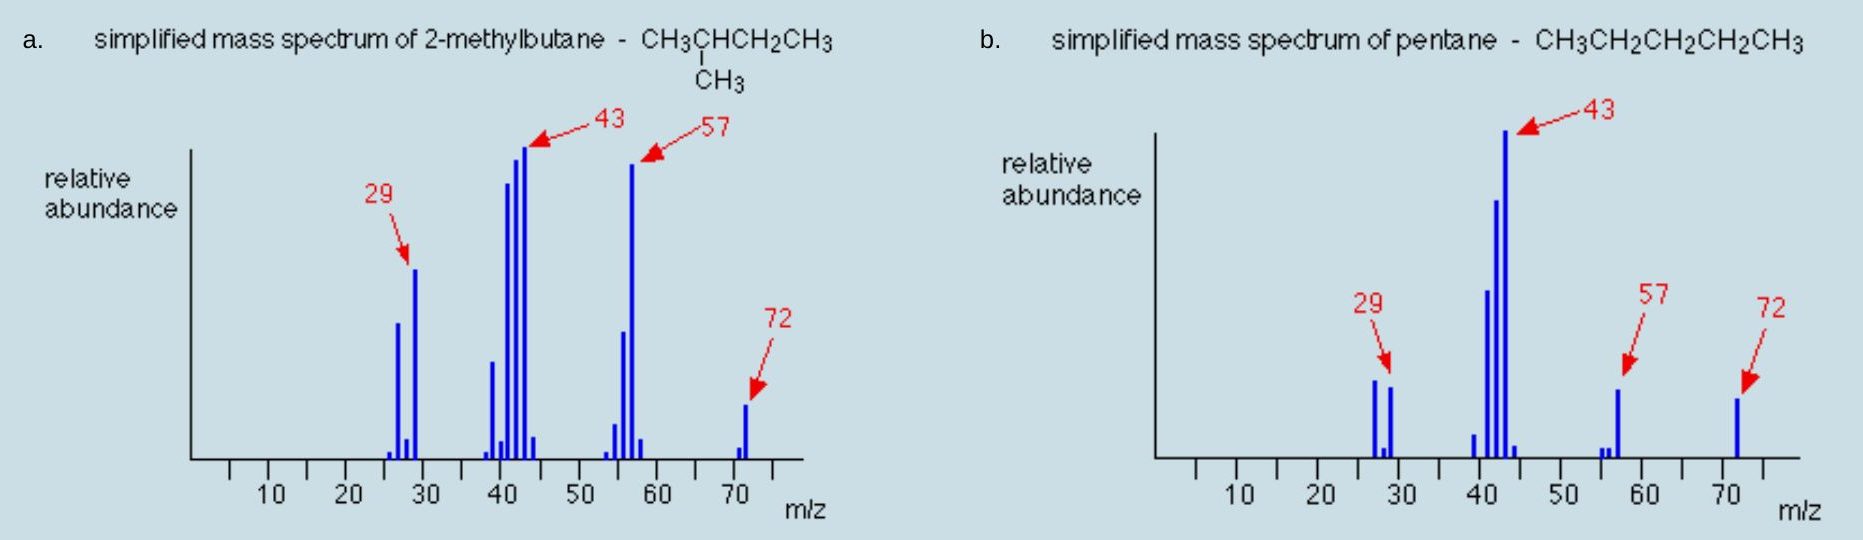
For each spectrum, justify the molecular weight of the compound and one major peak.
Check Your Answers: [2]
Source: Exercise 29.7b written by Samantha Sullivan Sauer with images from Map: Organic Chemistry (Wade), CC BY-NC-SA 4.0, based data for Compounds 10633 and 2475 by National Institute of Advanced Industrial Science and Technology via SDBSWeb, Dec. 2, 2016
Links to Enhanced Learning
The Chemical Detectives app on Chemical Detectives on Google Play [New tab] and Chemical Detectives on the App Store [New tab] allows users to browse various types of spectra (IR, MS, 1H NMR, 13C NMR, and elemental microanalysis) for simple organic compounds and also complete quizzes about various compounds based on their spectra. Customize of types of functional groups is possible (e.g. only hydrocarbons or only alcohols).
Attribution & References
Except where otherwise noted, this page is adapted by Samantha Sullivan Sauer from
- “Mass Spectrometry” In Instrumentation and Analysis and remixed/authored by LibreTexts , licensed under CC BY-NC-SA 4.0
- “How the Mass Spectrometer Works” by Jim Clark, In Instrumentation and Analysis and remixed/authored by LibreTexts, licensed under CC BY-NC 4.0
- “11.7: Mass Spectrometry – an introduction” In Map: Organic Chemistry (Wade), Complete and Semesters I and II by LibreTexts, licensed under CC BY-NC-SA 4.0. Contributors from original source:
- Prof. Steven Farmer (Sonoma State University)
- William Reusch, Professor Emeritus (Michigan State U.), Virtual Textbook of Organic Chemistry
- “11.8: Fragmentation Patterns in Mass Spectrometry” In Map: Organic Chemistry (Wade), Complete and Semesters I and II by LibreTexts, licensed under CC BY-NC-SA 4.0. Contributors from original source:
- Dr. Dietmar Kennepohl FCIC (Professor of Chemistry, Athabasca University)
- Prof. Steven Farmer (Sonoma State University)
- Organic Chemistry With a Biological Emphasis by Tim Soderberg (University of Minnesota, Morris)
- Jim Clark (Chemguide.co.uk)
-
C8H10N4O2 (C = 12 g/mol × 8 = 96 g/mol; N = 14 g/mol × 4 = 56 g/mol; H = 1 g/mol × 10 = 10 g/mol; O = 16 g/mol x 2 = 32; 96 g/mol + 56 g/mol + 10 g/mol + 32 g/mol = 194 g/mol)
↵
-
a) The molecular weight is 72 g/mol which corresponds to the 72 m/z peak. The three other labelled peaks all correspond to alkane fragments shown in Figure 29.7d. b) The molecular weight is 72 g/mol which corresponds to the 72 m/z peak. The three other labelled peaks all correspond to alkane fragments shown in Figure 29.7d. Notice the similarity with spectrum a) though the abundance of each peak is different due to the structural differences in atom arrangement.
↵
the tallest peak in the MS spectrum and set equivalent to 100%
the peak that corresponds to the molecular weight of the compound
