29.4 Chromatography Technology
Learning Objectives
By the end of this section, you will be able to:
- Explain the purpose and general process of gas chromatography.
- Explain the purpose and general process of high-performance liquid chromatography.
Gas Chromatography (GC)
Gas chromatography is a term used to describe the group of analytical separation techniques used to analyze volatile substances in the gas phase. The mobile phase is a chemically inert gas that serves to carry the molecules of the analyte through the heated column. The stationary phase is either a solid adsorbant, termed gas-solid chromatography (GSC), or a liquid on an inert support, termed gas-liquid chromatography (GLC).
In early 1900s, Gas chromatography (GC) was discovered by Mikhail Semenovich Tsvett as a separation technique to separate compounds. Among the various types of gas chromatography, gas-liquid chromatography is the method most commonly used to separate organic compounds. The combination of gas chromatography and mass spectrometry is an invaluable tool in the identification of molecules. A typical gas chromatograph consists of an injection port, a column, carrier gas flow control equipment, ovens and heaters for maintaining temperatures of the injection port and the column, an integrator chart recorder and a detector (Figure 29.4a.). Often a mass spectrometer is used as the detector.
To separate the compounds in gas-liquid chromatography, a solution sample that contains organic compounds of interest is injected into the sample port where it will be vaporized. The vaporized samples that are injected are then carried by an inert gas, which is often used by helium or nitrogen. This inert gas goes through a glass column packed with silica that is coated with a liquid. One of three things might happen to a particular molecule in the mixture injected into the column:
- It may condense on the stationary phase.
- It may dissolve in the liquid on the surface of the stationary phase.
- It may remain in the gas phase.
None of these things is necessarily permanent. A compound with a boiling point higher than the temperature of the column will obviously tend to condense at the start of the column. However, some of it will evaporate again in the same way that water evaporates on a warm day – even though the temperature is well below 100°C. The chances are that it will then condense again a little further along the column. Similarly, some molecules may dissolve in the liquid stationary phase. Some compounds will be more soluble in the liquid than others. The more soluble ones will spend more of their time absorbed into the stationary phase; the less soluble ones will spend more of their time in the gas. Any molecule in the substance spends some of its time dissolved in the liquid and some of its time carried along with the gas.

The time taken for a particular compound to travel through the column to the detector is known as its retention time. This time is measured from the time at which the sample is injected to the point at which the display shows a maximum peak height for that compound. Different compounds have different retention times. For a particular compound, the retention time will vary depending on:
- the boiling point of the compound. A compound which boils at a temperature higher than the column temperature is going to spend nearly all of its time condensed as a liquid at the beginning of the column. So high boiling point means a long retention time.
- the solubility in the liquid phase. The more soluble a compound is in the liquid phase, the less time it will spend being carried along by the gas. High solubility in the liquid phase means a high retention time.
- the temperature of the column. A higher temperature will tend to excite molecules into the gas phase – either because they evaporate more readily, or because they are so energetic that the attractions of the liquid no longer hold them. A high column temperature shortens retention times for everything in the column.
The output from the GC will be recorded as a series of peaks – each one representing a compound in the mixture passing through the detector. With caution, the retention times can be used to help to identify the compounds present. The peaks can also be used as a way of measuring the relative quantities of the compounds present.
Gas chromatography is a physical separation method in where volatile mixtures are separated (Figure 29.4b.). It can be used in many different fields such as pharmaceuticals, cosmetics and even environmental toxins. Since the samples have to be volatile, human breathe, blood, saliva and other secretions containing large amounts of organic volatiles can be easily analyzed using GC. Knowing the amount of which compound is in a given sample gives a huge advantage in studying the effects of human health and of the environment as well.
Air samples can be analyzed using GC. Most of the time, air quality control units use GC coupled with FID (flame ionization detector) in order to determine the components of a given air sample. Although other detectors are useful as well, FID is the most appropriate because of its sensitivity and resolution and also because it can detect very small molecules as well. The main disadvantage is that it destroys everything coming out of the column as it detects it. If the product is to be sent to a mass spectrometer, for example, for further analysis, a flame ionization detector cannot be used.
GC/MS (gas chromatography coupled with mass spectrometry) is also another useful method which can determine the components of a given mixture. When the detector is showing a peak, some of what is passing through the detector at that time can be diverted to a mass spectrometer. There it will give a fragmentation pattern which can be compared against a computer database of known patterns. That means that the identity of a huge range of compounds can be found without having to know their retention times. This method be applied to many pharmaceutical applications such as identifying the amount of chemicals in drugs. Moreover, cosmetic manufacturers also use this method to effectively measure how much of each chemical is used for their products.

High Performance Liquid Chromatography (HPLC)
High Performance Liquid Chromatography (HPLC) is an analytical technique used for the separation of compounds soluble in a particular solvent. Liquid chromatography was initially discovered as an analytical technique in the early twentieth century and was first used as a method of separating coloured compounds. This is where the name chromatography chroma means colour, graphy means writing, was derived.
A Russian botanist named Mikhail S. Tswett used a rudimentary form of chromatographic separation to purify mixtures of plant pigments into the pure constituents. He separated the pigments based on their interaction with a stationary phase, which is essential to any chromatographic separation. The stationary phase he used was powdered chalk and aluminia, the mobile phase in his separation was the solvent. After the solid stationary phase was packed into a glass column (essentially a long, hollow, glass tube), he poured the mixture of plant pigments and solvent in the top of the column. He then poured additional solvent into the column until the samples were eluted at the bottom of the column. The result of this process was that the plant pigments separated into bands of pure components as they passed through the stationary phase. Modern high performance liquid chromatography or HPLC has its roots in this separation, the first form of liquid chromatography. The chromatographic process has been significantly improved over the last hundred years, yielding greater separation efficiency, versatility and speed.
While all of these basic principles hold true for all chromatographic separations, HPLC was developed as method to solve some of the shortcomings of standard liquid chromatography. Classic liquid chromatography (such as using chromatographic column with gravity) has several severe limitations as a separation method. When the solvent is driven by gravity, the separation is very slow. Instead of a solvent being allowed to drip through a column under gravity, in HPLC, it is forced through under high pressures of up to 400 atmospheres. That makes it much faster. Another limiting factor in liquid chromatography was originally the size of the column packing, once columns could be packed with much smaller particles a much greater surface area for interactions between the stationary phase and the molecules flowing past it was created. This allowed a much better separation of the components of the mixture. The other major improvement over column chromatography concerns the detection methods which can be used. These methods are highly automated and extremely sensitive.
Specialized apparatus (Figure 29.4c.) is required for an HPLC separation because of the high pressures and low tolerances under which the separation occurs. If the results are to be reproducible, then the conditions of the separation must also be reproducible. Thus, HPLC equipment must be of high quality; it is therefore expensive.
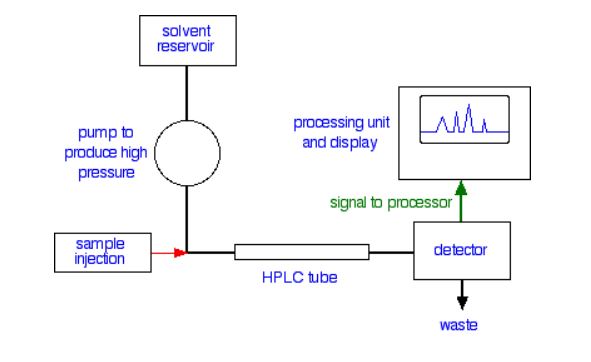
The mobile phase, or solvent, in HPLC is usually a mixture of polar and non-polar liquid components whose respective concentrations are varied depending on the composition of the sample. As the solvent is passed through a very narrow bore column, any contaminants could at worst plug the column, or at the very least add variability to the retention times during repeated different trials. Therefore, HPLC solvent must be kept free of dissolved gases, which could come out of solution mid-separation, and particulates. In the HPLC column, the components of the sample separate based on their differing interactions with the column packing (stationary phase). Columns can be packed with solids such as silica or alumina.
Retention time is the amount of time it will take for a compound to travel the length of the HPLC column. The more time a compound spends adsorbed to the stationary phase, the more time the compound will take to travel the length of the column. Different compounds have different retention times. For a particular compound, the retention time will vary depending on:
- the pressure used (because that affects the flow rate of the solvent)
- the nature of the stationary phase (not only what material it is made of, but also particle size)
- the exact composition of the solvent
- the temperature of the column
That means that conditions have to be carefully controlled if you are using retention times as a way of identifying compounds. Whereas the amount of time required for a sample that does not interact with the stationary phase to travel the length of the column is known as the void time. No compound can be eluted in less than the void time.
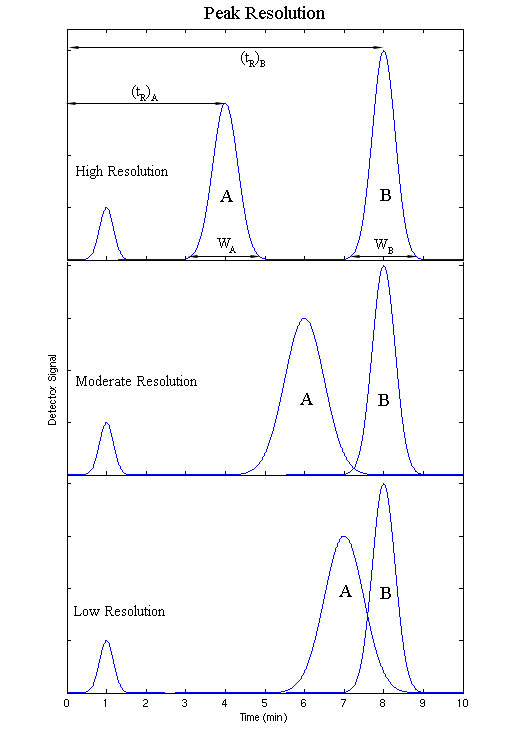
The output will be recorded as a series of peaks – each one representing a compound in the mixture passing through the detector and absorbing UV light. With caution, the retention times may be used to help to identify the compounds present. The peaks can also be used as a way of measuring the quantities of the compounds present. The resolution of an elution is a quantitative measure of how well two elution peaks can be differentiated in a chromatographic separation (Figure 29.4d.).
The HPLC detector, located at the end of the column, must register the presence of various components of the sample, but must not detect the solvent. For that reason, there is no universal detector that works for all separations. A common HPLC detector is a UV absorption detector, as most medium to large molecules absorb UV radiation. When the detector is showing a peak, some of what is passing through the detector at that time can be diverted to a mass spectrometer. There it will give a fragmentation pattern which can be compared against a computer database of known patterns. That means that the identity of a huge range of compounds can be found without having to know their retention times. Detectors that measure fluorescence and refractive index are also used for special applications. A relatively new development is the combination of an HPLC separation with an NMR detector. This allows the pure components of the sample to be identified and quantified by nuclear magnetic resonance after having been separated by HPLC, in one integrated process.
HPLC can be used in both qualitative and quantitative applications, that is for both compound identification and quantification. It can be used to effectively separate similar simple and aromatic hydrocarbons, even those that differ only by a single methylene group. It also effectively separates simple amines, sugars, lipids, and even pharmaceutically active compounds. Finally, HPLC is used to separate molecules of biological origin. The determination of caffeine content in coffee products is routinely done by HPLC in commercial applications in order to guarantee purity and quality of ground coffee. HPLC is a useful addition to an analytical arsenal, especially for the separation of a sample before further analysis.
