29.10 ¹³C NMR Spectroscopy
Learning Objectives
By the end of this section, you will be able to:
- Identify the differences between 1H NMR and 13C NMR and their spectra.
- Identify those carbon atoms which are equivalent (due to symmetry) in a given chemical structure.
- Predict the approximate chemical shifts of each of the carbons in an organic compound, given its structure and a table of chemical shift correlations.
Building on the principles of NMR explained in Section 29.8 and the interpretation of 1H NMR in Section 29.9, this section focuses on the interpretation of 13 C NMR.
Differences between 1H and 13C NMR Spectroscopy
The magnetic moment of a 13C nucleus is much weaker than that of a proton, meaning that NMR signals from 13C nuclei are inherently much weaker than proton signals. This, combined with the low natural abundance of 13C, means that it is much more difficult to observe carbon signals: more sample is required, and often the data from hundreds of scans must be averaged in order to bring the signal-to-noise ratio down to acceptable levels.
Unlike 1H-NMR signals, the area under a 13C-NMR signal cannot be used to determine the number of carbons to which it corresponds. This is because the signals for some types of carbons are inherently weaker than for other types – peaks corresponding to carbonyl carbons, for example, are much smaller than those for methyl or methylene (CH2) peaks.
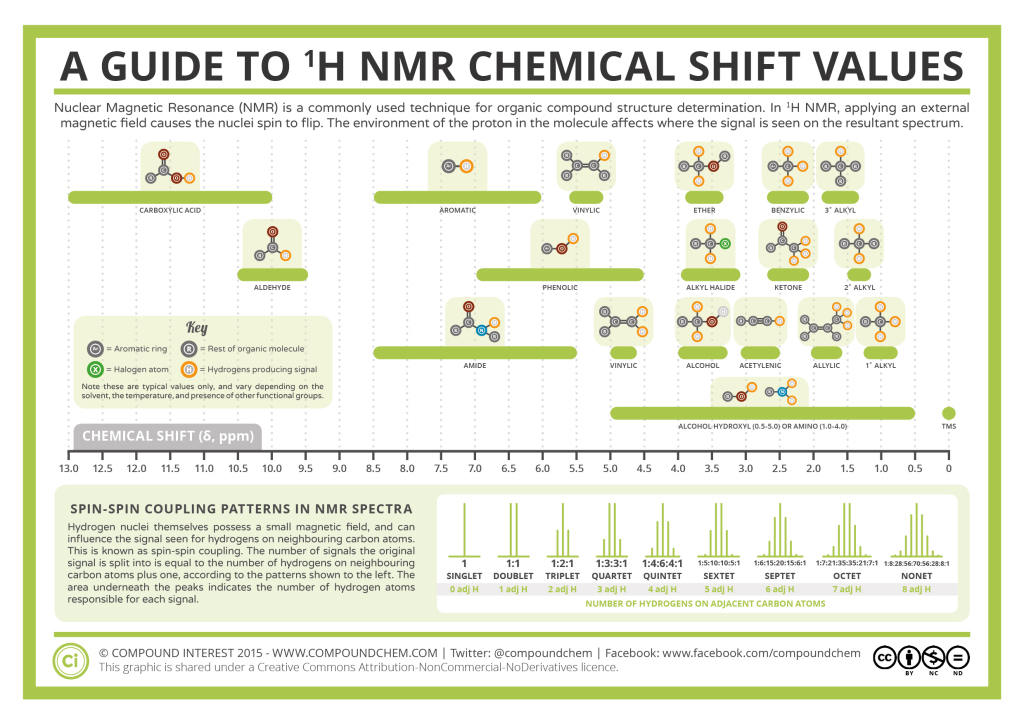
Just like in 1H-NMR, the standard used in 13C-NMR experiments to define the 0 ppm point is tetramethylsilane (TMS), although of course in 13C-NMR it is the signal from the four equivalent carbons in TMS that serves as the standard. Chemical shifts for 13C nuclei in organic molecules are spread out over a much wider range than for protons – up to 200 ppm for 13C compared to 12 ppm for protons. This is also fortunate, because it means that the signal from each carbon in a compound can almost always be seen as a distinct peak, without the overlapping that often plagues 1H-NMR spectra. The chemical shift of a 13C nucleus is influenced by essentially the same factors that influence a proton’s chemical shift: bonds to electronegative atoms and diamagnetic anisotropy effects tend to shift signals downfield (higher resonance frequency). In addition, sp2 hybridization results in a large downfield shift. The 13C-NMR signals for carbonyl carbons are generally the furthest downfield (170-220 ppm), due to both sp2 hybridization and to the double bond to oxygen.
Because of the low natural abundance of 13C nuclei, it is very unlikely to find two 13C atoms near each other in the same molecule, and thus we do not see spin-spin coupling between neighbouring carbons in a 13C-NMR spectrum. Figure 29.10a. is the 13C-NMR spectrum of ethyl ethanoate, showing the expected four signals, one for each of the carbons.

Symmetry in Molecules
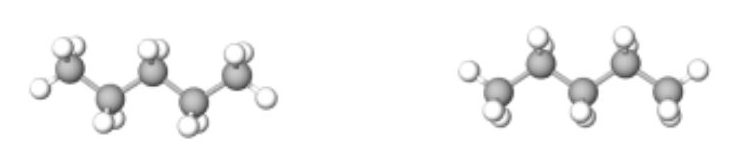
In the 13C NMR spectrum of pentane (Figure 29.10b.), there are three different peaks, even though pentane just contains methyl carbons (CH3) and methylene carbons (CH2). As far as the NMR spectrometer is concerned, pentane contains three different kinds of carbon, in three different environments. That result comes from symmetry.
Symmetry is an important factor in spectroscopy. Carbon atoms that are symmetry-inequivalent can absorb at different shifts. Carbon atoms that are symmetry-equivalent must absorb at the same shift. In Figure 29.10c., the pentane molecule is shown in two different orientations where it is visible that the end carbons are symmetry-equivalent and the second and fourth carbons along the chain are also symmetry-equivalent. However, the middle carbon is not; it never switches places with the other carbons when rotating the model. There are three different sets of inequivalent carbons; these three groups are not the same as each other according to symmetry.
13C NMR Chemical Shifts
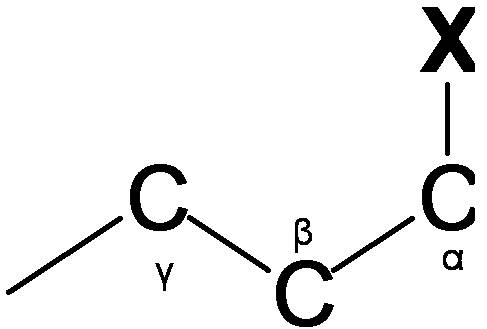
The carbon NMR is used for determining functional groups using characteristic shift values. 13C chemical shift is affect by electronegative effect and steric effect. If an H atom in an alkane (Figure 29.10d.) is replace by substituent X, electronegative atoms (O, N, halogen), α-carbon and β-carbon shift to downfield (left; increase in ppm) while γ-carbon shifts to upfield.
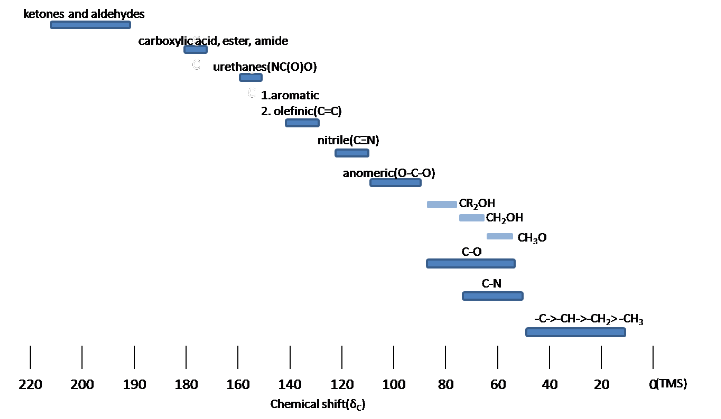
The steric effect is observed in acyclic and cyclic systems, which leads to downshifted chemical shifts. Infographic 29.10a and Figure 29.10e. show typical 13C chemical shift regions of the major chemical classes.
Example 29.10a
Review the spectrum and chemical structure in Figure 29.10f. Justify the location of each peak to each carbon in the molecule.

Solution
The C peak at about 140 ppm corresponds to the carbon of the ring where the methyl group is attached. The three CH peaks between 125-130 ppm correspond to the carbons in the ring. Due to symmetry in the molecule, two of these peaks represents two carbons each, the third peak represents the carbon at the bottom of the ring. The CH3 peak at about 23 ppm is the methyl group.
Source: Example is adapted from Organic Chem: Biological Emphasis Vol I (page 266), CC BY-NC-SA 4.0.
Example 29.10b
Review the spectrum and chemical structure in Figure 29.10g. Justify the location of each peak to each carbon in the molecule.

Solution
The C peak about 170 ppm is from the ester carbon. The C peak about 128 ppm is from right hand carbon in the carbon-carbon double bond. The CH2 peak about 125 ppm is from the left-hand carbon in the carbon-carbon double bond. The CH3 peak about 50 ppm is from the methyl group of the ester (attached to the oxygen atom). Finally, the CH3 peak about 20 ppm is from the methyl group attached to the carbon-carbon double bond.
Source: Example is adapted from Organic Chem: Biological Emphasis Vol I (page 266), CC BY-NC-SA 4.0.
Exercise 29.10b
Explain the C-13 NMR spectrum of ethanol.
Check Your Answer: [2]
Source: Exercise is adapted from Map: Organic Chemistry (Wade), CC BY-NC-SA 4.0.
Exercise 29.10c
Figures 29.10i. and 29.10j. show the structure and C-13 NMR spectrum for 1-methylethyl propanoate (also known as isopropyl propanoate or isopropyl propionate) respectively.
There are 5 lines in the spectrum. That means that there must be 5 different environments for the carbon atoms in the compound. Is that reasonable from the structure?
Check Your Answers:[3]
Source: Exercise is adapted from Map: Organic Chemistry (Wade), CC BY-NC-SA 4.0.
One of the greatest advantages of 13C-NMR compared to 1H-NMR is the breadth of the spectrum. In the proton NMR spectrum of 1-heptanol (Figure 29.10k.), only the signals for the alcohol proton (Ha) and the two protons on the adjacent carbon (Hb) are easily analyzed. The other proton signals overlap, making analysis difficult.
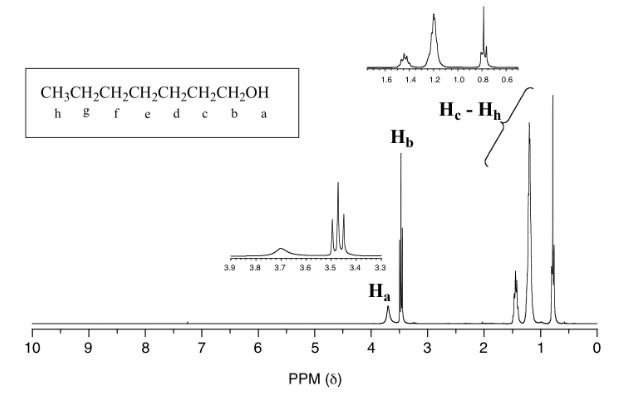
In the 13C spectrum of the same molecule (Figure 29.10l.), however, each carbon signal can be easily distinguished, and we know from this data that our sample has seven non-equivalent carbons. As well, the chemical shifts of the carbons get progressively smaller as they get farther away from the oxygen atom. This property of 13C-NMR makes it very helpful in the elucidation of larger, more complex structures.

Links to Enhanced Learning
The Chemical Detectives app on Chemical Detectives – Apps on Google Play and Chemical Detectives on the App Store (apple.com) allows users to browse various types of spectra (IR, MS, 1H NMR, 13C NMR, and elemental microanalysis) for simple organic compounds and also complete quizzes about various compounds based on their spectra. Customize of types of functional groups is possible (e.g. only hydrocarbons or only alcohols).
Attribution & References
Except where otherwise noted, this page is adapted by Samantha Sullivan Sauer from
- “12.11: Chemical Shifts and Interpreting ¹³C NMR Spectra” and “12.12: ¹³C NMR Spectroscopy and DEPT” In Map: Organic Chemistry (Wade), Complete and Semesters I and IIby LibreTexts, licensed under CC BY-NC-SA 4.0. Contributors from original source:
- Prof. Steven Farmer (Sonoma State University)
- Organic Chemistry With a Biological Emphasis by Tim Soderberg (University of Minnesota, Morris)
- Chris P Schaller, Ph.D., (College of Saint Benedict / Saint John’s University)
- “12.10: ¹³C NMR Spectroscopy” In Map: Organic Chemistry (Wade), Complete and Semesters I and IIby LibreTexts, licensed under CC BY-NC-SA 4.0. Contributors from original source:
- Prof. Steven Farmer (Sonoma State University)
- Chris P Schaller, Ph.D., (College of Saint Benedict / Saint John’s University)
- “12.13: Uses of ¹³C NMR Spectroscopy” In Map: Organic Chemistry (Wade), Complete and Semesters I and IIby LibreTexts, licensed under CC BY-NC-SA 4.0. Contributors from original source:
- Prof. Steven Farmer (Sonoma State University)
- William Reusch, Professor Emeritus (Michigan State U.), Virtual Textbook of Organic Chemistry
- Organic Chemistry With a Biological Emphasis by Tim Soderberg (University of Minnesota, Morris)
Note: The NMR spectra on this page have been produced from graphs taken from the Spectral Data Base System for Organic Compounds (SDBS) at the National Institute of Materials and Chemical Research in Japan.
-
a) 5, b) 5, c) 2
↵
-
There are two peaks because there are two different environments for the carbons. The carbon in the CH3 group is attached to 3 hydrogens and a carbon. This peak is showing up around 20 ppm. The carbon in the CH2 group is attached to 2 hydrogens, a carbon and an oxygen. This peak is showing up around 60 ppm. The two lines are in different places in the NMR spectrum because they need different external magnetic fields to bring them in to resonance at a particular radio frequency.
↵
-
There are 6 carbon atoms but only 5 lines. Why? In this case, two of the carbons are in exactly the same environment. They are attached to exactly the same things. Look at the two CH3 groups on the right-hand side of the molecule. Why the carbon in the CH3 on the left is not also in the same environment? Just like the ones on the right, the carbon is attached to 3 hydrogens and another carbon. But the similarity is not exact - follow the similarity along the rest of the molecule as well to be sure. The carbon in the left-hand CH3 group is attached to a carbon atom which in turn is attached to a carbon with two oxygens on it - and so on down the molecule. That's not exactly the same environment as the carbons in the right-hand CH3 groups. They are attached to a carbon which is attached to a single oxygen - and so on down the molecule.
↵
