29.5 Spectroscopy Basics
Learning Objectives
By the end of this section, you will be able to:
- Explain the behaviour of matter.
- Describe the electromagnetic spectrum as it applies to spectroscopy.
Spectroscopy is used to determine the structure of a compound. Electromagnetic radiation of a specified range of wavelengths is allowed to pass through a sample containing a compound of interest. The sample molecules absorb energy from some of the wavelengths, and as a result jump from a low energy ‘ground state’ to some higher energy ‘excited state’. Other wavelengths are not absorbed by the sample molecule, so they pass on through. A detector on the other side of the sample records which wavelengths were absorbed, and to what extent they were absorbed.
Behaviour of Matter
Matter can both absorb energy and emit it in the form of electromagnetic radiation such as light. The pattern in which matter absorbs or emits radiation is called its spectrum. In the past, and still to this day, studies of the spectrum of a substance have furnished important clues to the structure of matter. At the same time, the spectrum of a substance is often a very useful way of characterizing and hence identifying and analyzing that substance.
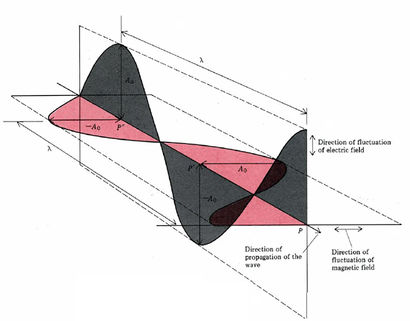
Many of the properties of electromagnetic radiation can be explained if light is thought of as periodically varying electric and magnetic fields (electromagnetic waves – Figure 29.5a.). Such waves can be characterized by their frequency v or their wavelength λ, and their speed of propagation is always λv = c = 2.998 × 10⁸ m/s. Some properties of light are more easily explained in terms of particles called photons. The energy of a photon is given by E = hv, where h = 6.626 × 10⁻³⁴ J s and is called Planck’s constant.
When any element is heated to a high temperature or excited in a discharge tube, it gives a line spectrum. Niels Bohr was able to predict the wavelengths of the lines in the spectrum of hydrogen by means of a theory which assigned the single electron to specific energy levels and hence to orbits of specific radius. Absorption of an appropriate quantity of energy can raise the hydrogen atom from a lower to a higher energy level, while emission of electromagnetic radiation corresponds to a change from a higher to a lower energy level. Although Bohr’s theory is quantitatively accurate only for hydrogen, his idea of energy levels is useful for all other atoms and even for molecules.
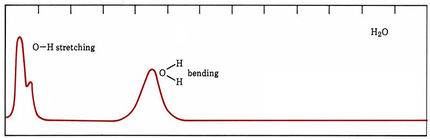
In the case of molecules, energy levels arise because of different speeds and kinds of molecular vibrations and rotations as well as because electrons are moved farther from or closer to positively charged nuclei. In organic compounds some groups of atoms vibrate at much the same frequency no matter what molecule they are in. The energy levels of such vibrations usually differ by roughly the energies of infrared photons, and many organic functional groups can be identified by the characteristic frequencies at which they absorb infrared radiation. When molecules absorb visible or ultraviolet light, band spectra occur (Figure 29.5b.). Some of the energy of each absorbed photon goes to excite an electron, but varying amounts also increase vibrational and rotational energies. Thus, photons are absorbed over a broad range of frequencies and wavelengths.
Electromagnetic Spectrum
Electromagnetic radiation is composed of electrical and magnetic waves which oscillate on perpendicular planes. Visible light is electromagnetic radiation. So are the gamma rays that are emitted by spent nuclear fuel, the x-rays that a doctor uses to visualize your bones, the ultraviolet light that causes a painful sunburn when you forget to apply sun block, the infrared light that the army uses in night-vision goggles, the microwaves that you use to heat up your frozen burritos, and the radio-frequency waves that bring music to anybody who is old-fashioned enough to still listen to FM or AM radio.
Just like ocean waves, electromagnetic waves travel in a defined direction. While the speed of ocean waves can vary, however, the speed of electromagnetic waves – commonly referred to as the speed of light – is essentially a constant, approximately 300 million meters per second. This is true whether we are talking about gamma radiation or visible light. Obviously, there is a big difference between these two types of waves – we are surrounded by the latter for more than half of our time on earth, whereas we hopefully never become exposed to the former to any significant degree. The different properties of the various types of electromagnetic radiation are due to differences in their wavelengths (Figure 29.5c.), and the corresponding differences in their energies: shorter wavelengths correspond to higher energy.

High-energy radiation (such as gamma- and x-rays) is composed of very short waves – as short as 10-16 meter from crest to crest. Longer waves are far less energetic, and thus are less dangerous to living things. Visible light waves are in the range of 400 – 700 nm (nanometers, or 10-9 m), while radio waves can be several hundred meters in length.
Because electromagnetic radiation travels at a constant speed, each wavelength corresponds to a given frequency, which is the number of times per second that a crest passes a given point. Longer waves have lower frequencies, and shorter waves have higher frequencies. Frequency is commonly reported in hertz (Hz), meaning ‘cycles per second’, or ‘waves per second’. When talking about electromagnetic waves, we can refer either to wavelength or to frequency – the two values are interconverted using the simple expression:
[latex]{\lambda}\nu = c[/latex]
where ν (the Greek letter ‘nu’) is frequency in s-1. Visible red light with a wavelength of 700 nm, for example, has a frequency of 4.29 x 10¹⁴ Hz, and an energy of 40.9 kcal per mole of photons. The full range of electromagnetic radiation wavelengths is referred to as the electromagnetic spectrum (FIgure 29.5d.).

Notice that visible light takes up just a narrow band of the full spectrum. White light from the sun or a light bulb is a mixture of all of the visible wavelengths. You see the visible region of the electromagnetic spectrum divided into its different wavelengths every time you see a rainbow: violet light has the shortest wavelength, and red light has the longest.
Molecular Spectroscopy
In a spectroscopy experiment, electromagnetic radiation of a specified range of wavelengths is allowed to pass through a sample containing a compound of interest. The sample molecules absorb energy from some of the wavelengths, and as a result jump from a low energy ‘ground state’ to some higher energy ‘excited state’. Other wavelengths are not absorbed by the sample molecule, so they pass on through. A detector on the other side of the sample records which wavelengths were absorbed, and to what extent they were absorbed.
Here is the key to molecular spectroscopy: a given molecule will specifically absorb only those wavelengths which have energies that correspond to the energy difference of the transition that is occurring.
Thus, if the transition involves the molecule jumping from ground state A to excited state B, with an energy difference of ΔE, (Figure 29.5e.) the molecule will specifically absorb radiation with wavelength that corresponds to ΔE, while allowing other wavelengths to pass through unabsorbed.

By observing which wavelengths a molecule absorbs, and to what extent it absorbs them, we can gain information about the nature of the energetic transitions that a molecule is able to undergo, and thus information about its structure.
To get an introduction to infrared spectroscopy (Chapter 29.6) and mass spectrometry (Chapter 29.7), watch IR Spectroscopy and Mass Spectrometry: Crash Course Organic Chemistry #5 on YouTube (14 min)
Video source: Crash Course. (2020, June 9). IR Spectroscopy and Mass Spectrometry: Crash Course Organic Chemistry #5 [Video]. YouTube.
Attribution & References
Except where otherwise noted, this page is adapted by Samantha Sullivan Sauer from:
- “11.1: The Electromagnetic Spectrum and Spectroscopy” In Map: Organic Chemistry (Wade), Complete and Semesters I and II by LibreTexts, licensed under CC BY-NC-SA 4.0.
- “21.1: Prelude to Spectroscopy” In ChemPRIME (Moore et al.) by Ed Vitz, John W. Moore, Justin Shorb, Xavier Prat-Resina, Tim Wendorff, & Adam Hahn, licensed under CC BY-NC-SA 4.0
Combined and modified to improve student understanding.
use of electromagnetic radiation (energy) to determine the structure of a compound
anything that occupies space and has mass
the pattern in which matter absorbs or emits radiation
The full range of electromagnetic radiation wavelengths
