10.1 Electromagnetic Radiation
Learning Objectives
By the end of this section, you will be able to:
- Define the electromagnetic spectrum, and describe it in terms of wavelengths, frequencies, and energy
- Describe both the wave and particle nature of light
- Use appropriate equations to calculate related light-wave properties such as period, frequency, wavelength, and energy
- Describe and explain the differences and similarities of each section of the electromagnetic spectrum and the applications of radiation from those sections
The nature of light has been a subject of inquiry since antiquity. In the seventeenth century, Isaac Newton performed experiments with lenses and prisms and was able to demonstrate that white light consists of the individual colors of the rainbow combined together. Newton explained his optics findings in terms of a “corpuscular” view of light, in which light was composed of streams of extremely tiny particles travelling at high speeds according to Newton’s laws of motion. Others in the seventeenth century, such as Christiaan Huygens, had shown that optical phenomena such as reflection and refraction could be equally well explained in terms of light as waves travelling at high speed through a medium called “luminiferous aether” that was thought to permeate all space. Early in the nineteenth century, Thomas Young demonstrated that light passing through narrow, closely spaced slits produced interference patterns that could not be explained in terms of Newtonian particles but could be easily explained in terms of waves. Later in the nineteenth century, after James Clerk Maxwell developed his theory of electromagnetic radiation (EMR) and showed that light was the visible part of a vast spectrum of electromagnetic waves, the particle view of light became thoroughly discredited. By the end of the nineteenth century, scientists viewed the physical universe as roughly comprising two separate domains: matter composed of particles moving according to Newton’s laws of motion, and electromagnetic radiation consisting of waves governed by Maxwell’s equations. Today, these domains are referred to as classical mechanics and classical electrodynamics (or classical electromagnetism). Although there were a few physical phenomena that could not be explained within this framework, scientists at that time were so confident of the overall soundness of this framework that they viewed these aberrations as puzzling paradoxes that would ultimately be resolved somehow within this framework. As we shall see, these paradoxes led to a contemporary framework that intimately connects particles and waves at a fundamental level called wave-particle duality, which has superseded the classical view.
Visible light and other forms of electromagnetic radiation play important roles in chemistry, since they can be used to infer the energies of electrons within atoms and molecules. Much of modern technology is based on electromagnetic radiation. For example, radio waves from a mobile phone, X-rays used by dentists, the energy used to cook food in your microwave, the radiant heat from red-hot objects, and the light from your television screen are forms of electromagnetic radiation that all exhibit wavelike behaviour.
Watch the TED-Ed video Light waves, visible and invisible by Lucianne Walkowicz (5:56)
Video Source: TED-Ed. (2013, September 19). Light waves, visible and invisible [Video].
Waves
A wave is an oscillation or periodic movement that can transport energy from one point in space to another. Common examples of waves are all around us. Shaking the end of a rope transfers energy from your hand to the other end of the rope, dropping a pebble into a pond causes waves to ripple outward along the water’s surface, and the expansion of air that accompanies a lightning strike generates sound waves (thunder) that can travel outward for several miles. In each of these cases, kinetic energy is transferred through matter (the rope, water, or air) while the matter remains essentially in place. An insightful example of a wave occurs in sports stadiums when fans in a narrow region of seats rise simultaneously and stand with their arms raised up for a few seconds before sitting down again while the fans in neighbouring sections likewise stand up and sit down in sequence. While this wave can quickly encircle a large stadium in a few seconds, none of the fans actually travel with the wave-they all stay in or above their seats.
Waves need not be restricted to travel through matter. As Maxwell showed, electromagnetic waves consist of an electric field oscillating in step with a perpendicular magnetic field, both of which are perpendicular to the direction of travel. These waves can travel through a vacuum at a constant speed of 2.998 × 10⁸ m/s, the speed of light (denoted by c).
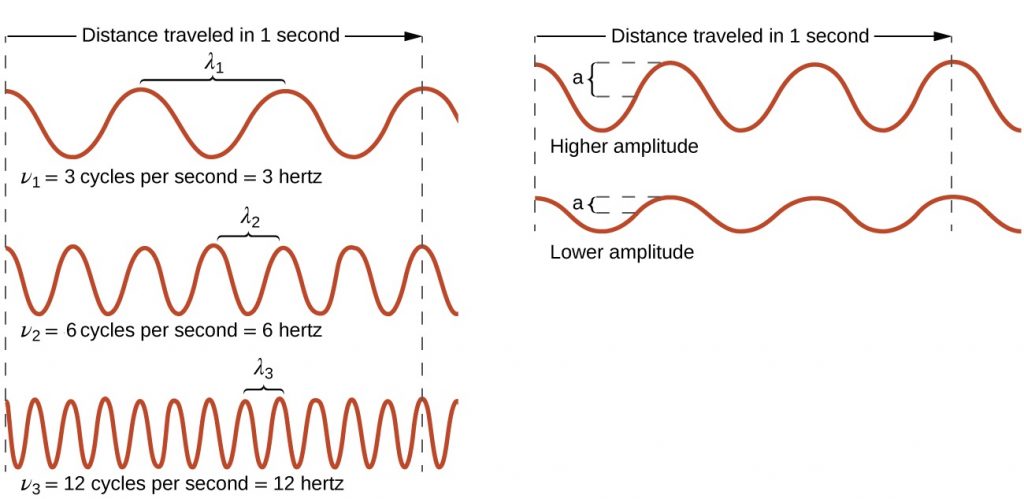
All waves, including forms of electromagnetic radiation, are characterized by, a wavelength (denoted by λ, the lowercase Greek letter lambda), a frequency (denoted by ν, the lowercase Greek letter nu), and an amplitude. As can be seen in Figure 10.1a, the wavelength is the distance between two consecutive peaks or troughs in a wave (measured in meters in the SI system). Electromagnetic waves have wavelengths that fall within an enormous range-wavelengths of kilometres (103 m) to picometres (10−12 m) have been observed. The frequency is the number of wave cycles that pass a specified point in space in a specified amount of time (in the SI system, this is measured in seconds). A cycle corresponds to one complete wavelength. The unit for frequency, expressed as cycles per second [s−1], is the hertz (Hz), so 1 Hz = 1 s-1. Common multiples of this unit are megahertz, (1 MHz = 1 × 10⁶ Hz) and gigahertz (1 GHz = 1 × 10⁹ Hz). The amplitude corresponds to the magnitude of the wave’s displacement and so, in Figure 10.1a, this corresponds to one-half the height between the peaks and troughs. The amplitude is related to the intensity of the wave, which for light is the brightness, and for sound is the loudness.
The product of a wave’s wavelength (λ) and its frequency (ν), λν, is the speed of the wave. Thus, for electromagnetic radiation in a vacuum:
In summary, the properties of a wave are determined by:
- wave speed; all electromagnetic waves move through space at the same, constant speed of 2.99 x 10⁸ ms-1, which is the speed of light, c.
- height (amplitude)
- wavelength
- frequency
Electromagnetic radiation is also referred to as electromagnetic energy, which is a term used to describe the various energies that travel as wavelengths through space at the speed of light. Various types of electromagnetic radiation carry different amounts of energy. Wavelength is inversely proportional to its energy and frequency.
- Shorter wavelengths have higher frequency and have greater energy
- Longer wavelengths have lower frequency and less energy
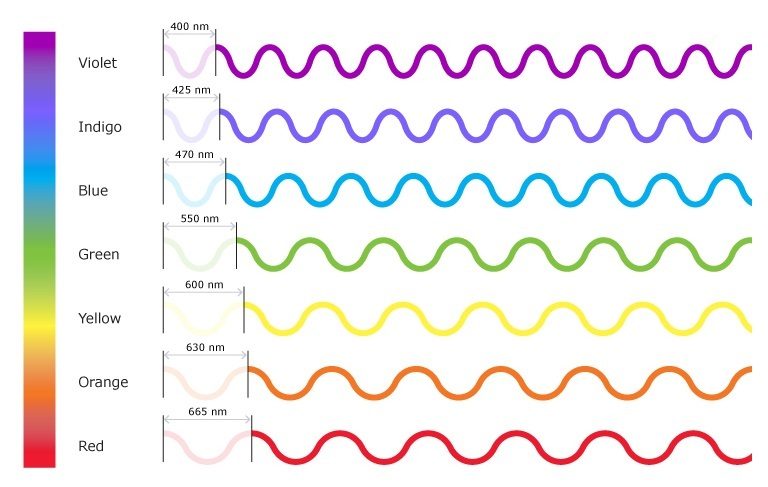
This inverse proportionality is illustrated in Figure 10.1b. Each component colour in the visible spectrum of light has different wavelengths, with corresponding frequencies and energy. The spectrum ranges from dark red at 700 nm to violet at 400 nm. Longer wavelengths have lower frequency and carry less energy; shorter wavelengths have higher frequency and carry more energy.
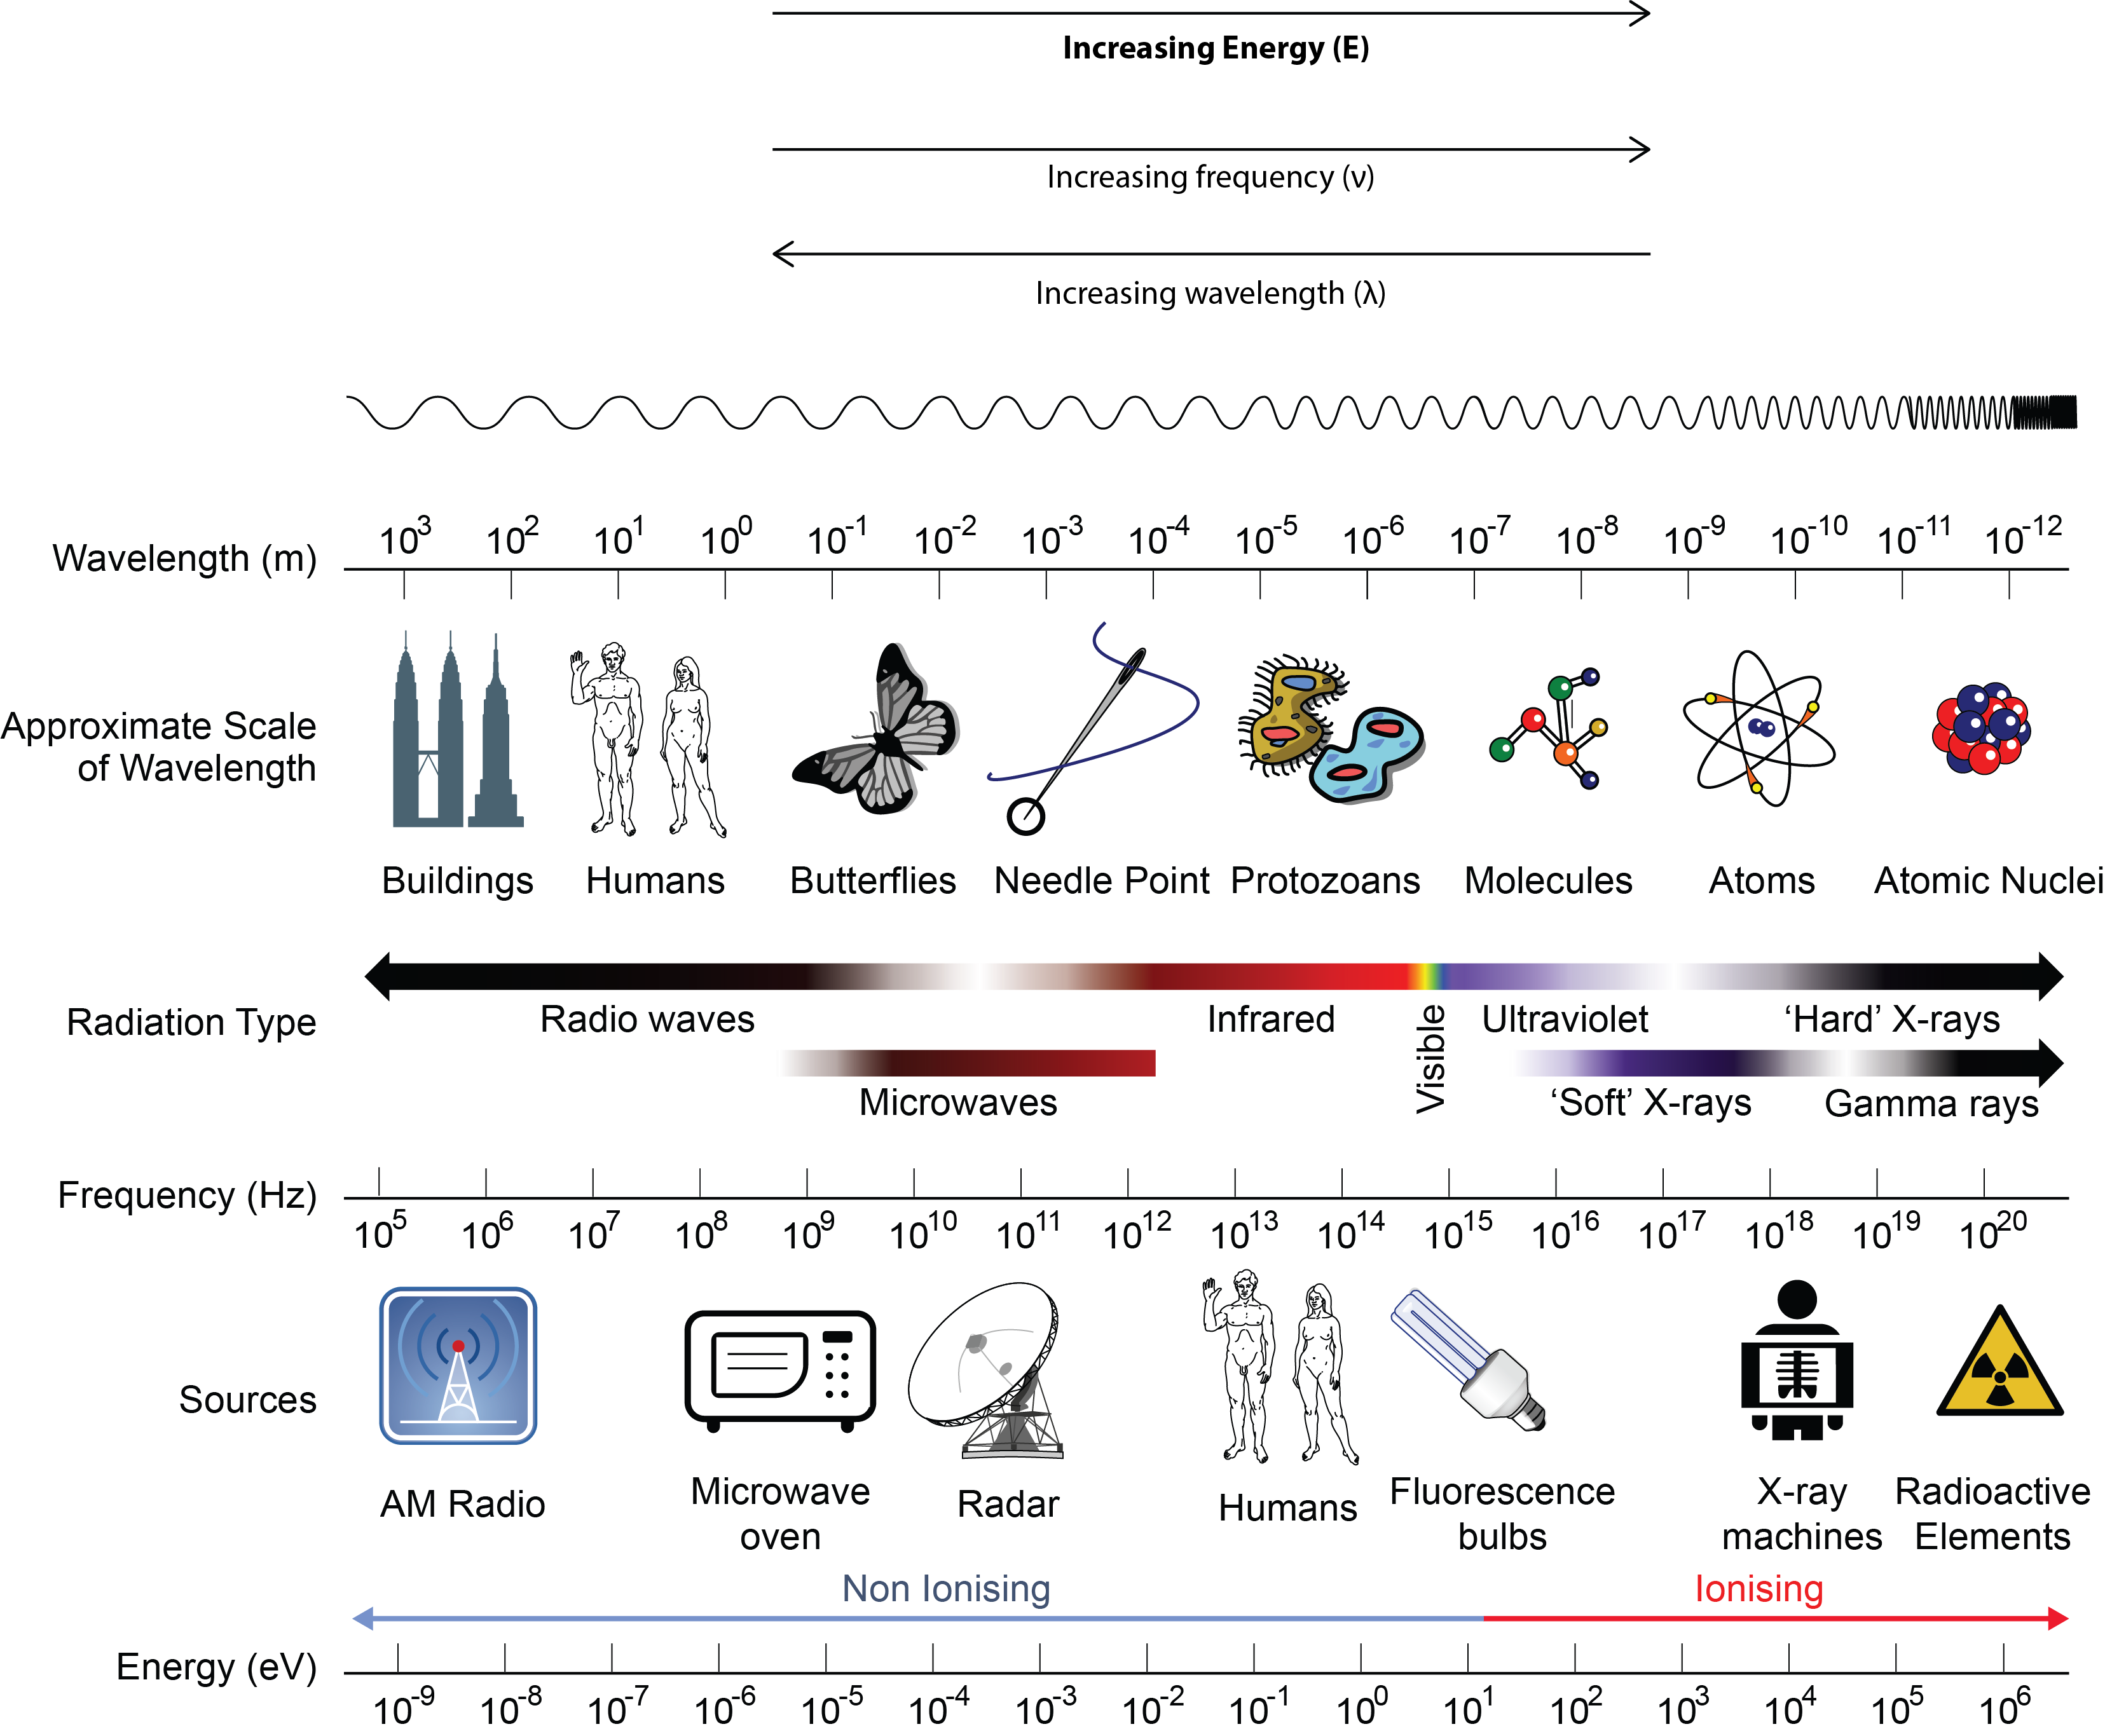
The inverse proportionality for a broader range of all types of electromagnetic energy is illustrated in Figure 10.1c. Each of the various colours of visible light has specific frequencies (energy amounts) and wavelengths associated with them, and you can see that visible light makes up only a small portion of the electromagnetic spectrum. Because the technologies developed to work in various parts of the electromagnetic spectrum are different, for reasons of convenience and historical legacies, different units are typically used for different parts of the spectrum. For example, radio waves are usually specified as frequencies (typically in units of MHz), while the visible region is usually specified in wavelengths (typically in units of nm or angstroms).
Example 10.1a
For the following example, reference Figure 10.1b.
Compare green light (550nm) and red light (665nm) from the visual light portion of the electromagnetic spectrum and answer the following questions:
- Which colour of light, red or green, has a shorter wavelength?
- Which colour of light, red or green, has a lower frequency?
- Which colour of light, red or green, contains lower energy?
Solution
- Green light has a shorter wavelength than red light
- Red light has lower frequency since it has a longer wavelength than green light
- Red light contains less energy since it has a lower frequency compared to green light
Exercise 10.1a
For the following exercises, reference Figure 10.1b.
Check Your Learning Exercise (Text Version)
Instructions: Answer the following questions related to Wavelength, Frequency, and Energy of Electromagnetic Radiation
- True or False? Wavelength is inversely proportional to its energy and frequency
- True or False? Longer wavelengths have lower frequency and less energy
- True or False? Shorter wavelengths have higher frequency and have greater the energy
- Review the word list provided which contains seven words or terms. Choose a word or phase to fill in the (BLANK) to make the statements correct. Each word will be used once.
WORD LIST: frequency (v), wavelength (λ), electromagnetic spectrum, greater, less, shorter, longer- [BLANK] wavelengths have higher frequency and [BLANK] energy
- [BLANK] is the distance between two peaks or troughs in a wave of given amplitude(height).
- [BLANK] is the number of waves (cycles) per second that pass a given point in space.
- [BLANK] wavelengths have lower frequency and [BLANK] energy.
- Visible light accounts for a very small portion of the [BLANK] of light.
- Which of the following statements is true when you compare blue light (with a wavelength of 425nm) to orange light (with a wavelength of 620nm)
- orange light has a higher frequency and more energy than blue light
- blue light has a lower frequency than orange light
- orange light has a lower frequency but higher energy than blue light
- orange light has a lower frequency and less energy than blue light
- blue light has less energy than orange light
- True or False? The formula c=λν can be used to solve for wavelength or frequency of electromagnetic radiation.
Check Your Answer[1]
Types of Electromagnetic Radiation (EMR)
We generally take light for granted, but it is a truly amazing and mysterious form of energy. Think about it: light travels to Earth across millions of kilometres of empty space. When it reaches us, it interacts with matter in various ways to generate almost all the energy needed to support life, provide heat, and cause weather patterns. Light is a form of electromagnetic radiation (EMR). The term light usually refers to visible light, but this is not the only form of EMR. As we will see, visible light occupies a narrow band in a broad range of types of electromagnetic radiation.
Take a few minutes to study the positions of the various types of radiation on the EM spectrum in Figure 10.1c. Sometimes all radiation with frequencies lower than those of visible light are referred to as infrared (IR) radiation. This includes radio waves, which overlap with the frequencies used for media broadcasts of TV and radio signals. The microwave radiation that you see on the diagram is the same radiation that is used in a microwave oven or cell phone. What we feel as radiant heat is also a form of low-frequency EMR.
All the high-frequency radiation to the right of visible light is sometimes referred to as ultraviolet (UV) radiation. This includes X-rays and gamma (γ) rays. The narrow band that is visible light is a combination of the colours of the rainbow and extends from lower-frequency red light to higher-frequency violet light, thus the terms are infrared (below red) and ultraviolet (beyond violet). Electromagnetic Radiation is typically classified by its wavelength.
TIPS for Success
Wavelengths of visible light are often given in nanometers, nm. One nm equals 10−9 m.
1 nm = 10-9 m
For example, yellow light has a wavelength of about 600 nm, or 6×10⁻⁷ m.
Listed below are several forms of electromagnetic radiation and its wavelength, in order from lowest frequency and energy to highest frequency and energy:
- Radiowaves = λ > 0.01 m.
- Microwaves = 10-4 m < λ < 10-2 m
- Infrared (IR) = 8 x 10⁻⁷ < λ < 10-5 m
- Visible = 4 x 10⁻⁷ < λ < 8 x 10⁻⁷ m (ROYGBIV – acronym for visible colour order)
- Ultraviolet (UV) = 10-8 < λ < 4 x 10⁻⁷ m
- X-rays = 10-10 < λ < 10-8 m
- Gamma rays = λ < 10-10 m
Example 10.1b
For the following example on types of electromagnetic radiation, reference Figure 10.1c.
Using the given five examples of electromagnetic radiation and its wavelength, arrange these in order of radiation that contains the most energy to least energy.
- Infrared λ = 900 nm
- Blue light = 450 nm
- Red light = 700nm
- Gamma rays λ = 0.01nM
- Radio waves λ = 3000 m
Solution
Since the wavelength of electromagnetic radiation is inversely proportional to its energy, they will be ordered from shortest wavelength to longest wavelength to show the order of radiation that contains most energy to least energy.
- Gamma rays λ = 0.01nM – Contains the MOST ENERGY
- Blue light = 450 nm
- Red light = 700nm
- Infrared λ = 900 nm
- Radio waves λ = 3000 m – Contains the LEAST ENERGY
Source: “Example 10.1b” created by Jackie MacDonald, CC BY-NC-SA 4.0
Exercise 10.1b
For the following exercise, reference Figure 10.1c.
Using the given five examples of electromagnetic radiation and its wavelength, arrange these in order of radiation that has the lowest frequency to highest frequency.
- Microwaves = 300 cm
- Violet light = 400 nm
- Yellow light = 600nm
- X rays λ = 5 nm
- Infrared λ = 900 nm
Check Your Answer[2]
Source: “Exercise 10.1b” created by Jackie MacDonald, CC BY-NC-SA 4.0
One can calculate the frequency or wavelength of electromagnetic radiation using the formula c=λν, where [latex]c = 2.998 \times 10^8\text{ms}^{-1}[/latex].
Example 10.1c
Calculations with Frequency and Wavelength of Electromagnetic Radiation
A sodium streetlight gives off yellow light that has a wavelength of 589 nm (1 nm = 1 × 10⁻⁹ m). What is the frequency of this light?
Solution
We can rearrange the equation c = λν to solve for the frequency:
Since c is expressed in meters per second, we must also convert 589 nm to meters.
Exercise 10.1c
Calculations with the Frequency and Wavelength of Electromagnetic Radiation
One of the frequencies used to transmit and receive cellular telephone signals in the United States is 850. MHz (3 significant figures). What is the wavelength in meters of these radio waves?
Check Your Answer[3]
Particle-Wave Duality
We have long known that EM radiation is like a wave, capable of interference and diffraction. We now see that light can also be modelled as particles—massless photons of discrete energy and momentum. In 1905, Albert Einstein (1879-1955), developed a theory stating that light has a dual nature: Light acts not only as a wave, but also as a particle. As illustrated above when discussing visible light, each particle of light has a quantum of energy associated with it and is called a photon. We call this twofold nature the particle-wave duality, meaning that EM radiation has properties of both particles and waves. This may seem contradictory, since we ordinarily deal with large objects that never act like both waves and particles. An ocean wave, for example, looks nothing like a grain of sand. However, this so-called duality is simply a term for properties of the photon analogous to phenomena we can observe directly, on a macroscopic scale. If this term seems strange, it is because we do not ordinarily observe details on the quantum level directly, and our observations yield either particle-like or wave-like properties, but never both simultaneously.
Watch Wave-Particle Duality and the Photoelectric Effect (3:55)
Video Source: Professor Dave Explains. (2015, August 4). Wave-particle duality and the photoelectric effect [Video]. YouTube.
Exploring Specific Types of Electromagnetic Radiation
Wireless Communication – Radio Waves
Wireless communication uses long radio waves to travel great distances to transmit their signals. Some forms of EMR that use radio waves (all with different wavelengths, frequencies and energy amounts) include, radio broadcasting, cellular networks, radar, satellite communication, remote controlled toys, and navigation and air traffic control (GPS).
Wireless Communication

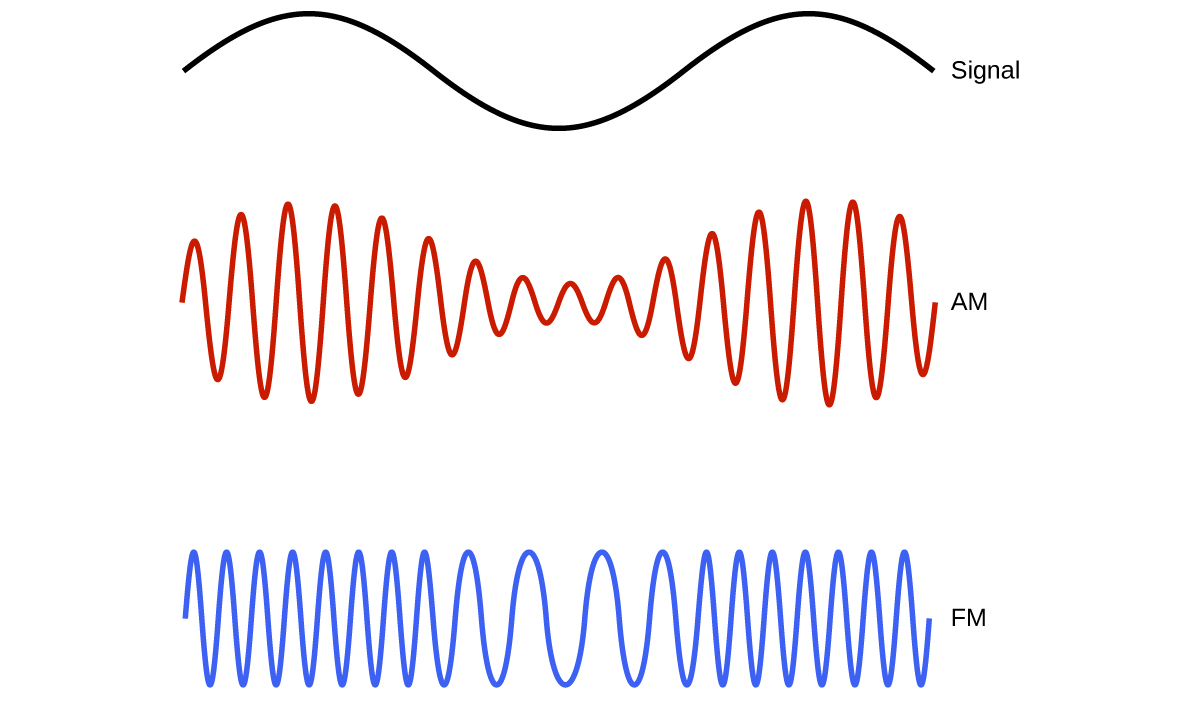
Many valuable technologies operate in the radio (3 kHz-300 GHz) frequency region of the electromagnetic spectrum (Figure 10.1d). At the low frequency (low energy, long wavelength) end of this region are AM (amplitude modulation) radio signals (540-2830 kHz) that can travel long distances. FM (frequency modulation) radio signals are used at higher frequencies (87.5-108.0 MHz). In AM radio, the information is transmitted by varying the amplitude of the wave (Figure 10.1e). In FM radio, by contrast, the amplitude is constant and the instantaneous frequency varies.
Other technologies also operate in the radio-wave portion of the electromagnetic spectrum. For example, 4G cellular telephone signals are approximately 880 MHz, while Global Positioning System (GPS) signals operate at 1.228 and 1.575 GHz, local area wireless technology (Wi-Fi) networks operate at 2.4 to 5 GHz, and highway toll sensors operate at 5.8 GHz. The frequencies associated with these applications are convenient because such waves tend not to be absorbed much by common building materials. All are forms of radio waves.
X-Rays
X-Rays are a form of electromagnetic radiation, invisible to the human eye. Unlike visible light, x-rays have higher energy, higher frequency (and shorter wavelengths), which can penetrate most matter, including the body. Medical x-rays are used to generate images of tissues and structures inside the body.
Watch How Do X-rays Work? (1 min 28 s)
Video Source: NIBIB gov. (2014, November 26). How do x-rays work? [Video]. YouTube.
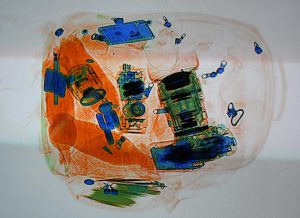
All of us can identify diagnostic uses of x-ray photons. Among these are the universal dental and medical x-rays that have become an essential part of medical diagnostics (Figure 10.1f and Figure 10.1g). X-rays are also used to inspect our luggage at airports, as shown in Figure 10.1h, and for early detection of cracks in crucial aircraft components. An x-ray is not only a noun meaning high-energy photon, it is also an image produced by x-rays, and it has been made into a familiar verb—to be x-rayed.

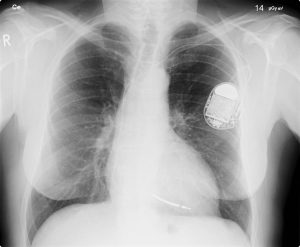
The most common x-ray images are simple shadows. Since x-ray photons have high energies, they penetrate materials that are opaque to visible light. The more energy an x-ray photon has, the more material it will penetrate. So an x-ray tube may be operated at 50.0 kV for a chest x-ray, whereas it may need to be operated at 100 kV to examine a broken leg in a cast. The depth of penetration is related to the density of the material as well as to the energy of the photon. The denser the material, the fewer x-ray photons get through and the darker the shadow. Thus x-rays excel at detecting breaks in bones and in imaging other physiological structures, such as some tumours, that differ in density from surrounding material. Because of their high photon energy, x-rays produce significant ionization in materials and damage cells in biological organisms. Modern uses minimize exposure to the patient and eliminate exposure to others.
Scientists in Action: Dorothy Hodgkin, PhD.
Because the wavelengths of X-rays (10-10,000 picometres [pm]) are comparable to the size of atoms, X-rays can be used to determine the structure of molecules. When a beam of X-rays is passed through molecules packed together in a crystal, the X-rays collide with the electrons and scatter. Constructive and destructive interference of these scattered X-rays creates a specific diffraction pattern. Calculating backward from this pattern, the positions of each of the atoms in the molecule can be determined very precisely. One of the pioneers who helped create this technology was Dorothy Crowfoot Hodgkin.
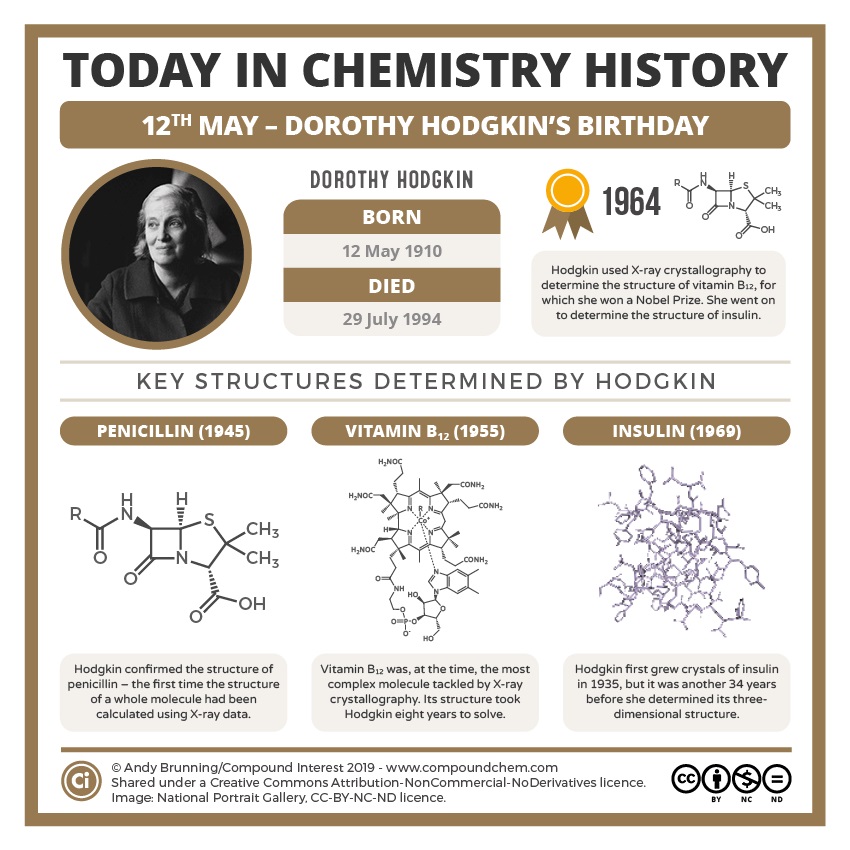
She was born in Cairo, Egypt, in 1910, where her British parents were studying archeology. Even as a young girl, she was fascinated with minerals and crystals. When she was a student at Oxford University, she began researching how X-ray crystallography could be used to determine the structure of biomolecules. She invented new techniques that allowed her and her students to determine the structures of vitamin B12, penicillin, and many other important molecules. Diabetes, a disease that affects 382 million people worldwide, involves the hormone insulin. Hodgkin began studying the structure of insulin in 1934, but it required several decades of advances in the field before she finally reported the structure in 1969. Understanding the structure has led to better understanding of the disease and treatment options (Brunning, 2019).
Key Equations
c = λν
Attribution & References
Except where otherwise noted, this page is adapted by Jackie MacDonald from “6.1 Electromagnetic Energy” In Chemistry 2e (Open Stax) by Paul Flowers, Klaus Theopold, Richard Langley & William R. Robinson is licensed under CC BY 4.0. Access for free at Chemistry 2e (Open Stax) / Content has simplified and remixed with information from:
- “15. 1 The Electromagnetic Spectrum” and “21.3 Dual Nature of Light” In Physics (Open Stax) by Paul Peter Urone, Roger Hinrichs is licensed under CC BY 4.0 . Access for free at Physics (Open Stax). / A derivative of TEA Physics by Texas Education Agency (TEA).
- “X Rays: Atomic Origins and Applications” in College Physics 2e (Open Stax) by Paul Peter Urone, Roger Hinrichs, licensed under CC BY 4.0. Access for free at College Physics 2e (Open Stax).
-
“3.1 Electromagnetic Energy” In General Chemistry 1 & 2 by Rice University, a derivative of Chemistry (Open Stax) by Paul Flowers, Klaus Theopold, Richard Langley & William R. Robinson and is licensed under CC BY 4.0. Access for free at Chemistry (OpenStax)
References
Brunning, A. (2019). This Day in Chemistry May 12 – Dorothy Hodgkin. Compound Interest. CC BY-NC-ND 4.0
Science Learning Hub – Pokapū Akoranga Pūtaiao, University of Waikato. (April 24, 2019). Colours of Light.
- (1) True; (2) True; (3) True (4a) shorter, less; (4b) wavelength (λ); (4c) frequency (v); (4d) longer, greater; (4e) electromagnetic spectrum; (5) d; (6) True ↵
- Since the wavelength of electromagnetic radiation is inversely proportional to its frequency, they will be ordered from longest wavelength to shortest wavelength to show the order of radiation that contains lowest frequency to highest frequency.
- Microwaves = 300 cm - LOWEST FREQUENCY
- Infrared λ = 900 nm
- Yellow light = 600nm
- Violet light = 400 nm
- X rays λ = 5 nm - HIGHEST FREQUENCY
- We can rearrange the equation c = λν to solve for the frequency:
[latex]\lambda= \frac{c}{\nu}[/latex]
Since c is expressed in meters per second (ms-1), we must also convert 850. MHz to s-1. Recall, 1 MHz = 1.0 x 10⁶ Hz = 1.0 x 10⁶ s-1
So 850. MHz = 8.50 x 10⁸ s-1SOLVE:[latex]\lambda= \frac{2.99\times 10^{8} ms^{-1}}{8.50 \times 10^{8} s^{-1}}[/latex]λ = 0.3527 m (round final answer to 3 significant figures)λ = 0.353 m↵
energy transmitted by waves that have an electric-field component and a magnetic-field component
oscillation that can transport energy from one point to another in space
distance between two consecutive peaks or troughs in a wave
number of wave cycles (peaks or troughs) that pass a specified point in space per unit time
extent of the displacement caused by a wave (for sinusoidal waves, it is one-half the difference from the peak height to the trough depth, and the intensity is proportional to the square of the amplitude)
the unit of frequency, which is the number of cycles per second, s−1
smallest possible packet of electromagnetic radiation, a particle of light
term used to describe the fact that elementary particles including matter exhibit properties of both particles (including localized position, momentum) and waves (including nonlocalization, wavelength, frequency)
