10.2 The Bohr Atom
Learning Objectives
By the end of this section, you will be able to:
- Explain the difference between the absorption spectrum and the emission spectrum of radiation emitted by atoms
- Describe the Bohr model of the hydrogen atom
- Summarize how Bohr’s quantum model of the hydrogen atom explains the radiation spectrum of atomic hydrogen
- Review key equations used to calculate energies of light emitted or absorbed by hydrogen atoms
Our view of objects in the sky at night, the warm radiance of sunshine, the sting of sunburn, neon signs around us, our cell phone conversations, and the X-rays revealing a broken bone—all are brought to us by electromagnetic waves. It would be hard to overstate the practical importance of electromagnetic waves, through their role in vision, through countless technological applications, and through their ability to transport the energy from the Sun through space to sustain life and almost all of its activities on Earth.
Theory predicted the general phenomenon of electromagnetic waves before anyone realized that light is a form of an electromagnetic wave. In the mid-nineteenth century, James Clerk Maxwell formulated a single theory combining all the electric and magnetic effects known at that time. Maxwell’s equations, summarizing this theory, predicted the existence of electromagnetic waves that travel at the speed of light. His theory also predicted how these waves behave, and how they carry both energy and momentum. These discoveries contributed to the emergence of the modern atomic theory.
Scientists continued to perform experiments to investigate the properties of electromagnetic radiation. Evidence supported that atoms could give off light. Following the work of Ernest Rutherford and his colleagues in the early twentieth century, the picture of atoms consisting of tiny dense nuclei surrounded by lighter and even tinier electrons continually moving about the nucleus was well established. This theory was called the planetary model since it pictured the atom as a miniature “solar system” with the electrons orbiting the nucleus like planets orbiting the sun. Rutherford’s model for atoms had one serious problem. Maxwell’s theory of electromagnetic radiation says that when electrons change either speed or the direction of motion, they must emit energy. Science had proved that orbiting electrons constantly change their direction of motion, so they should, in theory, emit a constant stream of energy. Applying Maxwell’s theory to Rutherford’s model, all electrons should spiral into the nucleus of the atom as they lose energy, and this collapse should happen very quickly—in about 10–16 seconds. However, experimental results were not supporting such findings. Scientists concluded the atom’s structure and how electrons move around the nucleus must be different than originally theorized. It was Danish physicist, Niels Bohr (1885–1962), who proposed an updated theory of how electrons remain in orbit.
Emission and Absorption Spectra
To understand the specifics of Bohr’s model, we must first review the nineteenth-century discoveries regarding line spectra that prompted its formulation.
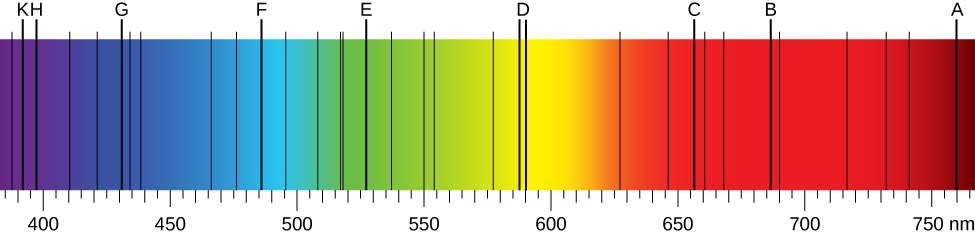
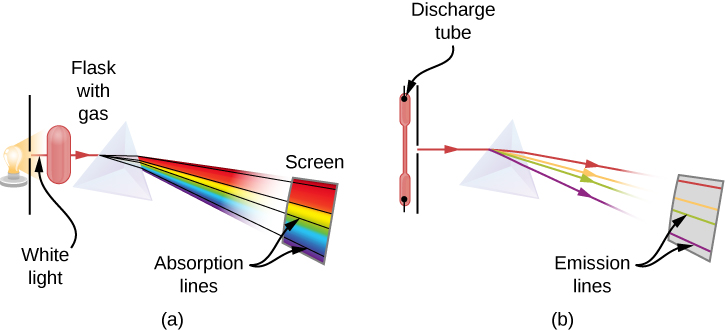
When we use a prism to analyze white light coming from the sun, several dark lines in the solar spectrum are observed (Figure 10.2a). Solar absorption lines are called Fraunhofer lines after Joseph von Fraunhofer, who accurately measured their wavelengths. During 1854–1861, Gustav Kirchhoff and Robert Bunsen discovered that for the various chemical elements, the line emission spectrum of an element exactly matches its line absorption spectrum. The difference between the absorption spectrum and the emission spectrum is explained in Figure 10.2b. An absorption spectrum is observed when light passes through a gas. This spectrum appears as black lines that occur only at certain wavelengths on the background of the continuous spectrum of white light (Figure 10.2b). The missing wavelengths tell us which wavelengths of the radiation are absorbed by the gas. The emission spectrum is observed when light is emitted by a gas. This spectrum is seen as colourful lines on the black background (Figure 10.2c and Figure 10.2d). Positions of the emission lines tell us which wavelengths of the radiation are emitted by the gas. Over time it was observed and concluded that each chemical element has its own characteristic emission spectrum. For each element, the positions of its emission lines are exactly the same as the positions of its absorption lines. This means that atoms of a specific element absorb radiation only at specific wavelengths and radiation that does not have these wavelengths is not absorbed by the element at all. This also means that the radiation emitted by atoms of each element has exactly the same wavelengths as the radiation they absorb.


Watch Emission and Absorption Spectra (5:17)
Video Source: Bozemann Science. (2015, March 6). Emission and absorption spectra [Video]. YouTube.
The Bohr Atom
It was Niels Bohr who solved the mystery of how electrons remain in orbit. Historically, Bohr’s model of the hydrogen atom is the very first model of atomic structure that correctly explained the specific radiation emittance spectra of atomic hydrogen. He applied the concept of energy quanta, proposed by German physicist, Max Planck (1858-1947), which stated that energy is never emitted continuously, but in small, discrete packages of energy called quanta. With this in mind, Bohr suggested that the spectrum of hydrogen can be understood if we assume that orbits of only certain sizes and specific distances from the atom’s nucleus are possible for the electron to exist in. Bohr further assumed that as long as the electron moves in only one of these allowed orbits, it radiates no energy. Its energy would change only if it moved from one orbit to another. At the microscopic level of the atom, experiment after experiment has confirmed the validity of Bohr’s strange idea. Bohr’s suggestions became one of the foundations of the new (and much more sophisticated) model of the subatomic world called quantum mechanics.
In Bohr’s model, if the electron moves from one orbit to another closer to the atomic nucleus, it must give up some energy in the form of electromagnetic radiation. If the electron goes from an inner orbit to one farther from the nucleus, however, it requires some additional energy. One way to obtain the necessary energy is to absorb electromagnetic radiation that may be streaming past the atom from an outside source.
A key feature of Bohr’s model is that each of the permitted electrons that orbit around a given atom have a certain energy value; we, therefore, can think of each orbit as an energy level. Furthermore, all elements have the same set of energy levels. Lower energy levels are closer to the nucleus and higher energy levels are farther from the nucleus of an atom. To move from one orbit to another either up or down (which will have its own specific energy value) requires a change in the electron’s energy—a change determined by the difference between the two energy values. Here we have one of the situations where it is easier to think of electromagnetic radiation as particles (photons) rather than as waves since each jump (or transition) to a different level has a fixed and definite energy change associated with it. Bohr concluded the following:
- The atom must first receive a quantum amount of energy from an outside source for an electron to move to a higher orbit level and enters an excited state (an atom with excess energy).
- When the excited electron moves to a lower energy level or its ground state (lowest possible state), the energy difference is released as a photon of light. The energy of the photon corresponds exactly to the energy change experienced by the emitting atom, which correlates with the colour of light specific to that energy amount.
A crude analogy for this situation might be life in a tower of luxury apartments where the rent is determined by the quality of the view. Such a building has certain, definite numbered levels or floors on which apartments are located. No one can live on floor 5.37 or 22.5. In addition, the rent gets higher as you go up to higher floors. If you want to exchange an apartment on the twentieth floor for one on the second floor, you will not owe as much rent. However, if you want to move from the third floor to the twenty-fifth floor, your rent will increase. In an atom, too, the “cheapest” place for an electron to live is the lowest possible level, and energy is required to move to a higher level.
The photon and wave perspectives must be equivalent: light is light, no matter how we look at it. Thus, each photon carries a certain amount of energy that is proportional to the frequency (f) of the wave it represents. The value of its energy (E) is given by the formula
E=hf
where the constant of proportionality, h, is called Planck’s constant.
The constant is named for Max Planck, who was one of the originators of the quantum theory. If metric units are used (that is, if energy is measured in joules and frequency in hertz), then Planck’s constant has the value h = 6.626 × 10⁻³⁴ joule-seconds (J-s). As mentioned in the previous section, higher-energy photons correspond to higher-frequency waves (which have a shorter wavelengths); lower-energy photons are waves of lower frequency (which have longer wavelengths).
For a summary about the Bohr model of the atom, watch the video The Bohr Atom (6:20)
Video Source: Bozemann Science. (2014, May 6). The Bohr Atom [Video]. YouTube.
The Mathematics and Physics involved in the Evolution of the Bohr Atom
Niels Bohr attempted to resolve the atomic paradox by ignoring classical electromagnetism’s prediction that the orbiting electron in hydrogen would continuously emit light. Instead, he incorporated into the classical mechanics description of the atom, Planck’s ideas of quantization and Albert Einstein’s finding that light consists of photons whose energy is proportional to their frequency. Bohr assumed that the electron orbiting the nucleus would not normally emit any radiation (the stationary state hypothesis), but it would emit or absorb a photon if it moved to a different orbit. The energy absorbed or emitted would reflect differences in the orbital energies according to this equation:
In this equation, h is Planck’s constant and Ei and Ef are the initial and final orbital energies, respectively. The absolute value of the energy difference is used, since frequencies and wavelengths are always positive. Instead of allowing for continuous values for the angular momentum, energy, and orbit radius, Bohr assumed that only discrete values for these could occur (actually, quantizing any one of these would imply that the other two are also quantized). Bohr’s expression for the quantized energies is:
In this expression, k is a constant comprising fundamental constants such as the electron mass and charge and Planck’s constant. Inserting the expression for the orbit energies into the equation for ΔE gives
or
which is identical to the Rydberg equation for [latex]R_{\infty} = \frac{k}{hc}[/latex]. Johannes Rydberg developed an empirical formula that predicted all of hydrogen’s emission lines, not just those restricted to the visible range, where, n1 and n2 are integers, n1 < n2, and R∞ is the Rydberg constant (1.097 × 10⁷ m−1).
When Bohr calculated his theoretical value for the Rydberg constant [latex]R_{\infty}[/latex], and compared it with the experimentally accepted value, he got excellent agreement. Since the Rydberg constant was one of the most precisely measured constants at that time, this level of agreement was astonishing and meant that Bohr’s model was taken seriously, despite the many assumptions that Bohr needed to derive it.
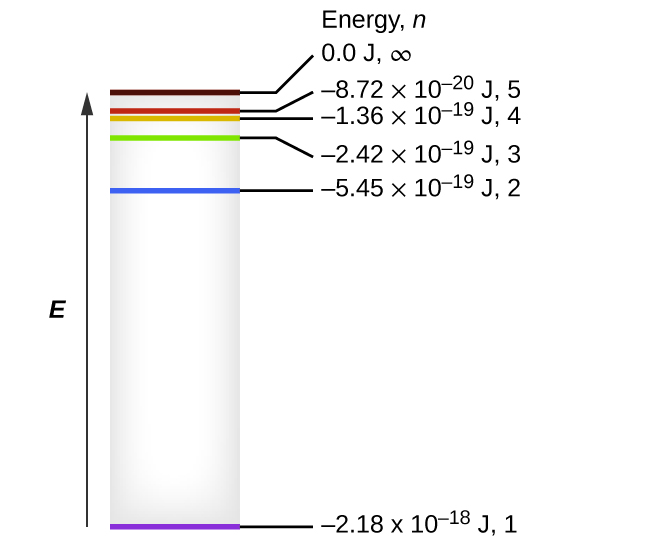
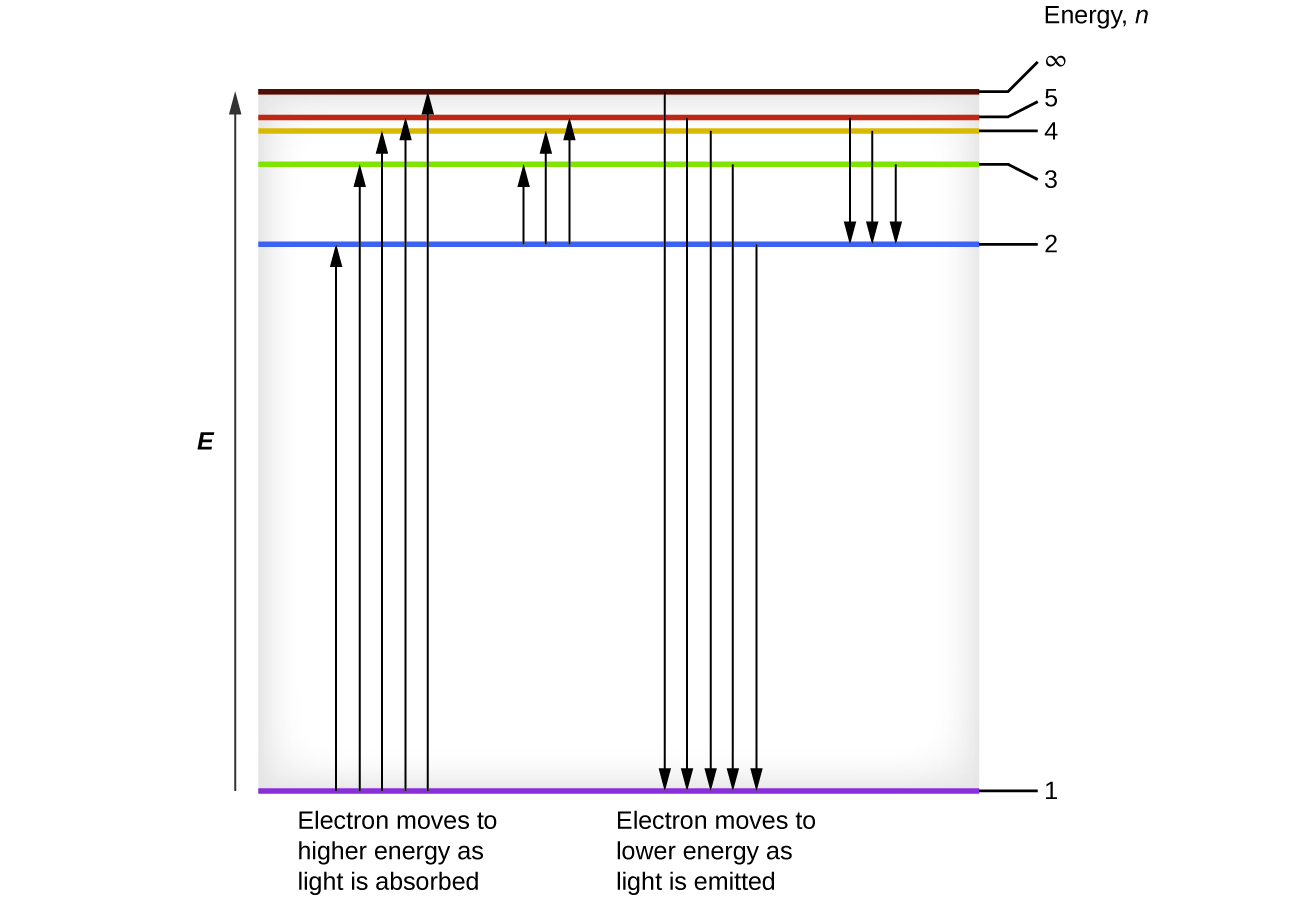
One of the fundamental laws of physics is that matter is most stable with electrons filling the lowest possible energy levels, which are designated by the letter n, where n is a positive integer. The lowest principal energy level is n = 1 and increase in increments of 1 for each successive higher energy level. Thus, the electron in a hydrogen atom usually moves in the n = 1 orbit, the lowest energy orbit and is said to be in its ground electronic state (or simply ground state). If the atom receives energy from an outside source, it is possible for the electron to move to an orbit with a higher n value and the atom is now in an excited electronic state (or simply an excited state) with a higher energy. When an electron transitions from an excited state (higher energy orbit) to a less excited state, or ground state, the difference in energy is emitted as a photon. The lowest few energy levels are shown in Figure 10.2e. We can relate the energy of electrons in atoms to what we learned previously about energy. The law of conservation of energy says that we can neither create nor destroy energy. Thus, if a certain amount of external energy is required to excite an electron from one energy level to another, that same amount of energy will be liberated when the electron returns to its initial state (Figure 10.2f). In effect, an atom can “store” energy by using it to promote an electron to a state with a higher energy and release it when the electron returns to a lower state. The energy can be released as one quantum of energy, as the electron returns to its ground state (say, from n = 5 to n = 1), or it can be released as two or more smaller quanta as the electron falls to an intermediate state, then to the ground state (say, from n = 5 to n = 4, emitting one quantum, then to n = 1, emitting a second quantum).
Since Bohr’s model involved only a single electron, it could also be applied to the single electron ions He+, Li2+, Be3+, and so forth, which differ from hydrogen only in their nuclear charges, and so one-electron atoms and ions are collectively referred to as hydrogen-like atoms. The energy expression for hydrogen-like atoms is a generalization of the hydrogen atom energy, in which Z is the nuclear charge (+1 for hydrogen, +2 for He, +3 for Li, and so on) and k has a value of 2.179 × 10⁻¹⁸ J.
The sizes of the circular orbits for hydrogen-like atoms are given in terms of their radii by the following expression, in which a0 is a constant called the Bohr radius, with a value of 5.292 × 10⁻¹¹ m:
The equation also shows us that as the electron’s energy increases (as n increases), the electron is found at greater distances from the nucleus. This is implied by the inverse dependence on r in the Coulomb potential, since, as the electron moves away from the nucleus, the electrostatic attraction between it and the nucleus decreases, and it is held less tightly in the atom. Note that as n gets larger and the orbits get larger, their energies get closer to zero, and so the limits [latex]n \; \longrightarrow \infty[/latex], and [latex]r \longrightarrow \infty[/latex] imply that E = 0 corresponds to the ionization (energy) limit where the electron is completely removed from the nucleus. Thus, for hydrogen in the ground state n = 1, the ionization energy would be:
With three extremely puzzling paradoxes now solved (blackbody radiation, the photoelectric effect, and the hydrogen atom), and all involving Planck’s constant in a fundamental manner, it became clear to most physicists at that time that the classical theories that worked so well in the macroscopic world were fundamentally flawed and could not be extended down into the microscopic domain of atoms and molecules. Unfortunately, despite Bohr’s remarkable achievement in deriving a theoretical expression for the Rydberg constant, he was unable to extend his theory to the next simplest atom, He, which only has two electrons. Bohr’s model was severely flawed, since it was still based on the classical mechanics notion of precise orbits, a concept that was later found to be untenable in the microscopic domain, when a proper model of quantum mechanics was developed to supersede classical mechanics.
For examples and exercises on applying these equations, visit section 6.2 – the Bohr Model In Chemistry 2e .
Watch Bohr Model of the Hydrogen Atom (4min 49s).
VIDEO SOURCE: Professor Dave Explains. (2015, August 26). Bohr Model of the Hydrogen Atom [Video]. YouTube.
Exercise 10.2a
Check Your Learning Exercise (Text Version)
Part 1 Instructions: Review the scientist name list below. Match each of the nine scientists with their key discovery by filling in the [blank] with the correct scientist’s name.
Scientist Name List (includes 9 names):
James Clerk Maxwell, Ernst Rutherford, Joseph von Fraunhofer, Gustav Kirchhoff, Robert Bunsen, Albert Einstein, Max Planck, Niels Bohr, Johannes Rydberg
Part 1 QUESTIONS:
- [BLANK] accurately measured the wavelengths of solar absorption lines; these lines are named after the scientist who measured them.
- [BLANK] developed an empirical formula that predicted all of hydrogen’s emission lines, not just those restricted to the visible range.
- [BLANK] predicted the existence of electromagnetic waves that travel at the speed of light. His theory also predicted how these waves behave, and how they carry both energy and momentum.
- [BLANK] theorized that electrons can move from one discrete energy level (orbit) to another by absorbing or emitting quantized energy.
- [BLANK] is known as the originator of the quantum theory. Energy is never emitted continuously from an atom, but in small, discrete quantities only. The smallest amount of energy that can be emitted or absorbed in the form of electromagnetic radiation is known as quantum.
- [BLANK] and [BLANK] discovered that for the various chemical elements, the line emission spectrum of an element exactly matches its line absorption spectrum.
- [BLANK] developed the planetary model of the nuclear atom since it pictured the atom as a miniature “solar system” with the electrons orbiting the nucleus (protons and neutrons) like planets orbiting the sun.
- [BLANK] determined that light consists of photons whose energy is proportional to their frequency.
Part 2 Instructions: Read the following statements about the Bohr atom and determine whether the statement is True OR False.
- Bohr suggested that the spectrum of hydrogen can be understood if one assumes that orbits of only certain sizes and specific distances from the atom’s nucleus are possible for the electron to exist in.
- All electrons in an atom spiral into the nucleus of the atom as they lose energy.
- Each element has a unique set of spectral lines that is characteristic of that element.
- Lower energy levels are closer to the nucleus and higher energy levels are farther from the nucleus of an atom.
- For an electron to move from a higher energy level to a lower energy level, it must absorb a discrete amount of energy from an outside source.
- When an atom receives a quantum amount of energy from an outside source, it jumps to a higher orbit level and enters an excited state.
- Matter is least stable when electrons fill the lowest possible energy levels.
- The lowest principal energy level is n = 1 and increase in increments of 1 for each successive higher energy level.
- When an electron transitions from an excited state to its ground state, the difference in energy is emitted as a photon.
Check Your Answer[1]
Source: “Exercise 10.2a” by Jackie MacDonald, licensed under CC BY-NC-SA 4.0
Bohr’s model of the hydrogen atom provides insight into the behaviour of matter at the microscopic level, but it is does not account for electron–electron interactions in atoms with more than one electron. It does introduce several important features of all models used to describe the distribution of electrons in an atom. These features include the following:
- The energies of electrons (energy levels) in an atom are quantized, described by quantum numbers: integer numbers having only specific allowed value and used to characterize the arrangement of electrons in an atom.
- An electron’s energy increases (becomes less stable) with increasing distance from the nucleus.
- The discrete energies (lines) in the spectra of the elements result from quantized electronic energies.
Of these features, the most important is the postulate of quantized energy levels for an electron in an atom. As a consequence, the model laid the foundation for the quantum mechanical model of the atom. Bohr won a Nobel Prize in Physics for his contributions to our understanding of the structure of atoms and how that is related to line spectra emissions.
Attribution & References
- “6.2 The Bohr Model” In Chemistry 2e (Open Stax) by Paul Flowers, Klaus Theopold, Richard Langley & William R. Robinson is licensed under CC BY 4.0. Access for free at Chemistry 2e (Open Stax)
- “Ch. 16 Introduction” in University Physics Volume 2 (Open Stax) by Samuel J. Ling, William Moebs, Jeff Sanny, licensed under CC BY 4.0. Access for free at University Physics Volume 2 (Open Stax)
- “5.4 The Structure of the Atom” in Astromony 2e (Open Stax) by Andrew Fraknoi, David Morrison, Sidney Wolff, licensed under CC BY 4.0. Access for free at Astromony 2e (Open Stax)
- 6.4 Bohr’s Model of the Hydrogen Atom” in University Physics Volume 3 (Open Stax) by Samuel J. Ling, Jeff Sanny, William Moebs, licensed under CC BY 4.0. Access for free at University Physics Volume 3 (Open Stax)
-
- Joseph von Fraunhofer;
- Johannes Rydberg;
- James Clerk Maxwell;
- Niels Boh;
- Max Planck;
- Gustav Kirchhoff and Robert Bunsen;
- Ernst Rutherford;
- Albert Einstein;
- True
- False;
- True;
- True;
- False;
- True;
- False;
- True;
- True
state having an energy greater than the ground-state energy
state in which the electrons in an atom, ion, or molecule have the lowest energy possible
structural model in which an electron moves around the nucleus only in circular orbits, each with a specific allowed radius; the orbiting electron does not normally emit electromagnetic radiation, but does so when changing from one orbit to another.
integer number having only specific allowed values and used to characterize the arrangement of electrons in an atom
