Appendix F | Water Properties
|
Temperature1 |
Density2 |
|
0 |
999.84 |
|
4 |
999.9749 (density maximum) |
|
10 |
999.7027 |
|
15 |
999.1026 |
|
20 |
998.2067 |
|
22 |
997.7730 |
|
25* |
997.0470 |
|
30 |
995.6488 |
|
40 |
992.2152 |
|
60 |
983.20 |
|
80 |
971.79 |
|
99.974 |
958.37 |
Table F.1 Water Density (kg/m3) at Different Temperatures (°C)
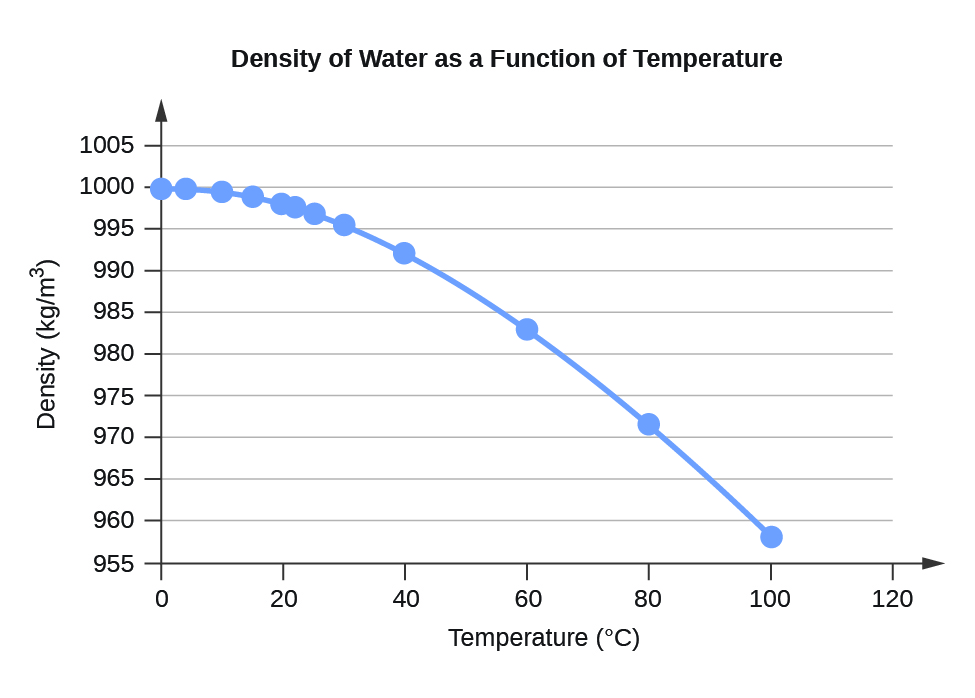
Figure F.1 Density of Water as a Function of Temperature
|
Temperature |
Vapour Pressure (Torr) |
Vapour Pressure (Pa) |
|
-10 |
1.95 |
259.9 |
|
-5 |
3.08 |
401.7 |
|
-2 |
3.88 |
517.7 |
|
0.01 |
4.59 |
611.6 |
|
2 |
5.30 |
706.0 |
|
4 |
6.10 |
813.6 |
|
6 |
7.02 |
935.4 |
|
8 |
8.05 |
1073.0 |
|
10 |
9.21 |
1228.2 |
|
12 |
10.52 |
1402.8 |
|
14 |
11.99 |
1599.0 |
|
15 |
12.79 |
1705.6 |
|
16 |
13.64 |
1818.8 |
|
18 |
15.49 |
2064.7 |
|
19 |
16.48 |
2197.8 |
|
20 |
17.55 |
2339.3 |
|
21 |
18.66 |
2487.7 |
|
22 |
19.84 |
2645.3 |
|
23 |
21.08 |
2810.4 |
|
24 |
22.40 |
2985.8 |
|
25 |
23.78 |
3169.9 |
|
26 |
25.23 |
3363.9 |
|
27 |
26.75 |
3567.0 |
|
28 |
28.38 |
3783.1 |
|
29 |
30.06 |
4007.8 |
|
30 |
31.86 |
4247.0 |
|
35 |
42.20 |
5626.7 |
|
40 |
55.39 |
7384.9 |
|
45 |
71.93 |
9589.8 |
|
50 |
92.65 |
12352 |
|
55 |
118.1 |
15752 |
|
60 |
149.6 |
19946 |
|
65 |
187.7 |
25022 |
|
70 |
234.0 |
31201 |
|
75 |
289.2 |
38563 |
|
80 |
355.6 |
47414 |
|
85 |
433.6 |
57815 |
|
90 |
526.4 |
70182 |
|
95 |
634.0 |
84529 |
|
99 |
733.2 |
97759 |
|
100 |
760.7 |
1.0142 × 10⁵ |
|
101.0 |
787.49 |
1.0499 × 10⁵ |
Table F.2 Water Vapour Pressure at Different Temperatures (°C)
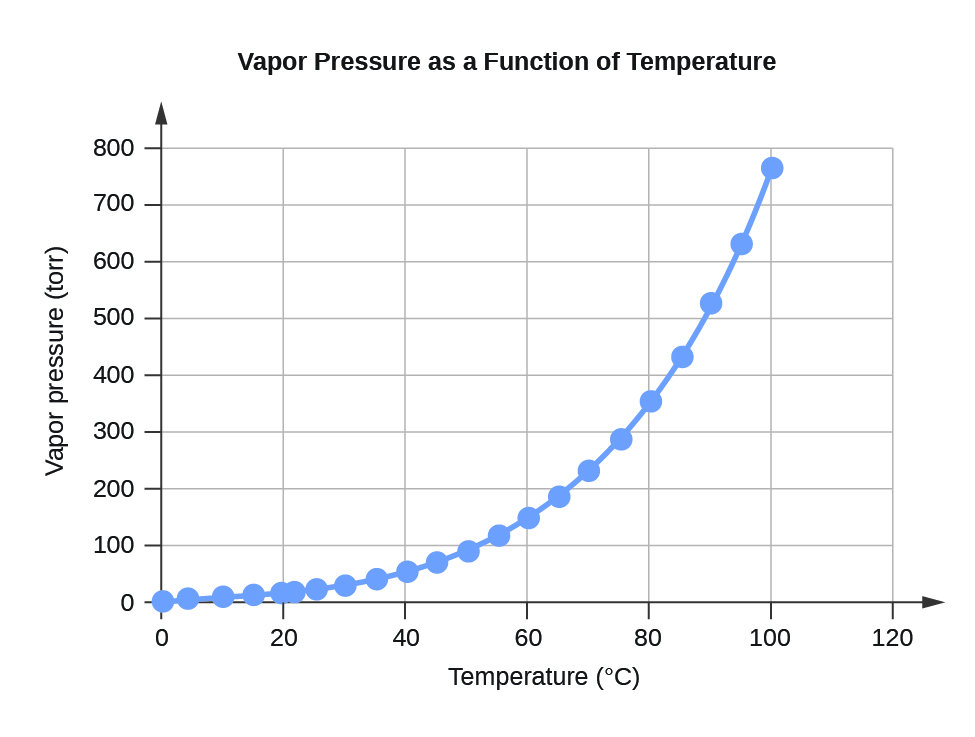
Figure F.2 Vapour Pressure as a Function of Temperature
|
Water KW and pKW at Different Temperatures (°C) |
||
|
Temperature |
KW 10-14 |
pKW 3 |
|
0 |
0.113 |
14.947 |
|
5 |
0.184 |
14.734 |
|
10 |
0.292 |
14.534 |
|
15 |
0.453 |
14.344 |
|
20 |
0.684 |
14.165 |
|
25 |
1.012 |
13.995 |
|
30 |
1.469 |
13.833 |
|
35 |
2.089 |
13.680 |
|
40 |
2.917 |
13.535 |
|
45 |
4.018 |
13.396 |
|
50 |
5.433 |
13.265 |
|
55 |
7.244 |
13.140 |
|
60 |
9.550 |
13.020 |
|
75 |
20.14 |
12.696 |
|
100 |
55.98 |
12.252 |
Table F.3 Water KW and pKW at Different Temperatures (°C)
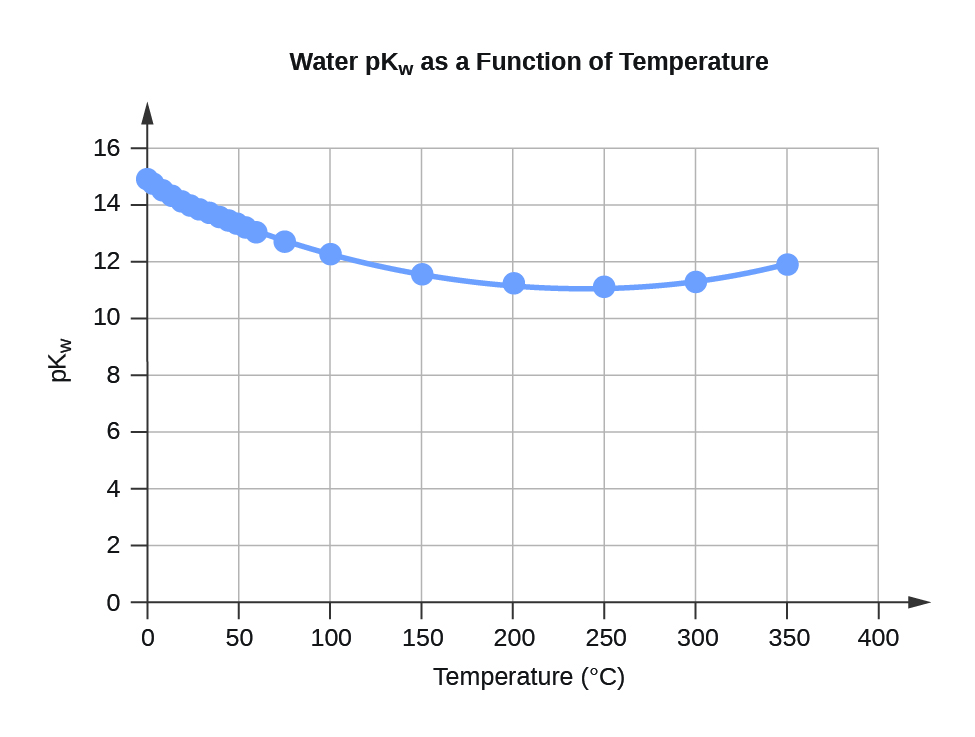 Figure F.3 Water pKW as a Function of Temperature
|
Specific Heat Capacity for Water |
|
c (H2O (l)) = 4.184 J K−1 g−1 |
|
c (H2O (s)) = 2.13 J K−1 g-1 |
|
c (H2O (g)) = 2.01 J K−1 g−1 |
Table F.4 Specific Heat Capacity of Water
|
Standard Water Melting and Boiling Temperatures and Enthalpies of the Transitions |
||
|
|
Temperature (K) |
ΔH (kJ/mol) |
|
melting (ΔHfus) |
273.15 |
6.01 |
|
boiling (ΔHvap) |
373.15 |
40.65 (43.98 at 298 K) |
Table F.5 Standard Water Melting and Boiling Temperatures and Enthalpies of the Transitions
|
Water Cryoscopic (Freezing Point Depression) and Ebullioscopic (Boiling Point Elevation) Constants |
|
Kf = 1.86°C kg mol−1 (cryoscopic constant) |
|
Kb = 0.513°C kg mol−1 (ebullioscopic constant) |
Table F.6 Water Cryoscopic (Freezing Point Depression) and Ebullioscopic (Boiling Point Elevation) Constants
1Data for t < 0 °C are for supercooled water
2For all calculations in the course, unless otherwise noted, assume that the density of water is 1000 kg/m3 = 1.00 g/mL at 25°C
3 pKW = –log10(KW)
REFERENCES
1. “Ionization Constant of Normal and Heavy Water” in CRC Handbook of Chemistry and Physics, 100th Edition (Internet Version 2019), John R. Rumble, ed., CRC Press/Taylor & Francis, Boca Raton, FL.
2. “Standard Density of Water” in CRC Handbook of Chemistry and Physics, 100th Edition (Internet Version 2019), John R. Rumble, ed., CRC Press/Taylor & Francis, Boca Raton, FL.
3. “Vapor Pressure, Enthalpy of Vaporization, and Surface Tension of Water” in CRC Handbook of Chemistry and Physics, 101st Edition (Internet Version 2020), John R. Rumble, ed., CRC Press/Taylor & Francis, Boca Raton, FL.
4. “Vapor Pressure of Water from 0 to 370°C” in CRC Handbook of Chemistry and Physics, 89th Edition (Internet Version 2008), John R. Rumble, ed., CRC Press/Taylor & Francis, Boca Raton, FL.
