7.4 – Reaction Kinetics: Summary
Collision Frequency does not solely determine the rate of the reaction because in order to overcome the activation energy to react, temperature and concentrations will also dictate the rate of the reaction.
The net effect of the addition of a catalyst is the decreasing of the energy barrier to products. The catalyst does so by enabling an alternative mechanism with a lower activation energy.
You learned that the integrated rate law for each common type of reaction (zeroth, first, or second order in a single reactant) can be plotted as a straight line. Using these plots offers an alternative to the methods described for showing how reactant concentration changes with time and determining reaction order.
We will illustrate the use of these graphs by considering the thermal decomposition of NO2 gas at elevated temperatures, which occurs according to the following reaction:
2NO2 (g)Δ → 2NO (g) + O2 (g)
Experimental data for this reaction at 330°C are listed in the table below; they are provided as [NO2], ln[NO2], and 1/[NO2] versus time to correspond to the integrated rate laws for zeroth-, first-, and second-order reactions, respectively. The actual concentrations of NO2 are plotted versus time in part (a) in Figure 7.4.1.
| Time (s) | [NO2] (M) | ln[NO2] | 1/[NO2] (M-1) |
| 0 | 1.00 × 10⁻² | -4.605 | 100 |
| 60 | 6.83 × 10⁻³ | -4.986 | 146 |
| 120 | 5.18 × 10⁻³ | -5.263 | 193 |
| 180 | 4.18 × 10⁻³ | -5.477 | 239 |
| 240 | 3.50 × 10⁻³ | -5.655 | 286 |
| 300 | 3.01 × 10⁻³ | -5.806 | 332 |
| 360 | 2.64 × 10⁻³ | -5.937 | 379 |
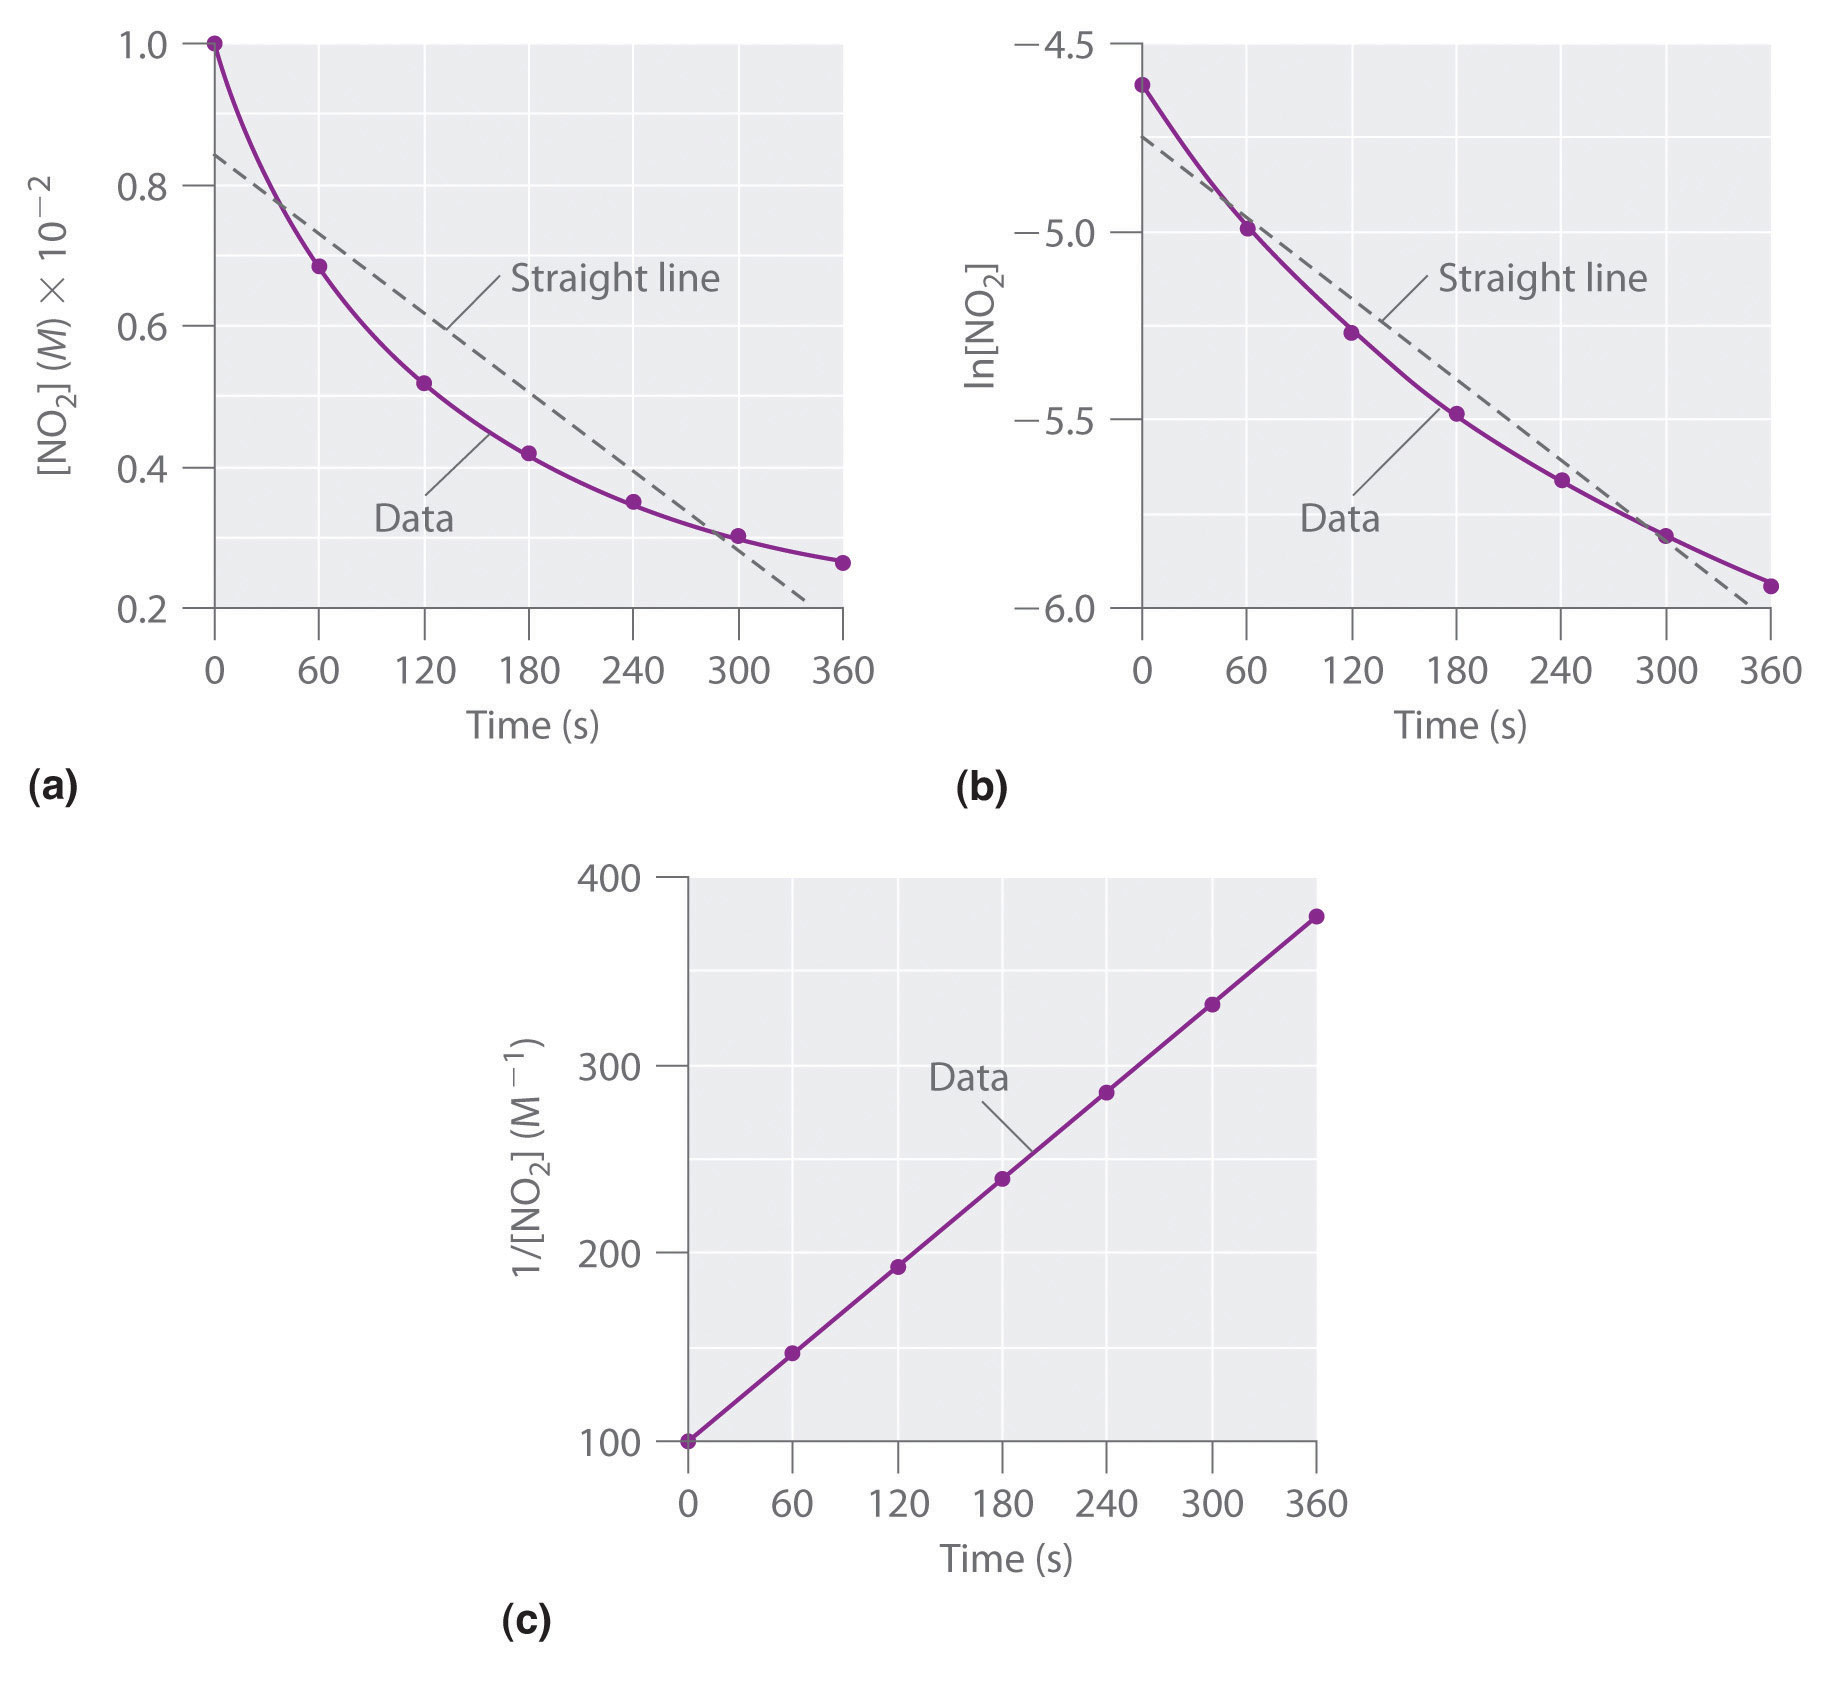
Figure 7.4.1. These plots show the decomposition of a sample of NO2 at 330°C as (a) the concentration of NO2 versus t, (b) the natural logarithm of [NO2] versus t, and (c) 1/[NO2] versus t.
Because the plot of [NO2] versus t is not a straight line, we know the reaction is not zeroth order in NO2. A plot of ln[NO2] versus t (part (b) in Figure 7.4.1) shows us that the reaction is not first order in NO2 because a first-order reaction would give a straight line. Having eliminated zeroth-order and first-order behavior, we construct a plot of 1/[NO2] versus t (part (c) in Figure 7.4.1). This plot is a straight line, indicating that the reaction is second order in NO2.
We have just determined the reaction order using data from a single experiment by plotting the concentration of the reactant as a function of time. Because of the characteristic shapes of the lines shown in Figure 7.4.2, the graphs can be used to determine the reaction order of an unknown reaction. In contrast, the method of initial rates required multiple experiments at different NO2 concentrations as well as accurate initial rates of reaction, which can be difficult to obtain for rapid reactions.
|
Zeroth Order First Order Second Order |
||||||||||||||||||||||||||||||
| Differential Rate = -Δ[A]Δt=k
Rate = -Δ[A]Δt=k [A] Rate = -Δ[A]Δt=k[A]2 rate law |
||||||||||||||||||||||||||||||
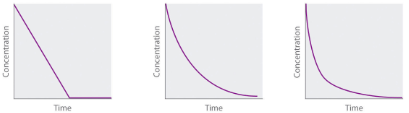
Concentration vs. time |
||||||||||||||||||||||||||||||
| Integrated [A] = [A]0 – kt [A] = [A]0 e-kt1[A] = 1[A]0 + kt
rate law or ln[A] = ln[A]0 – kt |
||||||||||||||||||||||||||||||
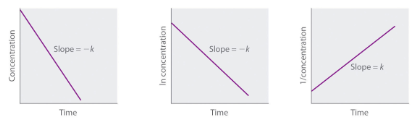
Straight-line plot to determine rate constant |
||||||||||||||||||||||||||||||
Relative rate vs. concentration
|
||||||||||||||||||||||||||||||
| Half-life
t1/2 = [A]02k t1/2 = 0.693k t1/2 = 1k[A]0 |
||||||||||||||||||||||||||||||
| Units of k, M/s 1/s M-1 s-1
rate constant |
||||||||||||||||||||||||||||||
Figure 7.4.2. Properties of reactions that obey zero-, first-, and second-order rate laws.
Example 7.4.1 – Integrated Example – Describing the Reaction Kinetics for a Reaction
Dinitrogen pentoxide (N2O5) decomposes to NO2 and O2 at relatively low temperatures in the following reaction:
2N2O5 (soln) → 4NO2 (soln) + O2 (g)
This reaction is carried out in a CCl4 solution at 45°C. The concentrations of N2O5 as a function of time are listed in the following table, together with the natural logarithms and reciprocal N2O5 concentrations. Plot a graph of the concentration versus t, ln concentration versus t, and 1/concentration versus t and then determine the rate law and calculate the rate constant.
|
Time (s) |
[N2O5] (M) |
ln[N2O5] |
1/[N2O5] (M-1) |
|
0 |
0.0365 |
-3.310 |
27.4 |
|
600 |
0.0274 |
-3.597 |
36.5 |
|
1200 |
0.0206 |
-3.882 |
48.5 |
|
1800 |
0.0157 |
-4.154 |
63.7 |
|
2400 |
0.0117 |
-4.448 |
85.5 |
|
3000 |
0.00860 |
-4.756 |
116 |
|
3600 |
0.00640 |
-5.051 |
156 |
Solution
Here are plots of [N2O5] versus t, ln[N2O5] versus t, and 1/[N2O5] versus t:
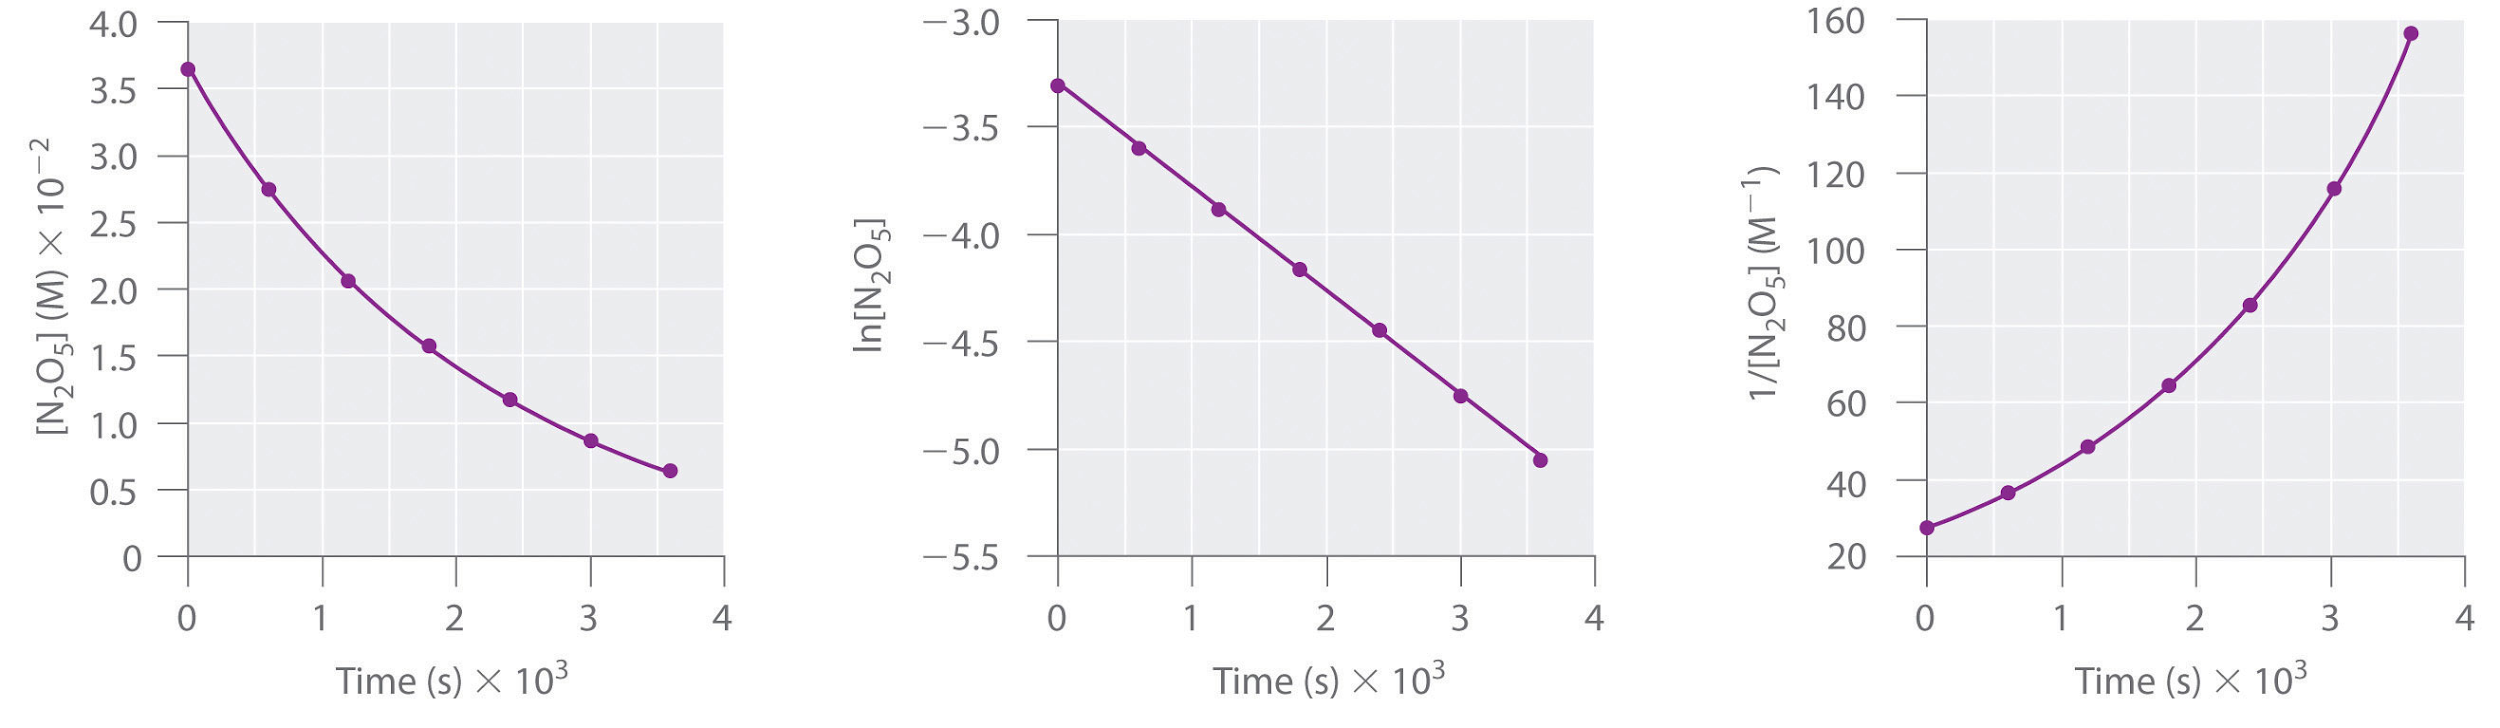
The plot of ln[N2O5] versus t gives a straight line, whereas the plots of [N2O5] versus t and 1/[N2O5] versus t do not. This means that the decomposition of N2O5 is first order in [N2O5].
The rate law for the reaction is therefore
rate = k[N2O5]
Calculating the rate constant is straightforward because we know that the slope of the plot of ln[A] versus t for a first-order reaction is −k. We can calculate the slope using any two points that lie on the line in the plot of ln[N2O5] versus t. Using the points for t = 0 and 3000 s,
Thus k = 4.820 × 10⁻⁴ s−1.
Check Your Learning 7.4.1 – Integrated Example – Describing the Reaction Kinetics for a Reaction
1,3-Butadiene (CH2=CH—CH=CH2; C4H6) is a volatile and reactive organic molecule used in the production of rubber. Above room temperature, it reacts slowly to form products. Concentrations of C4H6 as a function of time at 326°C are listed in the following table along with ln[C4H6] and the reciprocal concentrations. Graph the data as concentration versus t, ln concentration versus t, and 1/concentration versus t. Then determine the reaction order in C4H6, the rate law, and the rate constant for the reaction.
|
Time (s) |
[C4H6] (M) |
ln[C4H6] |
1/[C4H6] (M-1) |
|
0 |
1.72 × 10⁻² |
-4.063 |
58.1 |
|
900 |
1.43 × 10⁻² |
-4.247 |
69.9 |
|
1800 |
1.23 × 10⁻² |
-4.398 |
81.3 |
|
3600 |
9.52 × 10⁻³ |
-4.654 |
105 |
|
6000 |
7.30 × 10⁻³ |
-4.920 |
137 |
Answer
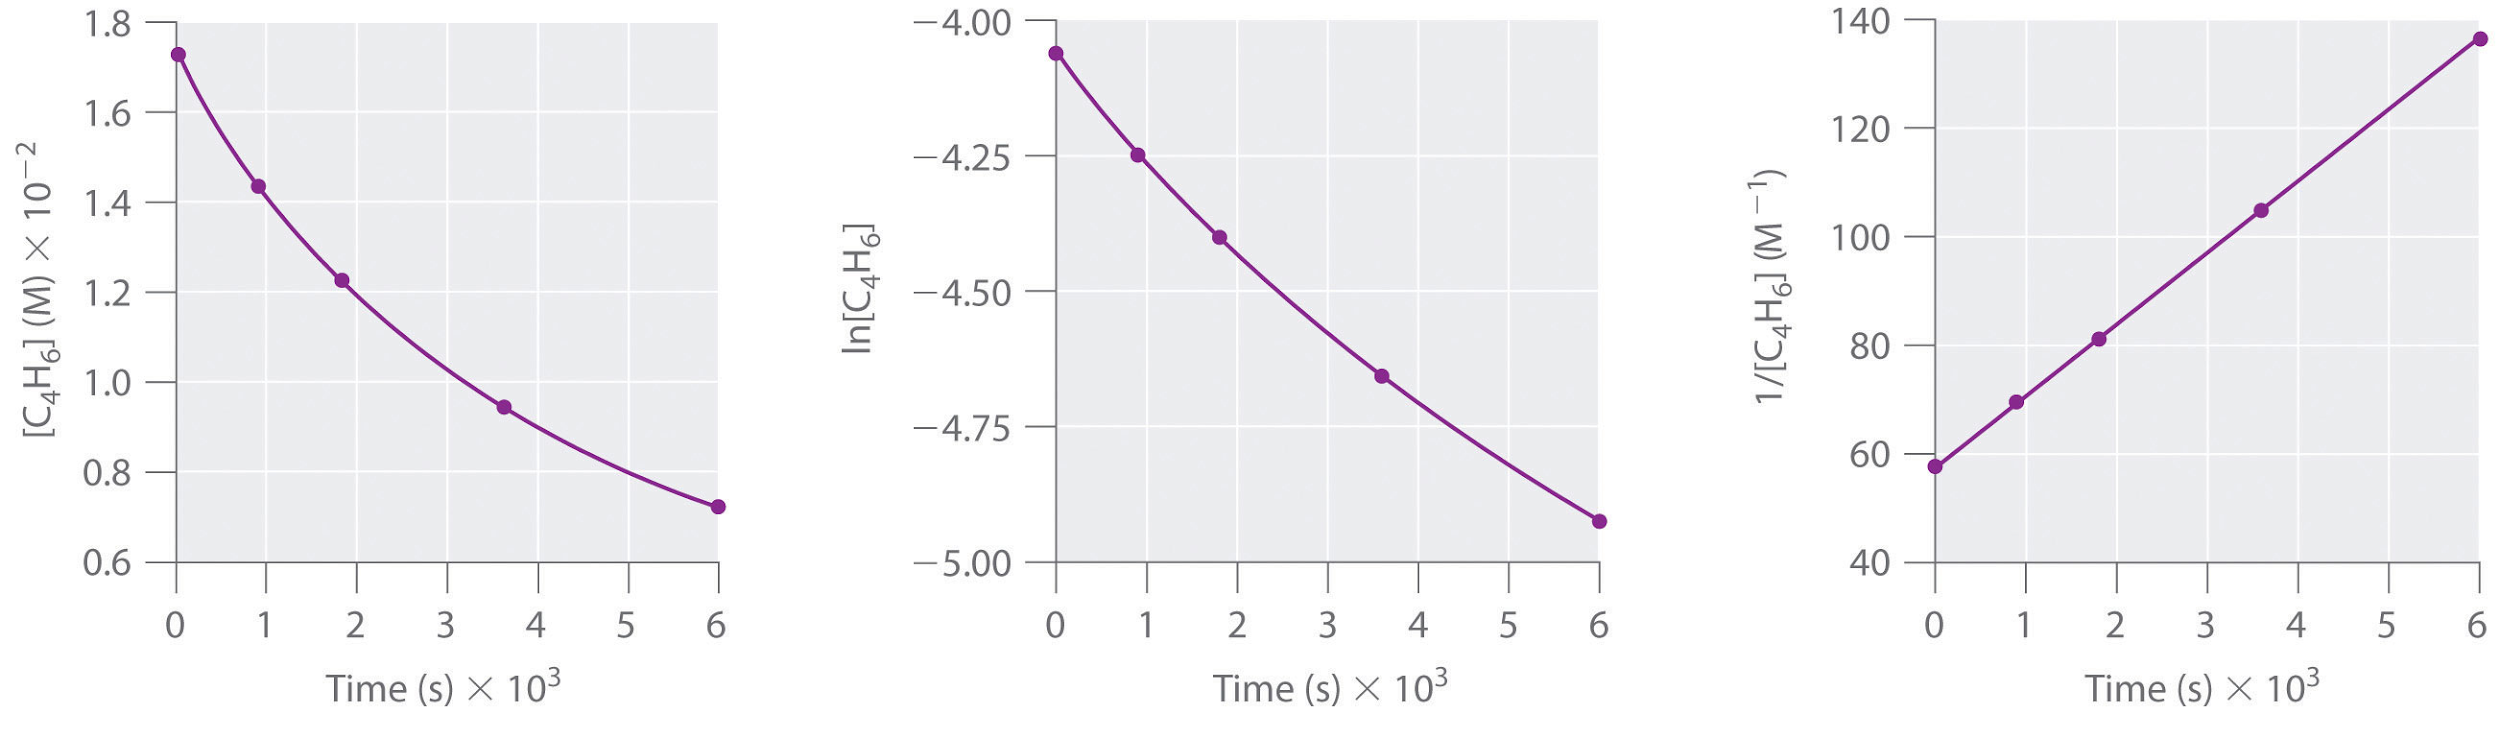
second order in C4H6; rate = k[C4H6]2; k = 1.3 × 10⁻² M−1·s−1
