7.2 – Measuring & Expressing Reaction Rates
The method for determining a reaction rate is relatively straightforward. Since a reaction rate is based on change over time, it must be determined from tabulated values or found experimentally. With the obtained data, it is possible to calculate the reaction rate either algebraically or graphically. What follows is general guidance and examples of measuring the rates of a reaction.
Measuring time change is easy; a stopwatch or any other time device is sufficient. However, determining the change in concentration of the reactants or products involves more complicated processes. The change of concentration in a system can generally be acquired in two ways:
By monitoring the depletion of reactant over time, or
By monitoring the formation of product over time
It does not matter whether an experimenter monitors the reagents or products because there is no effect on the overall reaction. However, since reagents decrease during the reaction, and products increase, there is a sign difference between the two rates. Reagent concentration decreases as the reaction proceeds, giving a negative number for the change in concentration. The products, on the other hand, increase concentration with time, giving a positive number. Graphically, the general shape of the curves of concentration versus time for reactants and products looks like this:
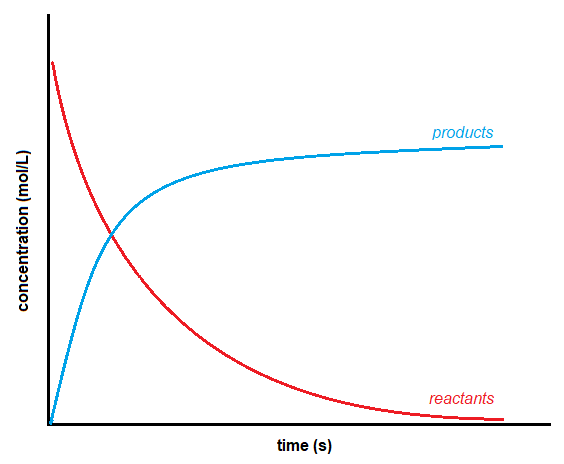
Figure 7.2.1 Concentration vs Time
Since the convention is to express the rate of reaction as a positive number, to solve a problem, set the overall rate of the reaction equal to the negative of a reagent’s disappearing
rate. The overall rate also depends on stoichiometric coefficients.
It is worth noting that the process of measuring the concentration can be greatly simplified by taking advantage of the different physical or chemical properties (ie: phase difference, reduction potential, etc.) of the reagents or products involved in the reaction by using the above methods. We have emphasized the importance of taking the sign of the reaction into account to get a positive reaction rate. Now, we will turn our attention to the importance of stoichiometric coefficients.
A reaction rate can be reported quite differently depending on which product or reagent selected to be monitored. Given a reaction:
the general rate for this reaction is defined as
Equation 7.2.1 General Rate of Reaction
Following the Course of a Reaction
There are two different ways you can follow the course of a reaction.
Samples of the mixture can be collected at intervals and titrated to determine how the concentration of one of the reagents is changing.
A physical property of the reaction which changes as the reaction continues can be measured: for example, the volume of gas produced.
These approaches must be considered separately.
Consider that bromoethane reacts with sodium hydroxide solution as follows:
During the course of the reaction, both bromoethane and sodium hydroxide are consumed. However, it is relatively easy to measure the concentration of sodium hydroxide at any one time by performing a titration with a standard acid: for example, with hydrochloric acid of a known concentration. The process starts with known concentrations of sodium hydroxide and bromoethane, and it is often convenient for them to be equal. Because the reaction is 1:1, if the concentrations are equal at the start, they remain equal throughout the reaction. Samples are taken with a pipette at regular intervals during the reaction and titrated with standard hydrochloric acid in the presence of a suitable indicator.
The problem with this approach is that the reaction is still proceeding in the time required for the titration. In addition, only one titration attempt is possible because, by the time another sample is taken, the concentrations have changed. There are two ways around this problem:
The reaction can be slowed by diluting it, adding the sample to a larger volume of cold water before the titration. Then the titration is performed as quickly as possible. This is most effective if the reaction is carried out above room temperature. Cooling it as well as diluting it slows it down even more.
If possible (and it is possible in this case) it is better to stop the reaction completely before titrating. In this case, this can be accomplished by adding the sample to a known, excess volume of standard hydrochloric acid. This consumes all the sodium hydroxide in the mixture, stopping the reaction.
At this point, the resulting solution is titrated with standard sodium hydroxide solution to determine how much hydrochloric acid is left over in the mixture. This allows one to calculate how much acid was used, and thus how much sodium hydroxide must have been present in the original reaction mixture. This technique is known as back titration.
This process generates a tabulated set of values for the concentration of (in this example) sodium hydroxide over time. The concentrations of bromoethane are, of course, the same as those obtained if the same concentrations of each reagent were used. These values are plotted to give a concentration-time graph, such as that below:
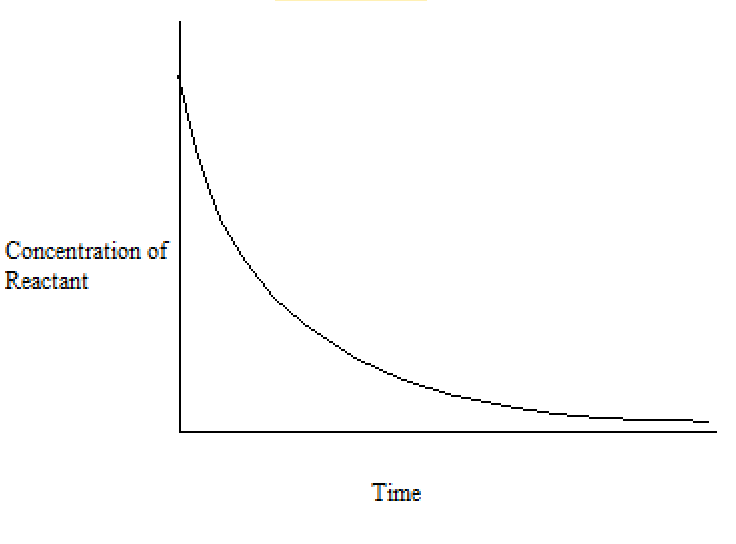
With either the tabulated results or a graph like the one above, we can calculate different types of rates of reaction: average and instantaneous rates of reaction.
Average vs. Instantaneous Reaction Rates
Reaction rates have the general form of (change in concentration/change in time). There are two types of reaction rates(the third method using initial rates will be addressed separately). One is called the average rate of reaction, often denoted by (Δ[conc.] / Δt), while the other is referred to as the instantaneous rate of reaction, denoted as either:
The average rate of reaction, as the name suggests, is an average rate, obtained by taking the change in concentration over a time period, for example: -0.3 M / 15 minutes. This is an approximation of the reaction rate in the interval; it does not necessarily mean that the reaction has this specific rate throughout the time interval or even at any instant during that time. The instantaneous rate of reaction, on the other hand, depicts a more accurate value. The instantaneous rate of reaction is defined as the change in concentration of an infinitely small time interval, expressed as the limit or derivative expression above. In simpler words, it is the rate at which a reaction is proceeding at any specific time.
Consider the analogy of a car slowing down as it approaches a stop sign. The reading on the speedometer at any one specific point in time-call it t1-during the deceleration is an instantaneous rate. As time passes, the instantaneous rate will continue to fall until it reaches zero, when the car (or reaction) stops. Unlike instantaneous speed, the car’s average speed is not indicated by the speedometer; but it can be calculated as the ratio of the distance travelled to the time required to bring the vehicle to a complete stop (Δt). Like the decelerating car, the average rate of a chemical reaction will fall somewhere between its initial and final rates.
Recall the example from the previous section for the breakdown of H2O2 into H2O and O2. If we measure the concentration of hydrogen peroxide, H2O2, in an aqueous solution, we find that it changes slowly over time as the H2O2 decomposes, according to the equation:
The rate at which the hydrogen peroxide decomposes can be expressed in terms of the rate of change of its concentration, as shown here:
Note: There isn’t a ½ in front since we are not looking at the overall rate of the reaction. Here we are specifically looking at the rate of decomposition of H2O2 (aq).
Now imagine that at regular time intervals we experimentally determine the concentration of H2O2 present in the reaction mixture – Figure 7.2.2 below provides an example of data collected during the decomposition of H2O2.
|
Time (h) |
[H2O2] (mol L-1) |
Δ[H2O2] (mol L-1) |
Δt (h) |
Rate of Decomposition (M/h) |
|
0.00 |
1.000 |
-0.500 |
6.00 |
0.0833 |
|
6.00 |
0.500 |
-0.500 ↔ -0.250 |
6.00 |
0.0833 ↔ 0.0417 |
|
12.00 |
0.250 |
-0.250 ↔ -0.125 |
6.00 |
0.0417 ↔ 0.0208 |
|
18.00 |
0.125 |
-0.125 ↔ -0.062 |
6.00 |
0.0208 ↔ 0.0103 |
|
24.00 |
0.0625 |
-0.062 |
6.00 |
0.0103 |
Figure 7.2.2. The rate of decomposition of H2O2 in an aqueous solution decreases as the concentration of H2O2 decreases.
To obtain the tabulated results for this decomposition, the concentration of hydrogen peroxide was measured every 6 hours over the course of a day at a constant temperature of 40°C. Reaction rates were computed for each time interval by dividing the change in concentration by the corresponding time increment, as shown here for the first 6-hour period:
Notice that the reaction rates vary with time, decreasing as the reaction proceeds. Results for the last 6-hour period yield a reaction rate of:
Both calculations above involve determining an average rate of reaction since we look at concentration values at the beginning and end of a time period. Hence, these calculated values are an average rate of reaction over that particular time interval (e.g. the time period between 18.00 h and 24.00 h spanning the last 6 hour time interval).
Graphically, determining an average rate of reaction follows the same principle – a line is drawn between two points on the concentration versus time curve (Figure 7.2.3). These two points represent the two concentration values at two different instants in time. Calculating the slope of this line uses the same formula to calculate an average rate of reaction – Δ[conc.] / Δt.
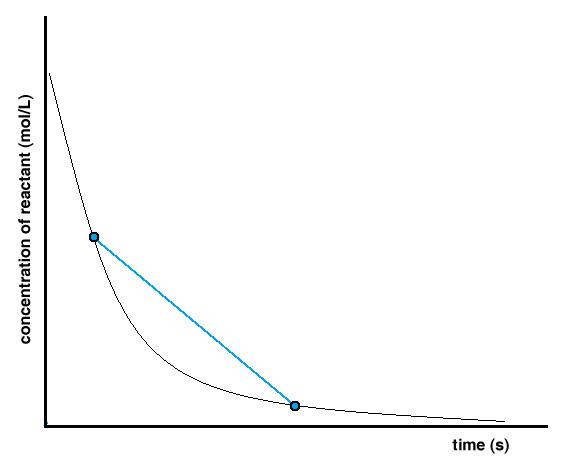
Figure 7.2.3. Determining the average rate of reaction from a concentration versus time graph.
The instantaneous rate of a reaction may be determined in one of two ways. If experimental conditions permit the measurement of concentration changes over very short time intervals, then average rates computed as described earlier provide reasonably good approximations of instantaneous rates. Alternatively, a graphical procedure may be used that, in effect, yields the results that would be obtained if short time interval measurements were possible (Figure 7.2.4). Going back to our example for the decomposition of H2O2, if we plot the concentration of hydrogen peroxide against time, the instantaneous rate of decomposition of H2O2 at any time t is given by the slope of a straight line that is tangent to the curve at that time (Figure 7.2.5). We can use calculus to evaluate the slopes of such tangent lines, but the procedure for doing so is beyond the scope of this chapter.
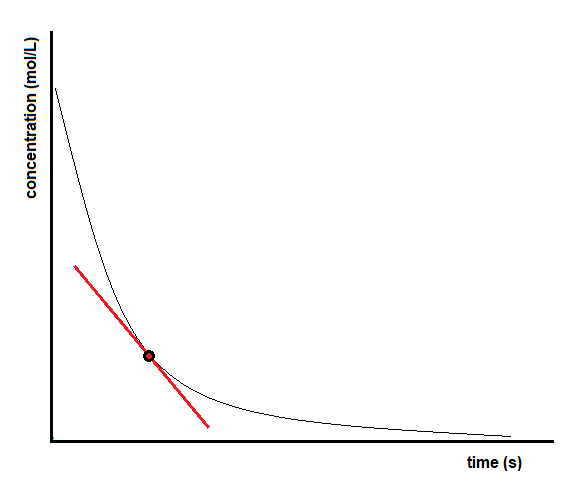
Figure 7.2.4. Determining the instantaneous rate of reaction from a concentration versus time graph.
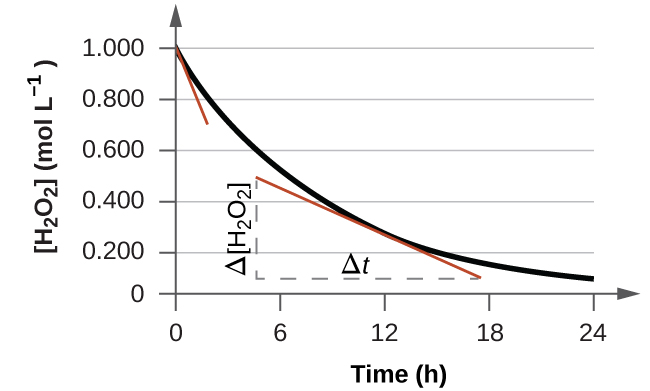
Figure 7.2.5. This graph shows a plot of concentration versus time for a 1.000 M solution of H2O2. The rate at any instant is equal to the slope of a line tangential to this curve at that time. Tangents are shown at t = 0 h (“initial rate”) and at t = 10 h (“instantaneous rate” at that particular time).
Initial Rate of Reaction
The initial rate of reaction is the rate at which the reagents are first brought together. Recall the analogy of a car slowing down as it approaches a stop sign. The vehicle’s initial rate—analogous to the beginning of a chemical reaction—would be the speedometer reading at the moment the driver begins pressing the brakes (t0).
Like the instantaneous rate mentioned above, the initial rate can be obtained either experimentally or graphically. To experimentally determine the initial rate, scientists must bring the reagents together and measure the reaction rate as quickly as possible. If this is not possible, they can find the initial rate graphically. To do this, one must find the slope of the line tangent to the reaction curve when t = 0 (Figure 7.2.6).
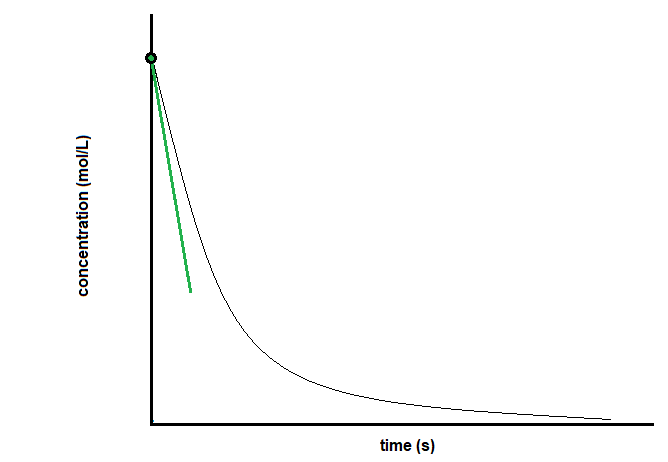
Figure 7.2.6.Determining the initial rate of reaction from a concentration versus time graph.
|
Reaction Rates in Analysis: Test Strips for Urinalysis |
|
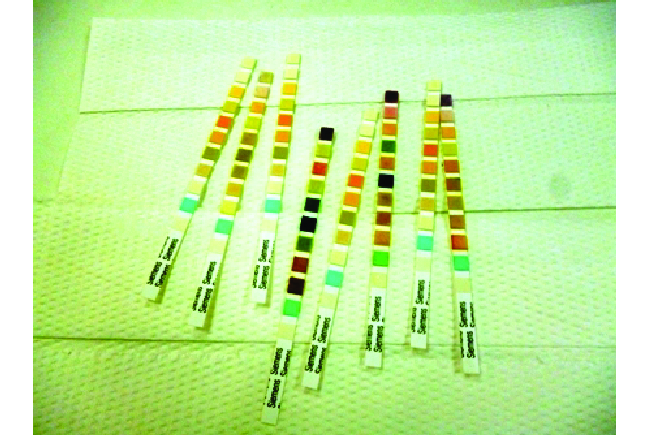
Physicians often use disposable test strips to measure the amounts of various substances in a patient’s urine (Figure 7.2.7). These test strips contain various chemical reagents, embedded in small pads at various locations along the strip, which undergo changes in colour upon exposure to sufficient concentrations of specific substances. The usage instructions for test strips often stress that proper read time is critical for optimal results. This emphasis on read time suggests that kinetic aspects of the chemical reactions occurring on the test strip are important considerations. The test for urinary glucose relies on a two-step process represented by the chemical equations shown here: The first equation depicts the oxidation of glucose in the urine to yield glucolactone and hydrogen peroxide. The hydrogen peroxide produced subsequently oxidizes colourless iodide ion to yield brown iodine, which may be visually detected. Some strips include an additional substance that reacts with iodine to produce a more distinct colour change. The two test reactions shown above are inherently very slow, but their rates are increased by special enzymes embedded in the test strip pad. This is an example of catalysis, a topic discussed later in this chapter. A typical glucose test strip for use with urine requires approximately 30 seconds for the completion of the colour-forming reactions. Reading the result too soon might lead one to conclude that the glucose concentration of the urine sample is lower than it actually is (a false-negative result). Waiting too long to assess the colour change can lead to a false positive due to the slower (not catalyzed) oxidation of iodide ions by other substances found in urine. Figure 7.2.6. Test strips are commonly used to detect the presence of specific substances in a person’s urine. Many test strips have several pads containing various reagents to permit the detection of multiple substances on a single strip. (credit: Iqbal Osman) |
Rate of a chemical reaction computed as the ratio of a measured change in amount or concentration of substance to the time interval over which the change occurred
Rate of a chemical reaction at any instant in time, determined by the slope of the line tangential to a graph of concentration as a function of time
Instantaneous rate of a chemical reaction at t = 0 s (immediately after the reaction has begun)
