6.3 – Acid-Base Reactions & Titrations
In an acid–base titration, a buret is used to deliver measured volumes of an acid or a base solution of known concentration (the titrant) to a flask that contains a solution of a base or an acid, respectively, of unknown concentration (the unknown, or analyte). If the concentration of the titrant is known, then the concentration of the unknown can be determined. The following discussion focuses on the pH changes that occur during an acid–base titration. Plotting the pH of the solution in the flask against the amount of acid or base added produces a titration curve. The shape of the curve provides important information about what is occurring in solution during the titration.
Acid-Base Indicators
Certain organic substances change colour in dilute solution when the hydronium ion concentration reaches a particular value. For example, phenolphthalein is a colourless substance in any aqueous solution with a hydronium ion concentration greater than 5.0 × 10⁻⁹ M (pH < 8.3). In more basic solutions where the hydronium ion concentration is less than 5.0 × 10⁻⁹ M (pH > 8.3), it is red or pink. Substances such as phenolphthalein, which can be used to determine the pH of a solution, are called acid-base indicators. Acid-base indicators are either weak organic acids or weak organic bases.
Let’s use methyl orange as an example of an acid-base indicator. Since this organic molecule is a weak acid, we will represent it using HIn (similar to using “HA” to represent a generic weak acid). Methyl orange, HIn, thus exists in equilibrium in aqueous solution with its ionized form, the conjugate base In–, and we can describe this by the equilibrium constant KIn:
HIn (aq) + H2O (l) ⇌ H3O+ (aq) + In− (aq)
red yellow
KIn = ([H3O+][In–])/[HIn] = 4.0×10⁻⁴
The anion of methyl orange, In−, is yellow, and the unionized form, HIn, is red. When we add acid to a solution of methyl orange, the increased hydronium ion concentration shifts the equilibrium toward the unionized red form, in accordance with Le Châtelier’s principle. If we add base, we shift the equilibrium towards the yellow form. This behavior is completely analogous to the action of buffers.
An indicator’s colour is the visible result of the ratio of the concentrations of the two species In− and HIn. If most of the indicator (typically about 60−90% or more) is present as In−, then we see the colour of the In− ion, which would be yellow for methyl orange. If most is present as HIn, then we see the colour of the HIn molecule: red for methyl orange. For methyl orange, we can rearrange the equation for KIn and write:
[In–]/[HIn] = [substance with yellow colour]/[substance with red colour] = KIn /[H3O+]
This shows us how the ratio of [In-]/[HIn] varies with the concentration of hydronium ion. The above expression describing the indicator equilibrium can be rearranged:
[H3O+]/KIn = [HIn]/[In–]
log([H3O+]/KIn) = log([HIn]/[In–])
log([H3O+])-log(KIn) = -log([In–]/[HIn])
-pH+pKIn = -log([In–]/[HIn])
pH = pKIn + log([In–]/[HIn])
The last formula is the same as the Henderson-Hasselbalch equation, which means this equation can also be applied to describe the equilibrium of indicators.
When [H3O+] has the same numerical value as KIn, the ratio of [In−] to [HIn] is equal to 1, meaning that 50% of the indicator is present in the red form (HIn) and 50% is in the yellow ionic form (In−), and the solution appears orange in colour. When the hydronium ion concentration increases to 8 × 10⁻⁴ M (a pH of 3.1), the solution turns red. No change in colour is visible for any further increase in the hydronium ion concentration (decrease in pH). At a hydronium ion concentration of 4 × 10⁻⁵ M (a pH of 4.4), most of the indicator is in the yellow ionic form, and a further decrease in the hydronium ion concentration (increase in pH) does not produce a visible colour change. The pH range between 3.1 (red) and 4.4 (yellow) is the colour-change interval of methyl orange; the pronounced colour change takes place between these pH values.
Many different substances can be used as indicators, depending on the particular reaction to be monitored. For example, anthocyanins are a class of organic molecules found in fruits, vegetables, cereals, and flowers, and their colour is highly dependent on pH. Their colour gradually changes from red through yellow as the pH changes from 1 to 13 (see Table 6.3.1 below). In all cases, though, a good indicator must have the following properties:
- The colour change must be easily detected.
- The colour change must be rapid.
- The indicator molecule must not react with the substance being titrated.
- To minimize errors, the indicator should have a pKIn that is within one pH unit of the expected pH at the equivalence point of the titration.
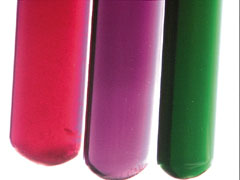
Figure 6.3.1. Aqueous solutions of anthocyanins extracted from petunias.
Table 6.3.1 Colour and pH of Anthocyanins.
| pH | Colour of Anthocyanins |
|
1 |
Red |
|
4 |
Blue-red |
|
6 |
Purple |
|
8 |
Blue |
|
12 |
Green |
|
13 |
Yellow |
Synthetic indicators have been developed that meet these criteria and cover virtually the entire pH range. Figure 6.3.2 shows the approximate pH range over which some common indicators change colour and their change in colour. In addition, some indicators (such as thymol blue) are polyprotic acids or bases, which change colour twice at widely separated pH values.
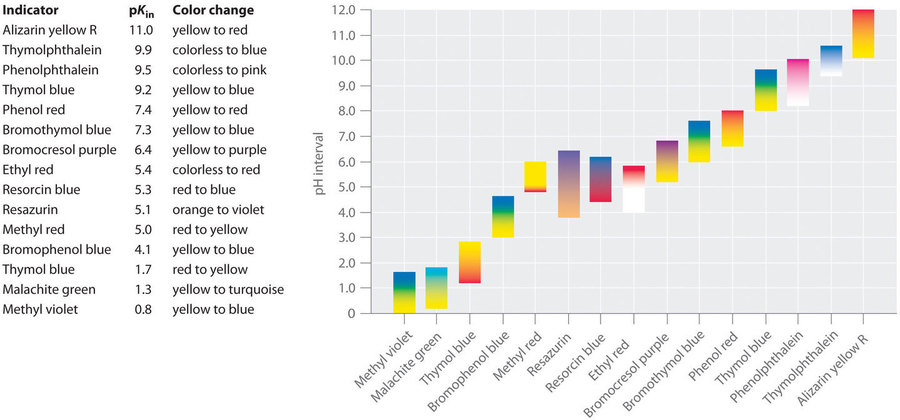
Figure 6.3.2. Some Common Acid–Base Indicators. Approximate colours are shown, along with pKIn values and the pH range over which the colour changes.
It is important to be aware that an indicator does not change colour abruptly at a particular pH value; instead, it actually undergoes a titration just like any other acid or base. As the concentration of HIn decreases and the concentration of In− increases, the colour of the solution slowly changes from the characteristic colour of HIn to that of In−. As we will see later, the [In–]/[HIn] ratio changes from 0.1 at a pH one unit below pKIn to 10 at a pH one unit above pKIn. Thus most indicators change colour over a pH range of about two pH units.
We have stated that a good indicator should have a pKin value that is close to the expected pH at the equivalence point. For a strong acid–strong base titration, the choice of the indicator is not especially critical due to the very large change in pH that occurs around the equivalence point (we will see this more later). In contrast, using the wrong indicator for a titration of a weak acid or a weak base can result in relatively large errors.
The importance of the choice of indicator is illustrated in Figure 6.3.3. This figure shows plots of pH versus volume of base added for two separate titration curves: a 0.100 M solution of NaOH is used to titrate a) 50.0 mL of a 0.100 M solution of a strong acid (HCl) and b) 50.0 mL of a 0.100 M solution of a weak acid (CH3COOH). For both of these titrations, the number of moles of initial acid present is 0.00500 mol (0.100 mol•L–1 x 0.0500 L). The equivalence point of the titration occurs when the amount of added base is equal to the amount of initial acid. Since 0.00500 mol of acid is present in both titrations, in both cases the equivalence point will occur when exactly 50.0 mL of 0.100 M NaOH has been added. Note that, for both titrations, the curves become nearly vertical around 50.0 ml of added NaOH: because we are close to the equivalence point around this volume, each drop of NaOH causes a relatively sharp increase in the solution’s pH.
In the Figure 6.3.3, the pH ranges over which two common indicators (methyl red, pKIn = 5.0, and phenolphthalein, pKIn = 9.5) change colour are also shown. The horizontal bars indicate the pH ranges over which both indicators change colour. Notice that for the HCl titration curve, both of the indicators have pH ranges that lie completely within the vertical portion of the titration curve. Hence both indicators change colour around the equivalence point, when about 50 mL of NaOH has been added. Therefore, both of these indicators could be used in the strong acid titration.
In contrast, the titration of acetic acid will give very different results depending on whether methyl red or phenolphthalein is used as the indicator. Phenolphthalein displays a pH range that lies within the vertical portion of the titration curve. Therefore, the colour change is expected close to the equivalence point and the solution will turn pink when about 50 mL of NaOH has been added. In contrast, methyl red begins to change from red to yellow around pH 5, which is near the midpoint of the acetic acid titration, not the equivalence point. Adding only about 25–30 mL of NaOH will therefore cause the methyl red indicator to change colour, resulting in a huge error.
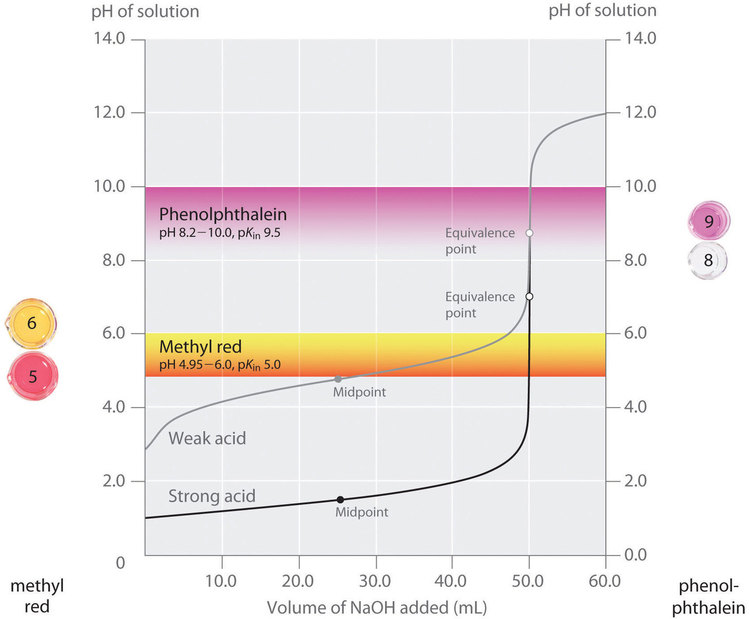
Figure 6.3.3. Choosing the Correct Indicator for an Acid–Base Titration.
Figure 6.3.3 shows the results obtained using two indicators (methyl red and phenolphthalein) for the titration of 0.100 M solutions of a strong acid (HCl) and a weak acid (acetic acid) with 0.100 M NaOH. Due to the steepness of the titration curve of a strong acid around the equivalence point, either indicator will rapidly change colour at the equivalence point for the titration of the strong acid. In contrast, the pKin for methyl red (5.0) is very close to the pKa of acetic acid (4.76); the midpoint of the colour change for methyl red occurs near the midpoint of the titration, rather than at the equivalence point.
|
When is a Titration Finished? When an acid is titrated with a base, there is typically a sudden change in the pH of the solution at the equivalence point (where the amount of titrant added equals the amount of acid originally present). If a few drops of indicator solution have been added, this sharp increase in pH causes an abrupt change in colour, which is called the endpoint of the indicator. The terms endpoint and equivalence point are not interchangeable. The titration is over when the endpoint is reached and the indicator changes colour. This can vary with the indicator used. Where is the endpoint of methyl red in Figure 6.3.3? Of phenolphthalein? How accurate would the results of a titration with a weak acid and methyl red be? With phenolphthalein? Is this an underestimation or an overestimation? |
In general, for titrations of strong acids with strong bases (and vice versa), any indicator with a pKin between about 4.0 and 10.0 will do. For the titration of a weak acid, however, the pH at the equivalence point is greater than 7.0, so an indicator such as phenolphthalein or thymol blue, with pKIn > 7.0, is more appropriate. Conversely, for the titration of a weak base, where the pH at the equivalence point is less than 7.0, an indicator such as methyl red or bromocresol blue, with pKIn < 7.0, should be used.
The existence of many different indicators with different colours and pKIn values also provides a convenient way to estimate the pH of a solution without using an expensive electronic pH meter and a fragile pH electrode. Paper or plastic strips impregnated with combinations of indicators are used as “pH paper,” which allows you to estimate the pH of a solution by simply dipping a piece of pH paper into it and comparing the resulting colour with the standards printed on the container (Figure 6.3.4).
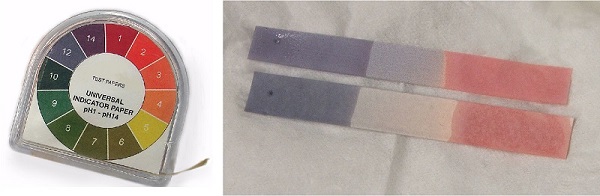
Figure 6.3.4. pH paper. pH paper contains a set of indicators that change colour at different pH values. The approximate pH of a solution can be determined by simply dipping a paper strip into the solution and comparing the colour to the standards provided.
Titrations of Strong Acids and Bases
Figure 6.3.5 (a) shows a plot of the pH as 0.20 M HCl is gradually added to 50.00 mL of pure water. The pH of the sample in the flask is initially 7.00 (as expected for pure water), but it drops very rapidly as HCl is added. Eventually the pH approaches a limit as the concentration of the sample approaches its maximum value (0.20 M HCl). In contrast, Figure 6.3.5 (b) show that when 0.20 M NaOH is added to 50.00 mL of distilled water, the pH (initially 7.00) climbs very rapidly at first but then more gradually, eventually approaching a limit of when the concentration of NaOH approaches its maximum. As you can see from these plots, the pH curve for adding a base is the mirror image of the curve for adding an acid.
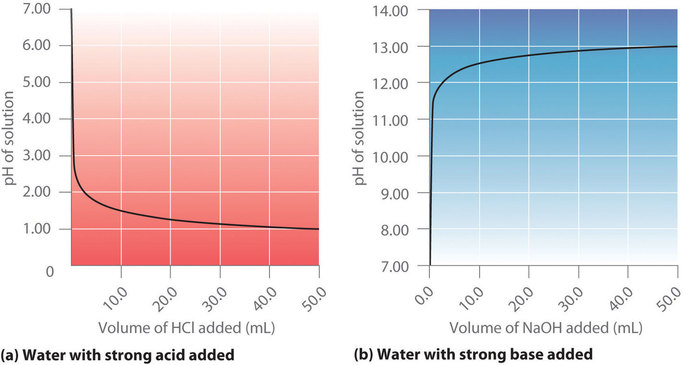
Figure 6.3.5. Solution pH as a function of the volume of a strong acid or a strong base added to distilled water. (a) When 0.20 M HCl is added to 50.0 mL of distilled water, the pH rapidly decreases until it reaches a minimum (the pH of 0.20 M HCl). (b) Conversely, when 0.20 M NaOH is added to 50.0 mL of distilled water, the pH rapidly increases until it reaches a maximum (the pH of 0.20 M NaOH).
Suppose that we now add 0.20 M NaOH to 50.0 mL of a 0.10 M solution of HCl. Figure 6.3.6 (a) shows the pH observed as a function of added NaOH. Because HCl is a strong acid that is completely ionized in water, the initial [H3O+] is 0.10 M, and the initial pH is 1.00. Adding NaOH decreases the concentration of H3O+ because of the neutralization reaction:
OH– (aq) + H3O+ (aq) → 2H2O (l)
Thus, as NaOH is added, the HCl is consumed, and the pH of the solution increases gradually. Near the equivalence point, however, only a small fraction of the HCl initially present now remains, and so the pH increases much more rapidly as each individual drop of NaOH is added. For the titration of a monoprotic strong acid (HCl) with a monobasic strong base (NaOH), we can calculate the volume of base needed to reach the equivalence point from the following relationship:
moles of acid = moles of base
Cacid x Vacid = Cbase x Vbase
In our titration, 50.0 mL of a 0.10 M solution of HCl, is being titrated with 0.20 M NaOH. Therefore, we can solve for Vbase, the volume of base needed to reach the equivalence point:
Vbase= (Cacid x Vacid ) / Cbase = 0.0250 L = 25.0 mL
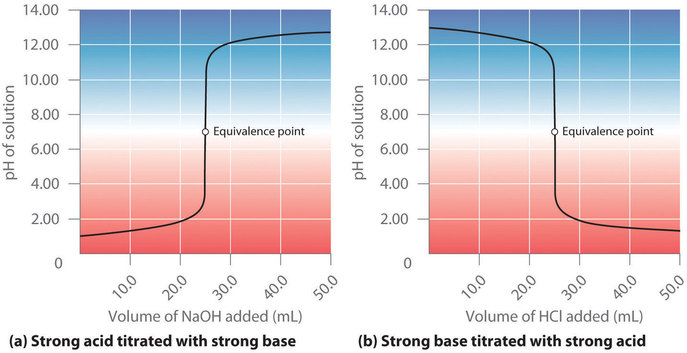
Figure 6.3.6. The titration of (a) a strong acid with a strong base and (b) a strong base with a strong acid. (a) As 0.20 M NaOH is slowly added to 50.0 mL of 0.10 M HCl, the pH increases slowly at first, then increases very rapidly as the equivalence point is approached, and finally increases slowly once more. (b) Conversely, as 0.20 M HCl is slowly added to 50.0 mL of 0.10 M NaOH, the pH decreases slowly at first, then decreases very rapidly as the equivalence point is approached, and finally decreases slowly once more.
At the equivalence point (when 25.0 mL of NaOH solution has been added), the neutralization is complete. Recall from Chapter 5 that all acid-base neutralization reactions follow the general equation:
acid + base → salt + water
In the reaction of HCl + NaOH, the salt produced is NaCl, which does not hydrolyze and is thus a neutral salt. In general, titrations of a strong acid and strong base yield neutral salts, and hence the pH of the solution at the equivalence point is always 7.00. Past the equivalence point, adding more NaOH produces a rapid increase in pH, but eventually the pH levels off at the maximum value, the pH of 0.20 M NaOH.
As shown in Figure 6.3.6 (b), the titration of 50.0 mL of a 0.10 M solution of NaOH with 0.20 M HCl produces a titration curve that is nearly the mirror image of the titration curve in Figure 6.3.6 (a). The pH is initially 13.00, and it slowly decreases as HCl is added. As the equivalence point is approached, the pH drops rapidly before leveling off at a value of about 0.70, the pH of 0.20 M HCl.
In conclusion, titrations of strong acids with strong bases (or vice-versa) produce an S-shaped curve. The curve is not quite perfectly symmetrical because the steady increase in the volume of the solution during the titration causes the solution to become more dilute. Since strong acids and strong bases ionize completely in water, the exact position and shape of the curve only depends on the concentrations of the acid and base used, not their identities. Finally, these titrations always produce neutral salts, and so the aqueous solution obtained at the equivalence point always has a pH of 7.
Example 6.3.1 – Hydrochloric Acid
Calculate the pH of the solution after 24.90 mL of 0.200 M NaOH has been added to 50.00 mL of 0.100 M HCl.
Solution
Calculate the number of millimoles of H3O+ and OH− to determine which, if either, is in excess after the neutralization reaction has occurred. If one species is in excess, calculate the amount that remains after the neutralization reaction.
Because 0.100 mol/L is equivalent to 0.100 mmol/mL, the number of millimoles of H3O+ in 50.00 mL of 0.100 M HCl can be calculated as follows:
(50.00 mL)(0.100 mmol HCl/mL) = 5.00 mmol HCl = 5.00 mmol H3O+
The number of millimoles of NaOH added is as follows:
(24.90 mL)(0.200 mmol NaOH/mL) = 4.98 mmol NaOH = 4.98 mmol OH-
Thus H3O+ is in excess. To completely neutralize the acid requires the addition of 5.00 mmol of OH− to the HCl solution. Because only 4.98 mmol of OH− has been added, the amount of excess H3O+ is:
5.00 mmol − 4.98 mmol = 0.02 mmol of H3O+
Determine the final volume of the solution. Calculate the concentration of the species in excess and convert this value to pH.
The final volume of the solution is 50.00 mL + 24.90 mL = 74.90 mL, so the final concentration of H3O+ is as follows:
[H+] = 0.02 mmol H+/ 74.90 mL= 3×10⁻⁴ M
Hence,
pH ≈ -log[H3O+] = -log(3×10⁻⁴) = 3.5
This is significantly less than the pH of 7.00 for a neutral solution.
Check Your Learning 6.3.1 – Hydrochloric Acid
Calculate the pH of a solution prepared by adding 40.00 mL of 0.237 M HCl to 75.00 mL of a 0.133 M solution of NaOH.
Answer
pH = 11.6
Titrations of Weak Acids and Bases
In contrast to strong acids and bases, the shape of the titration curve for a weak acid or a weak base depends dramatically on the identity of the acid or the base and the corresponding Ka or Kb. As we shall see, the pH also changes much more gradually around the half-equivalence point in the titration of a weak acid or a weak base. As you learned previously, [H3O+] of a solution of a weak acid (HA) is not equal to the concentration of the acid but depends on both its Ka and its concentration. Because only a fraction of a weak acid dissociates, [H3O+] is less than [HA]. Thus the pH of a solution of a weak acid is greater than the pH of a solution of a strong acid of the same concentration. Figure 6.3.7 (a) shows the titration curve for 50.0 mL of a 0.100 M solution of acetic acid with 0.200 M NaOH superimposed on the curve for the titration of 0.100 M HCl shown in part (a) in Figure 6.3.6.
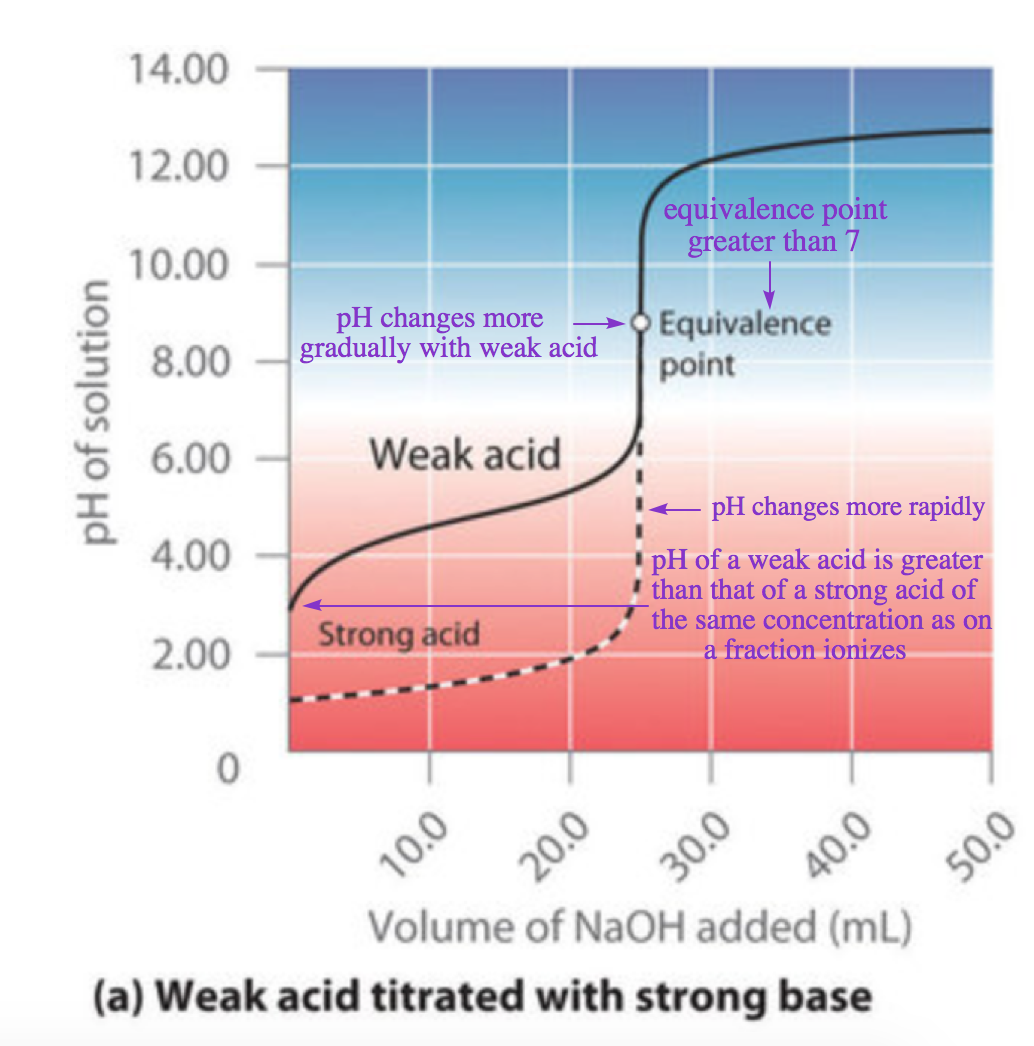
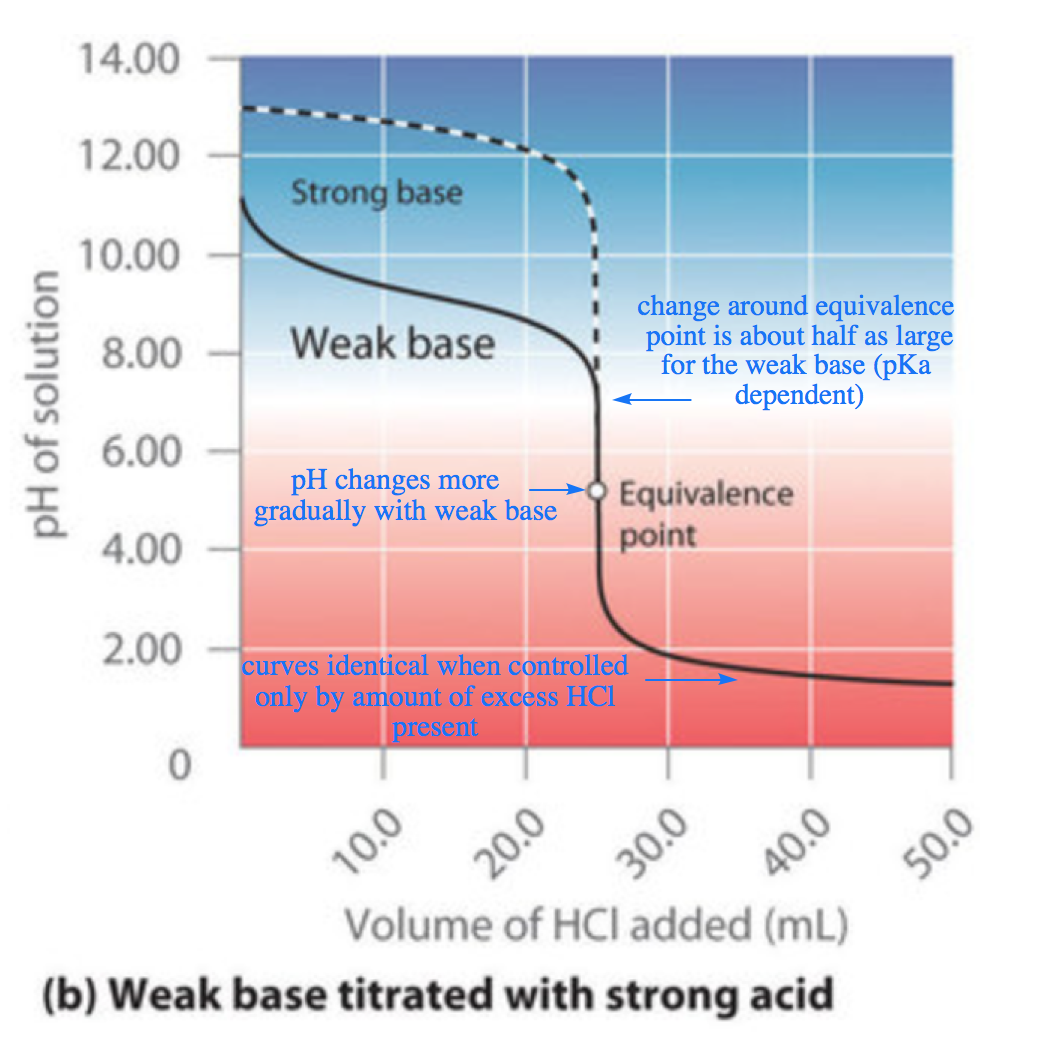
Figure 6.3.7. The titration of (a) a weak acid with a strong Base and (b) a weak base with a strong acid. (a) As 0.200 M NaOH is slowly added to 50.0 mL of 0.100 M acetic acid, the pH increases slowly at first, then increases rapidly as the equivalence point is approached, and then again increases more slowly. The corresponding curve for the titration of 50.0 mL of 0.100 M HCl with 0.200 M NaOH is shown as a dashed line. (b) As 0.200 M HCl is slowly added to 50.0 mL of 0.100 M NH3, the pH decreases slowly at first, then decreases rapidly as the equivalence point is approached, and then again decreases more slowly. The corresponding curve for the titration of 50.0 mL of 0.100 M NaOH with 0.200 M HCl is shown as a dashed line.
Below the equivalence point, the two curves are very different. First, note that before any base is added, the initial pH of the acetic acid solution is greater than the initial pH of the HCl solution – this is because acetic acid is a weak acid and thus does not completely ionize in solution. Second, note that the shape of the curves in between the initial point and the equivalence point have different shapes: for the acetic acid titration, the pH changes more rapidly at first, levels off slightly, and then begins to increase again as we approach the equivalence point. Finally, note also that the pH of the solution at the equivalence point is greater than 7.00, i.e. the solution is basic. Past the equivalence point, however, the two curves are identical: once the acid has been neutralized, the pH of the solution is controlled only by the amount of excess NaOH present, regardless of whether the acid is weak or strong.
Let’s now take a more quantitative look at the construction of titration curves. The curve in Figure 6.3.7 (a) was created by calculating the starting pH of the acetic acid solution before any NaOH is added and then calculating the pH of the solution after adding increasing volumes of NaOH. In the next subsection, we’ll go through these calculations for three points on the curve, using the pKa of acetic acid (4.74 at 25°C).
Calculating the initial pH of a Titration
As discussed previously, if we know Ka or Kb and the initial concentration of a weak acid or a weak base, respectively, we can calculate the pH of a solution of a weak acid or a weak base by setting up a ICE table. In this situation, the initial concentration of acetic acid is 0.100 M. If we define x as [H3O+], then the table of concentrations for the ionization of 0.100 M acetic acid is as follows:
CH3CO2H (aq) + H2O (l) ⇌ H3O+ (aq) + CH3CO2– (aq)
| CH3CO2H (aq) | H2O (l) | H3O+ (aq) | CH3CO2– (aq) | |
| Initial Concentration (M) | 0.100 | / | 0* | 0 |
| Change (M) | – x | / | +x | +x |
| Equilibrium concentration (M) | 0.100-x | / | x | x |
*Note: In this and all subsequent examples, we will ignore any [H3O+] and [OH−] due to the autoionization of water, as these quantities will be negligible.
Inserting the expressions for the final concentrations into the equilibrium equation (and using approximations),
Ka = ([H3O+][CH3CO2-])/[CH3CO2H] = x2/(0.100-x) ≈ x2/0.100 = 1.8×10⁻⁵
Solving this equation gives x = [H3O+] = 1.32 × 10⁻³ M. Thus the pH of a 0.100 M solution of acetic acid is as follows:
pH = -log(1.32×10⁻³) = 2.879
This is the initial pH for our titration curve (i.e. the y-intercept, where the volume of added base is 0 mL).
Calculating the pH during the Titration
Now consider what happens when we add 5.00 mL of 0.200 M NaOH to 50.00 mL of 0.100 M CH3CO2H (still following Figure 6.3.7 (a)). Because the neutralization reaction proceeds to completion, all of the OH− ions added will react with the acetic acid to generate acetate ion and water:
CH3CO2H (aq) + OH– (aq) → CH3CO2– (aq) + H2O (l)
|
Equilibrium Arrows Wondering why the above reaction has a one-way arrow instead of an equilibrium arrow? The above reaction is the reverse of the following: CH3CO2– (aq) + H2O (l) ⇌ CH3CO2H (aq) + OH– (aq) Recall from Chapter 5 that this equation corresponds to the hydrolysis of the conjugate base of acetic acid, and we can determine its equilibrium constant, Kb, as: Kw/Ka = 5.6×10⁻¹⁰. Now recall from Chapter 4 that when an equilibrium is reversed, the value of the equilibrium constant must be the reciprocal value, K’ = 1/K. Therefore, for the original, forward direction: CH3CO2H (aq) + OH− (aq) → CH3CO2− (aq) + H2O (l) K ‘ = 1/5.6×10–10 = 1.8×10⁹ This value is enormous, indicating a strongly product-favoured reaction, and hence we may draw a one-way arrow and use simple stoichiometry to solve our calculations. |
All problems of this type must be solved in two steps: a stoichiometric calculation followed by an equilibrium calculation. In the first step, we use the stoichiometry of the neutralization reaction to calculate the amounts of acid and conjugate base present in solution after the neutralization reaction has occurred. In the second step, we use the equilibrium equation to determine [H3O+] of the resulting solution.
Step 1 – Stoichiometry first
To determine the amount of acid and conjugate base in solution after the neutralization reaction, we calculate the amount of CH3CO2H in the original solution and the amount of OH− in the NaOH solution that was added. The acetic acid solution originally contained:
(50.00mL)(0.100 mmol CH3CO2H/mL) = 5.00 mmol CH3CO2H
The NaOH solution added contained:
(5.00 mL)(0.200 mmol NaOH/mL) = 1.00 mmol NaOH
Comparing these two amounts shows that CH3CO2H is in excess. Because OH− reacts with CH3CO2H in a 1:1 stoichiometry, the amount of excess CH3CO2H is as follows:
mmol CH3CO2H leftover= initial mmol- reacted mmol
5.00 mmol CH3CO2H – 1.00 mmol OH- = 4.00 mmol CH3CO2H
Each 1 mmol of OH− reacts to produce 1 mmol of acetate ion, so the final amount of CH3CO2− is 1.00 mmol.
The stoichiometry of the reaction is summarized in the following table, often referred to as a BAMA table or a stoichiometry table, which shows the numbers of moles of the various species and their resulting changes following a reaction that proceeds 100% to completion:
CH3CO2H (aq) + OH− (aq) → CH3CO2− (aq) + H2O (l)
| CH3CO2H (aq) | OH− (aq) | CH3CO2− (aq) | H2O (l) | |
| Before (mmol) | 5.00 | 0 | / | |
| Addition (mmol) | 1.00 | / | ||
| Modification (mmol) | -1.00 | -1.00 | +1.00 | / |
| After (mmol) | 4.00 | 0 | 1.00 | / |
Note: ICE tables help keep track of changing concentrations or pressures in an equilibrium problem. The above is distinctly not an ICE table, as this is a one-way reaction that goes 100% to products, and thus the calculation is a limiting-reagent type problem.
The BAMA table gives the initial amount of acetate and the final amount of OH− ions as 0. Because an aqueous solution of acetic acid always contains at least a small amount of acetate ion in equilibrium with acetic acid, however, the initial acetate concentration is not actually 0. The value can be ignored in this calculation because the amount of CH3CO2− in equilibrium is insignificant compared to the amount of OH− added. Moreover, due to the autoionization of water, no aqueous solution can contain 0 mmol of OH−, but the amount of OH− due to the autoionization of water is also insignificant compared to the amount of OH− added. We use the initial amounts of the reactants to determine the stoichiometry of the reaction and defer a consideration of the equilibrium until the second half of the problem.
Step 2 – Now turn on the acid-base equilibrium
To calculate [H3O+] at equilibrium following the addition of NaOH, we must first re-calculate [CH3CO2H] and [CH3CO2−] using the number of millimoles of each and the total volume of the solution at this point in the titration:
Total volume = 50.00 mL + 5.00 mL = 55.00 mL
[CH3CO2H] = 4.00 mmol CH3CO2H / 55.00 mL = 7.27×10⁻² M
[CH3CO2–] = 1.00mmol CH3CO2– / 55.00 mL = 1.82×10⁻² M
Knowing the concentrations of acetic acid and acetate ion at equilibrium and Ka for acetic acid (1.74 × 10⁻⁵), we can calculate [H3O+] at equilibrium: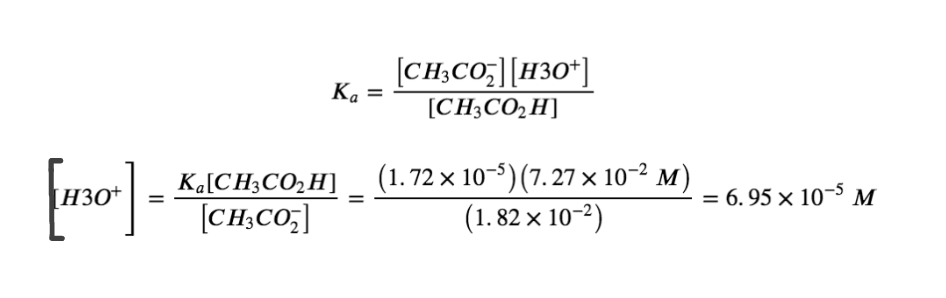
Calculating −log[H3O+] gives:
pH = -log(6.95×10⁻⁵) = 4.158
Comparing the titration curves for HCl and acetic acid in Figure 6.3.7 (a), we see that adding the same amount (5.00 mL) of 0.200 M NaOH to 50 mL of a 0.100 M solution of both acids causes a much smaller pH change for HCl (from 1.00 to 1.14) than for acetic acid (2.88 to 4.16). This is consistent with the qualitative description of the shapes of the titration curves at the beginning of this section. Let’s now repeat the above process for another point in the titration curve of acetic acid.
Example 6.3.2 – Calculating the pH at the Equivalence Point of the Titration
What is the pH of the solution after 25.00 mL of 0.200 M NaOH is added to 50.00 mL of 0.100 M acetic acid?
Solution
Ignoring the spectator ion (Na+), the equation for the neutralization is still:
CH3CO2H (aq) + OH− (aq) → CH3CO2− (aq) + H2O (l)
The number of millimoles of OH− added after 25.00 mL is:
(25.00 mL)(0.200 mmol OH–/mL) = 5.00 mmol OH–
Since the titration began with exactly 5.00 mmol of CH3CO2H, the number of millimoles of OH− added equals the number of millimoles of CH3CO2H, neither species is present in excess, and thus we have reached the equivalence point. Again, the results of the neutralization reaction can be summarized in a BAMA (stoichiometry) table:
CH3CO2H (aq) + OH−(aq) → CH3CO2− (aq) + H2O (l)
| CH3CO2H (aq) | OH− (aq) | CH3CO2− (aq) | H2O (l) | |
| Before (mmol) | 5.00 | 0 | / | |
| Addition (mmol) | 5.00 | / | ||
| Modification (mmol) | -5.00 | -5.00 | +5.00 | / |
| After (mmol) | 0 | 0 | 5.00 | / |
At the equivalence point, all 5.00 millimoles of CH3CO2H have been converted into its conjugate base, CH3CO2–; however, the new total volume of the solution is 75.00 mL (50.00 + 25.00 mL), and so its concentration is:
[CH3CO2−] = 5.00 mmol CH3CO2− / (50.00+25.00) mL = 6.67×10⁻² M
What is the pH of this solution of acetate? Acetate is a base, and thus will hydrolyze in solution to reform some acetic acid, in the equilibrium:
CH3CO2− (aq) + H2O (l) ⇌ CH3CO2H (aq) + OH− (aq)
Therefore, we must consider the reaction of the conjugate base with water to calculate [H3O+] at equilibrium and thus the final pH of the solution, using an ICE table:
CH3CO2− (aq) + H2O (l) ⇌ CH3CO2H (aq) + OH− (aq)
| CH3CO2− (aq) | H2O (l) | CH3CO2H (aq) | OH− (aq) | |
| Initial (M) | 0.0667 | / | 0 | 0 |
| Change (M) | –x | / | +x | +x |
| Equilibrium (M) | 0.667 – x | / | x | x |
Substituting the values from this table into the Kb equation:
Kb = Kw/Ka = (1.01×10⁻¹⁴)/(1.74×10-5) = 5.80×10-10 = x2/0.0667
5.80×10-10 = x2/0.0667-x
5.80×10-10 = x2/0.0667
x = 6.22 × 10⁻⁶
Thus, at equilibrium, [OH−] = 6.22 × 10⁻⁶ M, and the pH of the final solution is 8.794 (Figure 6.3.7 (a)). As expected for the titration of a weak acid, the pH at the equivalence point is greater than 7.00 because the product of the titration is a base, the acetate ion, which then hydrolyzes to produce OH−.
Check Your Learning 6.3.2 – Calculating the pH at the Equivalence Point of the Titration
125.0 mL of a 0.150 M solution of ammonia is titrated with 45.0 mL of a 0.213 M HCl solution. (a) Is this titration before, past, or at the equivalence point? (b) Calculate the pH of the solution. The pKb of ammonia is 4.75 at 25°C.
Answer
(a) Before the equivalence point; (b) pH = 9.23
As shown in Figure 6.3.7 (b), the titration curve for NH3, a weak base, is the reverse of the titration curve for acetic acid. In particular, note the pH at the equivalence point in the titration of a weak base is less than 7.00 because the titration produces an acid.
As we saw previously, the titration curves of strong acids and strong bases are nearly symmetrical S-shaped curves, where only the concentration, but not the identity, of the species is relevant. However, in titrations of weak acids or weak bases, identity of the weak acid or weak base being titrated strongly affects the shape of the titration curve. As the acid or the base being titrated becomes weaker (its pKa or pKb becomes larger), the pH change around the equivalence point decreases significantly. With very dilute solutions, the curve becomes so shallow that it can no longer be used to determine the equivalence point.
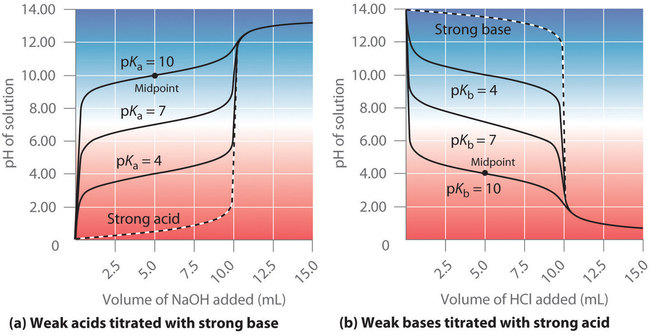
Figure 6.3.8. Effect of acid or base strength on the shape of titration curves. Unlike strong acids or bases, the shape of the titration curve for a weak acid or base depends on the pKa or pKb of the weak acid or base being titrated. (a) Solution pH as a function of the volume of 1.00 M NaOH added to 10.00 mL of 1.00 M solutions of weak acids with the indicated pKa values. (b) Solution pH as a function of the volume of 1.00 M HCl added to 10.00 mL of 1.00 M solutions of weak bases with the indicated pKb values. Midpoints are indicated for the titration curves corresponding to pKa = 10 and pKb = 10.
One point in the titration of a weak acid or a weak base is particularly important: the midpoint (or half-equivalence point) of a titration is defined as the point at which exactly enough acid (or base) has been added to neutralize one-half of the acid (or the base) originally present and occurs halfway to the equivalence point. The midpoint is indicated in Figure 6.3.8 for the two shallowest curves. By definition, at the midpoint of the titration of an acid, [HA] = [A−]. Recall that the ionization constant for a weak acid is as follows:
Ka = ([H3O+][A–])/[HA]
Equation 6.3.1 Ionization Constant for Weak Acid
If [HA] = [A−], this reduces to Ka = [H3O+]. Taking the negative logarithm of both sides,
-log(Ka) = -log[H3O+]
From the definitions of pKa and pH, we see that this is identical to
pKa = pH
Thus the pH at the midpoint of the titration of a weak acid is equal to the pKa of the weak acid. In Figure 6.3.8 (a), we can see that the midpoint for the pKa = 10 weak acid occurs at pH = 10. Titration methods can therefore be used to determine both the concentration and the pKa (or the pKb) of a weak acid (or a weak base).
Titrations of Polyprotic Acids or Bases
When a strong base is added to a solution of a polyprotic acid, the neutralization reaction occurs in stages. The most acidic proton is titrated first, followed by the next most acidic, and so forth. If the pKa values are separated by at least three pH units, then the overall titration curve shows well-resolved “steps” corresponding to the titration of each proton. For example, the titration of the triprotic acid H3PO4 with NaOH is illustrated in Figure 6.3.9 and shows two well-defined steps: the first midpoint corresponds to pKa1, and the second midpoint corresponds to pKa2. Because HPO42− is a very weak acid, pKa3 has such a high value that the third step cannot be resolved using 0.100 M NaOH as the titrant.
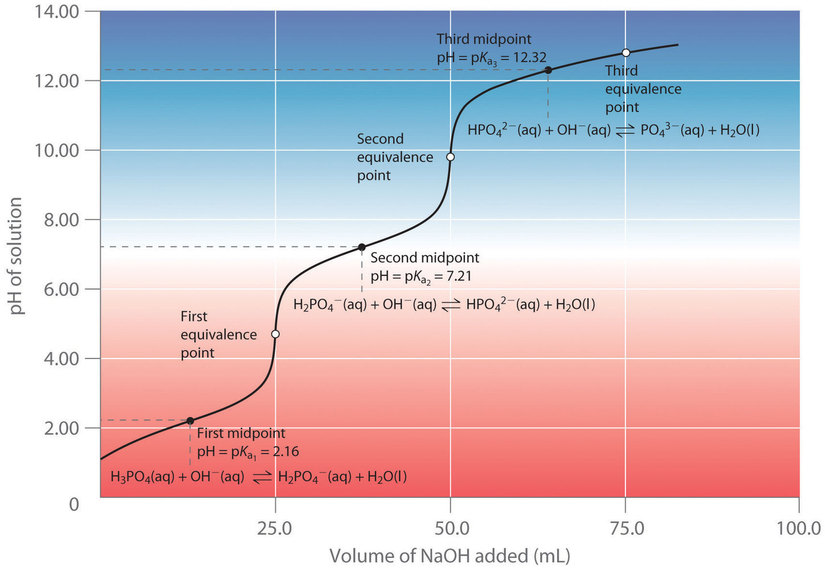
Figure 6.3.9. Titration curve for phosphoric acid (H3PO4), a typical polyprotic acid. The curve for the titration of 25.0 mL of a 0.100 M H3PO4 solution with 0.100 M NaOH along with the species in solution at each pKa is shown. Note the two distinct equivalence points corresponding to deprotonation of H3PO4 at pH ≈ 4.6 and H2PO42− at pH ≈ 9.8. Because HPO42− is a very weak acid, the third equivalence point, at pH ≈ 13, is not well defined.
The titration curve for the reaction of a polyprotic base with a strong acid is the mirror image of the curve shown in Figure 6.3.9. The initial pH is high, but as acid is added, the pH decreases in steps if the successive pKb values are well separated.
Diprotic Acid Titration
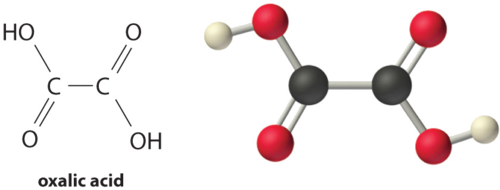
Calculate the pH of a solution prepared by adding 55.0 mL of a 0.120 M NaOH solution to 100.0 mL of a 0.0510 M solution of oxalic acid (HO2CCO2H), a diprotic acid (abbreviated as H2A). Oxalic acid, the simplest dicarboxylic acid, is found in rhubarb and many other plants. Rhubarb leaves are toxic because they contain the calcium salt of the fully deprotonated form of oxalic acid, the oxalate ion (−O2CCO2−, abbreviated A2−). Oxalate salts are toxic for two reasons. First, oxalate salts of divalent cations such as Ca2+ are insoluble at neutral pH but soluble at low pH. As a result, calcium oxalate dissolves in the dilute acid of the stomach, allowing oxalate to be absorbed and transported into cells, where it can react with calcium to form tiny calcium oxalate crystals that damage tissues. Second, oxalate forms stable complexes with metal ions, which can alter the distribution of metal ions in biological fluids.
The pKa values of oxalic acid are 1.25 and 3.81. We proceed by determining the millimoles of acid and base initially present:
(100.00 mL)(0.510 mmol H2A / mL) = 5.10 mmol H2A
(55.00 mL)(0.120 mmol NaOH / mL) = 6.60 mmol NaOH
The strongest acid (H2A) reacts with the base first. This leaves (6.60 − 5.10) = 1.50 mmol of OH− to react with HA−, forming A2− and H2O. The reactions can be written as follows:
H2A + OH− → HA− + H2O
HA− + OH− → A2- + H2O
Shown as two sequential stoichiometry tables:
| H2A | OH− | HA− | H2O | |
| Before (mmol) | 5.10 | 0 | / | |
| Addition (mmol) | 6.60 | / | ||
| Modification (mmol) | -5.10 | -5.10 | +5.10 | / |
| After (mmol) | 0 | 1.50 | 5.10 | / |
| HA− | OH− | A2- | H2O | |
| Before (mmol) | 5.10 | 0 | / | |
| Addition (mmol) | 1.50 | / | ||
| Modification (mmol) | -1.50 | -1.50 | +1.50 | / |
| After (mmol) | 3.60 | 0 | 1.50 | / |
The equilibrium between the weak acid (HA−) and its conjugate base (A2−) in the final solution is determined by the magnitude of the second ionization constant, Ka2 = 10−3.81 = 1.6 × 10⁻⁴. To calculate the pH of the solution, we need to know [H3O+], which is determined by first finding concentrations of each species:
Final volume of solution = 100.0 mL + 55.0 mL = 155.0 mL
[HA–] = 3.60 mmol HA– / 155.0 mL = 2.32×10⁻² M
[A2-] = 1.50 mmol / 155.0 mL = 9.68×10⁻³ M
We can now calculate [H3O+] at equilibrium using the Ka2 expression:
Ka2 = ([A2-][H3O+])/[HA–]
Rearranging this equation and substituting the values for the concentrations of HA− and A2−,
[H3O+] = Ka2([HA–]/[A2-]) = (1.6×10⁻⁴)((2.32×10⁻²)/(9.68×10-3)) = 3.7×10⁻⁴ M
So:
pH = -log[H3O+] = -log(3.7×10⁻⁴) = 3.43
This answer makes chemical sense because the pH is between the first and second pKa values of oxalic acid, as it must be. We added enough hydroxide ion to completely titrate the first, more acidic proton (which should give us a pH greater than pKa1), but we added only enough to titrate less than half of the second, less acidic proton, with pKa2. If we had added exactly enough hydroxide to completely titrate the first proton plus half of the second, we would be at the midpoint of the second step in the titration, and the pH would be 3.81, equal to pKa2.
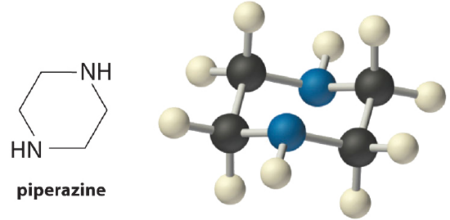
Check Your Learning 6.3.3 – Piperazine
Piperazine is a diprotic base used to control intestinal parasites (“worms”) in pets and humans. A dog is given 500 mg (5.80 mmol) of piperazine (pKb1 = 4.27, pKb2 = 8.67). If the dog’s stomach initially contains 100 mL of 0.10 M HCl (pH = 1.00), calculate the pH of the stomach contents after ingestion of the piperazine.
Answer
pH = 4.9
|
|
|
Purpose This experiment involves performing titration procedures, like you may have done in high school, to determine the concentration of an unknown diprotic acid solution. The procedure involves three parts: 1) preparing a dilution from a concentrated NaOH solution, 2) determining the concentration of the diluted NaOH solution by standardizing it against a monoprotic acid solution of known concentration, and 3) titrating the unknown diprotic acid solution by volumetric titration using your standardized base solution. Principles Acidity/basicity Concentration Equivalence point, endpoint Mass percent Safety Precautions Wear appropriate personal protective equipment (PPE) at all times in the laboratory setting – this includes your lab coat and safety goggles/glasses. Be sure to consult the MSDS for NaOH(aq), HCl(aq), and maleic acid for relevant health and safety, first aid, handling, and waste disposal information. You’ll be working with acids and bases in the lab. The base stock solution you’ll be working with is concentrated, so be extra careful when handling it since it is very corrosive. Note that even when diluted, acids and bases are still corrosive and should be handled with caution. In case of contact with skin or clothing, notify your TA and make sure you rinse thoroughly with water for at least 15 minutes. If you happen to spill an acid or base, make sure you clean it up immediately since it can easily be mistaken for water (given that both are colourless). Things to Consider The observations taken in this experiment are quantitative in nature and ultimately dictate how accurately you’ll determine the concentration of your unknown acid. Ensure that you are as precise and accurate as possible when reading measurements; one example is reading the buret to two decimal places to try to get exact initial and final readings and minimize error. Why is it so important to ensure that there are no air bubbles trapped in the tap of the buret when conducting the titration procedure? Consider the whole purpose of diluting and standardizing the NaOH solution before performing the actual titration on the unknown acid solution. Why was it particularly important to determine the concentration of the dilute base solution before using it? Be sure you can understand and explain the titration curves of both monoprotic and diprotic acids – this will help you when discussing your results in your report. Reference Venkateswaran, R. General Chemistry – Laboratory Manual – CHM 1301/1311. |
 CHM1311 Laboratory | Experiment #4: Acid-Base Titrations
Precisely calibrated volumetric delivery tube used for the precise delivery of variable liquid volumes, such as in a titration analysis
Solution containing a known concentration of substance that will react with the analyte in a titration analysis
Chemical species of interest of unknown concentration
Plot of some sample property (such as pH) versus volume of added titrant
Weak acid or base whose conjugate partner imparts a different solution color; color change indicates the equivalence point of a titration; used in visual assessments of solution pH
Range in pH over which the color change of an indicator is observed
Volume of titrant solution required to react completely with the analyte in a titration analysis; provides a stoichiometric amount of titrant for the sample’s analyte according to the titration reaction
Measured volume of titrant solution that yields the change in sample solution appearance (e.g. colour change) or other property expected for stoichiometric equivalence
Point at which exactly enough acid (or base) has been added to neutralize one-half of the acid (or the base) originally present; occurs halfway to the equivalence point
