Exercises 3.2
1. A buyer has purchased three units of good X. The marginal benefit of the fourth unit of X exceeds the marginal cost of the fourth unit of good X. Which of the following reasons explains why the buyer should purchase the fourth unit?
I.The marginal net benefit of the fourth unit is positive.
II. Buying the fourth unit will increase total benefits by more than total costs.
III. Buying the fourth unit will increase total benefits and decrease total costs.
a) I only
b) I and II only
c) II only
d) I, II, III
2. According to marginal analysis, optimal decision-making involves:
a) Taking actions whenever the marginal benefit is positive.
b) Taking actions only if the marginal cost is zero.
c) Taking actions whenever the marginal benefit exceeds the marginal cost.
d) All of the above.
The following TWO questions refer to an individual’s demand curve diagram, illustrated below.
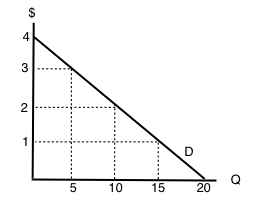
3. If the price of this good is $1 per unit, what will be the quantity demanded?
a) 5.
b) 10.
c) 15.
d) 20.
4. What are the TOTAL benefits to this individual if she consumes 10 units of the good?
a) $5.
b) $10.
c) $20.
d) $30.
5. The demand curve for a good is derived from the:
a) Marginal cost of the good.
b) Marginal benefit of the good.
c) Marginal benefits of the good minus marginal costs of the good.
d) Production Possibilities Frontier
6. Which of the following statements about demand curves is TRUE?
I. The “Law of Demand” holds if a consumer’s marginal benefit is lower at higher quantities consumed than it is at lower quantities consumed.
II. If the consumer’s marginal benefit is the same no matter what quantity is consumed, then her demand curve will be vertical.
III. All else equal, the marginal benefit of consuming a normal good will be higher for richer consumers than for poorer consumers.
a) III only.
b) I and II only.
c) I and III only.
d) I only.
The following FOUR questions refer to the diagram below, which illustrates a consumer’s demand curve for a good.
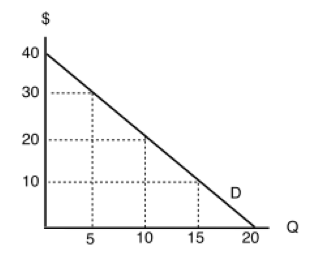
7. If the price of this good is $30, what quantity will be demanded?
a) 5 units.
b) 10 units.
c) 15 units.
d) 20 units.
8. If the price of this good is $20, what quantity will be demanded?
a) 5 units.
b) 10 units.
c) 15 units.
d) 20 units.
9. If the price of this good is $20, what will consumer surplus equal?
a) $100.
b) $200.
c) $300
d) $400.
10. If the price of this good falls from $30 to $20, but the consumer is prohibited from buying more than 5 units of the good, by how much will consumer surplus increase?
a) $100.
b) $75.
c) $50
d) $25.
Exercises 3.3
1. Which of the following statements about demand curves is TRUE?
a) If price falls and quantity demanded increases, this is represented by a movement along a given demand curve.
b) If price falls and quantity demanded increases, this is represented by a shift of the demand curve.
c) If price falls and quantity demanded increases, this can be represented by either a movement along a given demand curve, or a shift of the demand curve.
d) None of the above are true.
2. Which of the following is NOT a determinant of the demand for good X?
a) The income of consumers who buy good X.
b) The cost of labor used to produce good X.
c) The price of good Y, a complement to X.
d) The number of buyers of good X.
3. Which of the following will result in a DECREASE in demand (i.e., a leftward shift of the demand curve)?
a) An increase in income, if the good is normal.
b) A decrease in the price of a complement to the good.
c) An increase in the price of a substitute for the good.
d) None of the above.
4. Suppose that my daily marginal benefit from drinking coffee increases by $2 per cup. Which of the following represents the effect of this on my coffee demand curve?
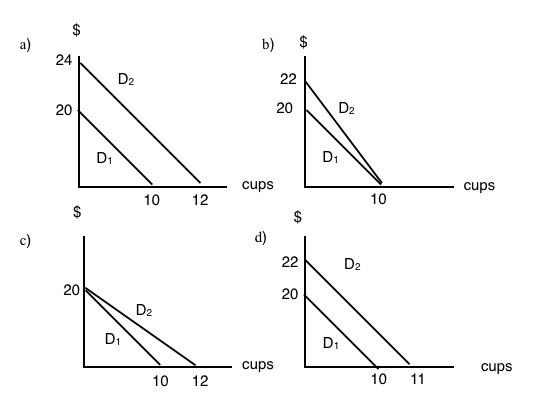
5. Which of the following is NOT a determinant of the demand for good X?
a) The cost of labor used to produce good X.
b) The price of good X.
c) The income of consumers who buy good X.
d) The price of good Y, which is a substitute for good X.
6. Which of the following IS a determinant of the demand for good X?
a) The income of consumers who buy good X.
b) The cost of labor used to produce good X.
c) The supply of good X.
d) The number of sellers of good X.
7. A decrease in quantity demanded is, graphically, represented by:
a) A leftward shift in the demand curve.
b) A rightward shift in the demand curve.
c) A movement up and to the left along a demand curve.
d) A movement down and to the right along a demand curve.
8. Suppose goods X and Y are substitutes. Which of the following is TRUE?
a) An increase in the price of X will result in a decrease in the equilibrium price of Y.
b) An decrease in the price of X will result in an increase in the equilibrium quantity of Y.
c) An increase in the price of X will result in an increase in the equilibrium quantity of Y.
d) More than one of the above is true.
9. If cookies are a normal good and incomes increase, we would expect:
a) An increase in equilibrium price and a decrease in equilibrium quantity.
b) A decrease in equilibrium price and an increase in equilibrium quantity.
c) A decrease in equilibrium price and equilibrium quantity.
d) An increase in equilibrium price and equilibrium quantity.
10. A decrease in demand is, graphically, represented by:
a) A leftward shift in the demand curve.
b) A rightward shift in the demand curve.
c) A movement up and to the left along a demand curve.
d) A movement down and to the right along a demand curve.
11. The diagram below illustrates 3 possible demand curves for coconuts.
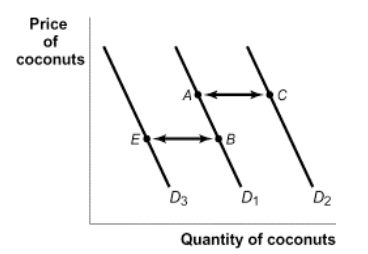
Suppose that coconuts and pineapples are substitutes. If the price of pineapples increases, which of the following movements will represent the effect of this in the market for coconuts?
a) A to C.
b) A to B.
c) B to A.
d) B to E.
The following TWO questions refer to the diagram below.
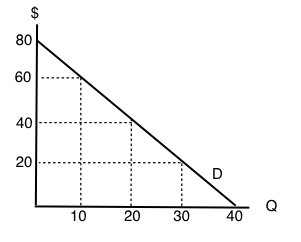
12. If the price of this good is $20, what will be the quantity demanded?
a) 10.
b) 20.
c) 30.
d) 40.
13. If the price of this good is $60, what will consumer surplus equal?
a) $50.
b) $100.
c) $150.
d) $200.
14. The following question refers to the diagram below, which illustrates an individual’s demand curve for a good.
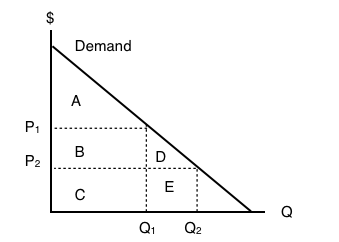
If the price of this good falls from P1 to P2, then consumer surplus will _____ by areas _____.
a) increase; B+D.
b) decrease; B+D.
c) increase; A+B+D.
d) decrease; A.
15. Consider the diagram below.
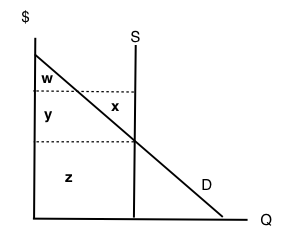
At the equilibrium in this market, which area represents CONSUMER surplus?
a) There is no consumer surplus.
b) Area w.
c) Area x + y.
d) Area w + y.
16. Which of the following CANNOT result in a shift of the demand curve for a good?
a) A change in consumers’ incomes.
b) A change in the price of the good.
c) A change in the price of a complement to the good.
d) All of the above will shift the demand curve.
17. Suppose the price of good X increases. If X and Y are substitutes, then, in the market for good Y, we would expect:
a) An increase in both the equilibrium price and quantity.
b) A decrease in the equilibrium price and an increase in the equilibrium quantity.
c) An increase in the equilibrium price and a decrease in the equilibrium quantity.
d) A decrease in both the equilibrium price and quantity.
18. If coffee and milk are complements, then which of the following will occur if the price of coffee increases?
a) The quantity of coffee demanded will increase.
b) The quantity of coffee supplied will decrease.
c) The demand for milk will increase.
d) The demand for milk will decrease.
19. Consumer surplus is equal to:
a) Revenue received for a good minus that good’s cost of production.
b) The amount of money a consumer is willing to pay for a good.
c) The opportunity cost of a good.
d) None of the above.
20. The diagram below illustrates 3 possible demand curves for coconuts.
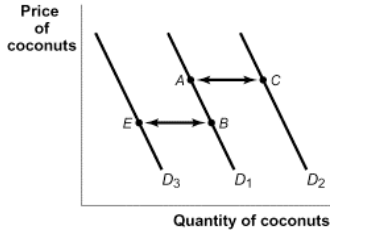
Suppose that (i) coconuts are an inferior good and (ii) consumer incomes decrease. Which of the following movements could represent the effect of this in the market for coconuts?
a) A to C.
b) B to A.
c) C to A.
d) B to E.
Exercises 3.4
1. An individual producer’s supply curve for a good is derived from:
a) The preferences of consumers of that good.
b) The income of consumers of that good.
c) The marginal cost of producing that good.
d) All of the above.
The following TWO questions refer to the supply curve diagram below.
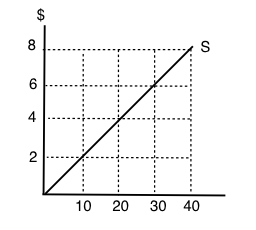
2. If price is $8 per unit, quantity supplied will equal:
a) 10.
b) 20.
c) 30.
d) 40.
3. If quantity supplied increases from 10 to 20 units, the producer’s total costs will increase by:
a) $20.
b) $30.
c) $40.
d) $80.
4. Which of the following statements about supply curves is TRUE?
a) The “law of supply” states that as price rises, quantity supplied also rises.
b) If the marginal cost of producing a good is higher at high levels of output than at low levels of output, then the supply curve for that good is upward sloping.
c) Both a) and b) are true.
d) Neither a) nor b) are true.
5. When deciding how much of a particular good to produce, a producer should:
a) Keep producing more units until the total benefits equal the total costs.
b) Always produce an additional unit if price is greater than marginal cost.
c) Never produce an additional unit if its marginal cost is higher than the marginal cost of previously produced units.
d) Always produce at additional unit if price is greater than zero.
The following TWO questions refer to the diagram below, which illustrates a supply curve.
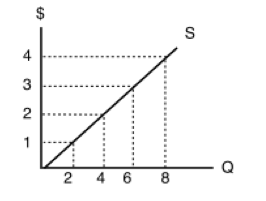
6. In order for quantity supplied to equal 6 units, the price per unit must be:
a) $1.
b) $2.
c) $3.
d) $4.
7. If the price of this good is $4 per unit, then what does producer surplus equal?
a) $32.
b) $24.
c) $16.
d) $12.
8. The diagram below illustrates a supply curve.
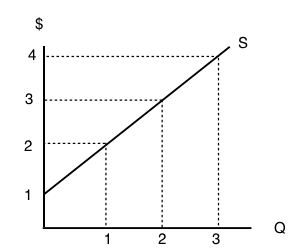
If the price of this good is $2 per unit, then what will be the quantity supplied?
a) 0.
b) 1.
c) 2.
d) 3.
9. Sarah is selling her used truck. The minimum amount she needs to be paid for the truck is $5,000. She advertises the truck on usedvictoria.com for $8,000, and eventually sells the truck for $6,000. Her producer surplus is equal to _____.
a) $1,000.
b) $2,000.
c) $3,000.
d) $6,000.
Exercises 3.5
1. Which of the following will NOT shift the market supply curve of good X?
a) A change in the cost of inputs used to produce good X.
b) A change in the technology used to produce X.
c) A change number of sellers of good X.
d) A change in the price of good X.
2. Which of the following is NOT a determinant of the supply of good X?
a) The cost of inputs used to produce good X.
b) The technology used to produce X.
c) The number of sellers of good X.
d) All of the above are determinants of the supply of good X.
The following TWO questions refer to the diagram below.
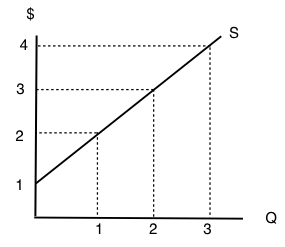
3. At what price will quantity supplied equal 3 units?
a) $1.
b) $2.
c) $3.
d) $4.
4. At what price will producer surplus equal $2?
a) $1.
b) $2.
c) $3.
d) $4.
5. A decrease in supply is, graphically, represented by:
a) A leftward shift in the supply curve.
b) A rightward shift in the supply curve.
c) A movement up and to the right along a supply curve.
d) A movement down and to the left along a supply curve.
6. Which of the following is NOT a determinant of the supply of good X?
a) The cost of labor used to produce good X.
b) The price of good X.
c) The income of consumers who buy good X.
d) The number of sellers of good X.
7. Which of the following is NOT a determinant of the supply of good X?
a) The cost of labor used to produce good X.
b) Consumer preferences.
c) Technology.
d) All of the above are determinants of the supply of good X.
8. Martin is selling his viola. The minimum amount he needs to be paid for the viola is $15,500. He find a buyer for who is willing to pay $22,400, but this buyer insists that Martin pays for delivery of the viola. The cost of delivery is $700. Martin’s producer surplus from selling his viola is equal to _____.
a) $14,800.
b) $7,600.
c) $6,900.
d) $6,200.
9. Which of the following statements about inferior goods is/are FALSE?
I. Inferior goods are those that we will never buy, no matter how cheap they are.
II. Inferior goods are those that we buy more of, if we become poorer.
III. Inferior goods are those that we buy more of, if we become richer.
a) I only
b) III only.
c) I and III only.
d) I, II, and III.
Exercises 3.6
1. Suppose that – at a given level of some economic activity – marginal benefit is greater than marginal cost. The economic agent in question (the decision-maker) can increase net benefits by increasing the level of the activity, for which of the following reasons?
a) Total costs will fall by more than total benefits.
b) Total benefits will rise by more than total costs.
c) Neither a) nor b).
d) Either a) or b).
2. Which of the following statements is TRUE?
a) Consumer surplus is the difference between the minimum amount a consumer is willing to pay, and what he or she actually pays.
b) Producer surplus is the difference between the amount of money a seller is paid, and the maximum amount that he or she needs to be paid.
c) Market surplus is equal to the sum of consumer surplus and producer surplus.
d) All of the above are true.
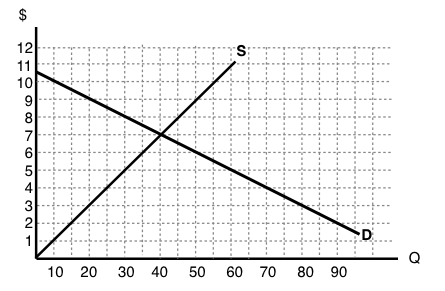
The following TWO questions refer to the supply and demand curve diagram below.
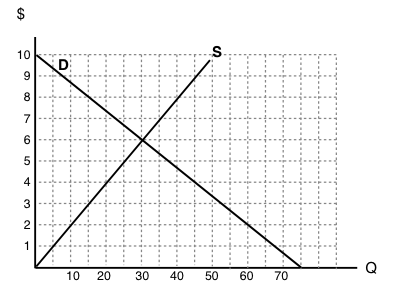
3. The equilibrium price in this market is equal to:
a) $6 per unit.
b) $5 per unit.
c) $4 per unit.
d) $3 per unit.
4. At a price of $8, there is:
a) Excess demand (a shortage) of 25 units.
b) Excess demand (a shortage) of 15 units.
c) Excess supply (a surplus) of 15 units.
d) Excess supply (a surplus) of 25 units.
5. Which of the following statements about consumer surplus and producer surplus is TRUE?
a) Consumer surplus is equal to the area under the demand curve.
b) Producer surplus is equal to the area under the supply curve.
c) Both producer and consumer surplus are equal to price multiplied by quantity.
d) None of the above statements is true.
6. Consider the supply and demand curve diagram below.
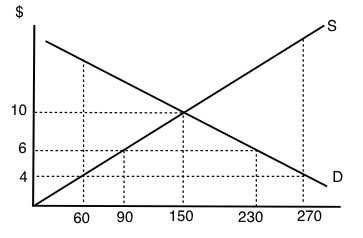
If the price of this good is $6, then:
a) There is an excess demand (a shortage) equal to 210 units.
b) There is an excess demand (a shortage) equal to 140 units.
c) There is an excess supply (a surplus) equal to 210 units.
d) There is an excess supply (a surplus) equal to 140 units.
7. When deciding how much of a particular good to purchase, a consumer should:
a) Keep buying more units until the total benefits equal the total costs.
b) Always buy at additional unit if its marginal net benefit is positive.
c) Keep buying more units if marginal cost is greater than marginal benefit.
d) Always buy at additional unit if its marginal benefit is positive.
8. Refer to the supply and demand diagram below.
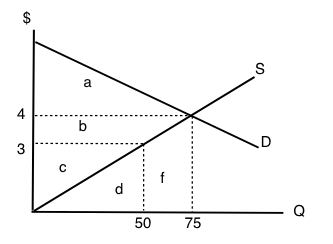
At the equilibrium price in this market, consumer surplus is equal to area ___ and producer surplus is equal to area ____
a) a + b; c.
b) a; b + c.
c) a + b; b + c.
d) a + b + c; d + f.
9. Which of the following statements about consumer and producer surplus is TRUE?
a) Consumer surplus is equal to the maximum amount a consumer is willing to pay for a good, minus what the consumer has to pay for the good.
b) Producer surplus is equal to the amount received from selling a good, minus the minimum amount the seller needed to receive, in order to be willing to sell the good.
c) Both a) and b) are true.
d) Neither a) nor b) are true.
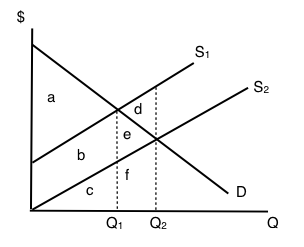
The following TWO questions refer to the supply and demand diagram below.
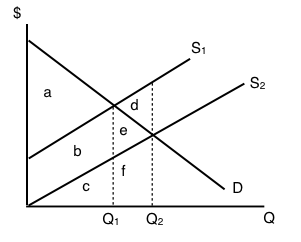
10. Which of the following COULD explain the shift in supply from S1 to S2.
a) An increase in the cost of producing the good.
b) A decrease in the number of sellers in the market.
c) Both a) and b).
d) Neither a) nor b).
11. If supply is S2, which area represents MARKET surplus?
a) a
b) a + b.
c) a + b + e.
d) We need to know price in order to determine market surplus.
12. Consider the supply and demand diagram drawn below.
Suppose that demand is initially D1, but, following a change in consumer preferences, demand shifts to D2. Note that the two demand curves are parallel. Which of the following statements is TRUE?
a) Demand increases by 30 units.
b) Quantity demanded increases by 30 units.
c) Equilibrium quantity increases by 30 units.
d) More than one of the above statements is true.
13. Suppose the equilibrium price of good X is $10 and the equilibrium quantity is 60 units. If the price of good X is $4:
a) The quantity demanded will be less than 60 units.
b) The quantity supplied will be more than 60 units.
c) There will be an excess demand for good X.
d) There will be an excess supply of good X.
14. All else equal, a decrease in the marginal cost of producing a good will result in:
a) A lower equilibrium quantity and a higher equilibrium price.
b) A lower equilibrium quantity and a lower equilibrium price.
c) A higher equilibrium quantity and a higher equilibrium price.
d) A higher equilibrium quantity and a lower equilibrium price.
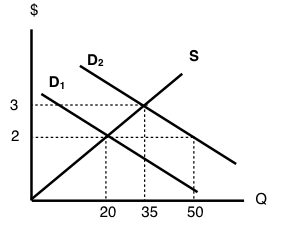
The following TWO questions refer to the diagram below.
15. The equilibrium price is ____ the equilibrium quantity is _____.
a) $5; 30.
b) $7; 30.
c) $7; 40.
d) $8; 40.
16. If the marginal cost of producing this good rises by $3 at every output level, then the new equilibrium price will be _____.
a) There is insufficient information to calculate the new equilibrium price
b) $3.
c) $8.
d) $10.
17. Consider the supply and demand diagram drawn below.
What does the equilibrium price equal in this market?
a) $8.
b) $15.
c) $30.
d) $45.
18. Refer to the diagram below.
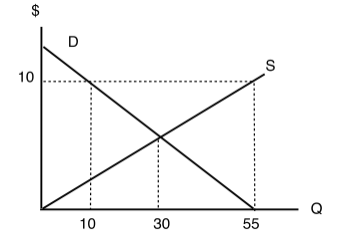
At a price of $10 per unit:
a) There is excess demand (a shortage) equal to 45 units.
b) There is excess supply (a surplus) equal to 45 units.
c) There is excess demand (a shortage) equal to 20 units.
d) There is excess supply (a surplus) equal to 20 units.
19. Consider the market for oranges. Suppose that both of the following occur simultaneously: (i) the price of apples (a substitute for oranges) decreases; and (ii) world-wide droughts reduce the harvest of oranges by 30%. Then, in the market for oranges we would expect:
a) The equilibrium price of oranges could either increase or decrease, but equilibrium quantity will definitely decrease.
b) The equilibrium quantity of oranges could either increase or decrease, but equilibrium price will definitely decrease.
c) The equilibrium price of oranges could either increase or decrease, but equilibrium quantity will definitely increase.
d) The equilibrium quantity of oranges could either increase or decrease, but equilibrium price will definitely increase.
20. Suppose that, following a decrease in the supply of good X, we observe that the price of good Y decreases. If no other curves have shifted, which of the following can we infer?
a) Good X is an inferior good.
b) Goods X and Y are complements.
c) Goods X and Y are substitutes.
d) None of the above.
21. In recent years there have been a couple of high profile cases of contamination of baby formula produced in China. As a result, many Chinese parents buy baby formula that is produced outside China. Which of the following accurately describes the likely effect of this on baby formula prices?
a) An increase in the price of baby formula produced in China and a decrease in the price of baby formula produced outside China.
b) A decrease in the price of baby formula produced in China and an increase in the price of baby formula produced outside China.
c) A decrease in the price of both baby formula produced in China and baby formula produced outside China.
d) An increase in the price of both baby formula produced in China and baby formula produced outside China.
22. Refer to the supply and demand diagram below.
If supply is S1, which area represents MARKET surplus?
a) a
b) a + b.
c) a + b + e.
d) We need to know price in order to determine market surplus.
23. Suppose that in the market for good X (a normal good), the following occur simultaneously: (i) consumer incomes increase and (ii) the price of oil (an input to the production of X) increases. Which of the following statements is TRUE?
a) The equilibrium price of X could either increase or decrease, but equilibrium quantity will definitely decrease.
b) The equilibrium quantity of X could either increase or decrease, but equilibrium price will definitely decrease.
c) The equilibrium price of X could either increase or decrease, but equilibrium quantity will definitely increase.
d) The equilibrium quantity of X could either increase or decrease, but equilibrium price will definitely increase.
24. Consider the supply and demand diagram below.
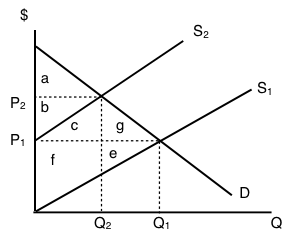
If supply decreases from S1 to S2, which area represents the change in PRODUCER surplus?
a) b + c – f.
b) a + b + c.
c) b – f – e.
d) c + f + g + e.
25. A recent news story reported that OPEC is expected to decrease the supply of oil next summer. Summer is traditionally a time of increased demand for oil because of the many families driving and flying to vacation sites. What would be the combined effect of these two activities on the summer market for gasoline?
a) An increase in the equilibrium price and the quantity.
b) An increase in the equilibrium price and an unpredictable change in the equilibrium quantity.
c) An unpredictable change in both the equilibrium price and the quantity.
d) An unpredictable change in the equilibrium price and a decrease in the equilibrium quantity.
26. Consider the supply and demand curves drawn below.
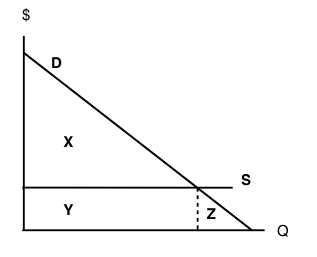
Given the equilibrium quantity, which area represents MARKET SURPLUS?
a) X + Y + Z.
b) X + Y.
c) X.
d) There is no market surplus.
27. Which of the following CANNOT result in an increase in price in a competitive market for a normal good?
a) An increase in income.
b) A decrease in the price of a complement to this good.
c) An increase in the price of a substitute for this good.
d) A decrease in the wages paid to workers who produce this good.
28. Consider the supply and demand curves illustrated below.
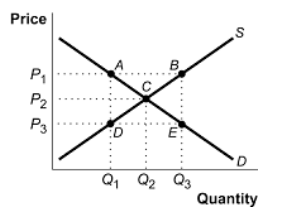
Which of the following statements is true?
a) At a price of P3, there is excess demand equal to the distance DE.
b) At a price of P3, there is excess demand equal to the distance BE.
c) At a price of P3, there is excess supply equal to the distance BE.
d) At a price of P3, there is excess supply equal to the distance DE.
29. Which of the following CANNOT result in a decrease in the equilibrium quantity sold of an inferior good?
a) An increase in the price of a substitute for the good.
b) An increase in consumer incomes.
c) An increase in wages paid to workers who produce the good.
d) An increase in the price of a complement for the good.
30. Which of the following statements is FALSE?
a) At the competitive equilibrium, market surplus is maximized.
b) At the competitive equilibrium, the marginal benefit to consumers equals the marginal cost to producers.
c) At the competitive equilibrium, social surplus is maximized if there are no externalities.
d) At the competitive equilibrium, it is possible to make at least one person better off without making anyone worse off.
31. A recent Health Canada report argued that there is a strong link between the consumption of steak and heart disease. At the same time, Canadian consumers’ incomes rose. If steak is a normal good, what are the combined effects in the market for steak?
a) An increase in the equilibrium price and the quantity.
b) An increase in the equilibrium price and an unpredictable change in the equilibrium quantity.
c) An unpredictable change in both the equilibrium price and the quantity.
d) An unpredictable change in the equilibrium price and a decrease in the equilibrium quantity.
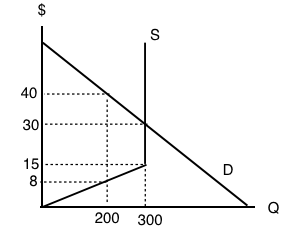
The next THREE questions refer to the diagram below.
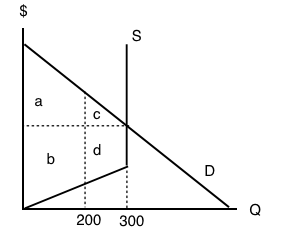
32. Given the equilibrium quantity of 300 units, which areas represent MARKET SURPLUS?
a) a+b+c+d.
b) a+b+c.
c) a+c.
d) a+b.
33. Given the equilibrium quantity of 300 units, which areas represent PRODUCER SURPLUS?
a) c+d.
b) a+b.
c) a+c.
d) b+d.
34. Given the equilibrium quantity of 300 units, which areas represent CONSUMER SURPLUS?
a) c+d.
b) a+b.
c) a+c.
d) b+d.
