Solutions: Case Study – The Liberal Gas Tax
1. Draw the household’s budget line on the diagram below. If they were to buy only one good or the other, how many total L of gas could they buy? How many of all other goods?
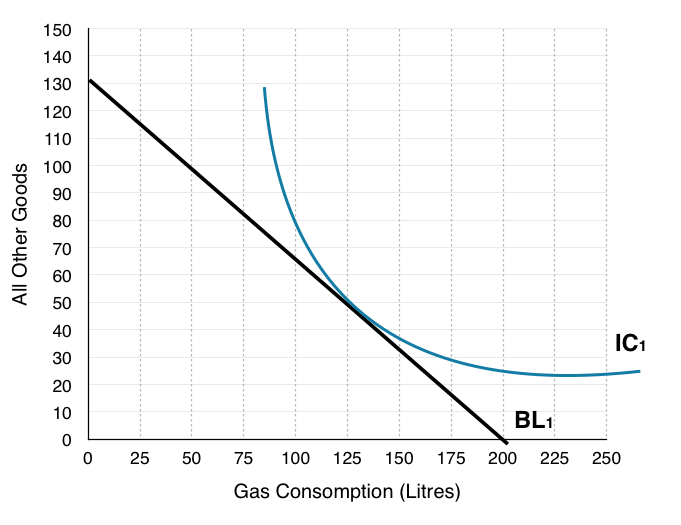
In order to draw the budget line the best method is to find how many of each good the household could buy if they purchased only one good. In this case the household has a budget of $180, the price of gas is $0.90 and the price of all other goods is $1.38.
Purchase only gas: $180/$0.90 = 200. This is our X-intercept.
Purchase only other goods: $180/$1.38 = 130. This is our Y-intercept.
Plotting the intercept and connecting the dots:
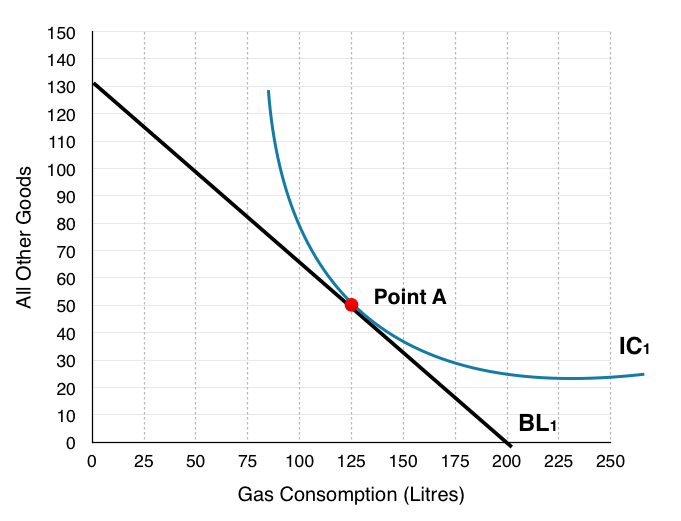
2. Indicate where the household will consume. How many litres of gas? How many of all other goods? Label this Point A.
The place where the household will consume is where the IC is tangent to the budget line, or where MRS = Px/Py. At this point the benefits of an extra litre of gas are equal to the costs, so the household cannot gain from any change in consumption.
On the graph below, we see households consume at Point A, consuming 125L of gas and 50 Other Goods.
3. Assume the government was to tax gas consumption by $0.11, draw the new budget line on the graph above.
Again to draw the budget line the best method is to find how many of each good the household could buy if they purchased only one good. In this case the only thing that has changed is our price of gas has increased from $0.90 to $1.01.
Purchase only gas: $180/$1.01 = 178. This is our X-intercept.
Purchase only other goods: $180/$1.38 = 130. This is our Y-intercept.
Plotting the intercept and connecting the dots:
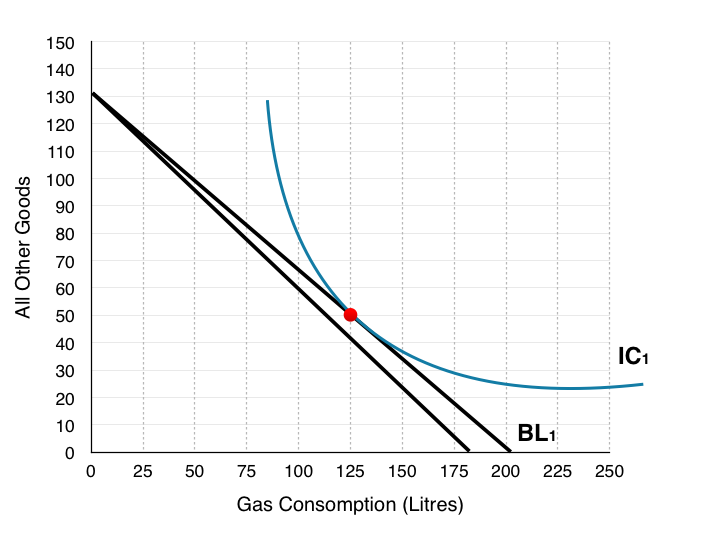
Notice the new budget line has been left unlabelled as it will not be used for the rest of the analysis. You can see now the reason we move forward with the assumption that price has doubled, as drawing new indifference curves and budget shifts on this diagram becomes very difficult!
4. Redraw the households original budget line on the diagram below, and draw a new budget line where the price of gas has doubled.
Using the same steps to draw the budget line, except now the price of gas has doubled from $0.90 to $1.80.
Purchase only gas: $180/$1.80 = 100. This is our X-intercept.
Purchase only other goods: $180/$1.38 = 130. This is our Y-intercept.
Plotting the intercept and connecting the dots:
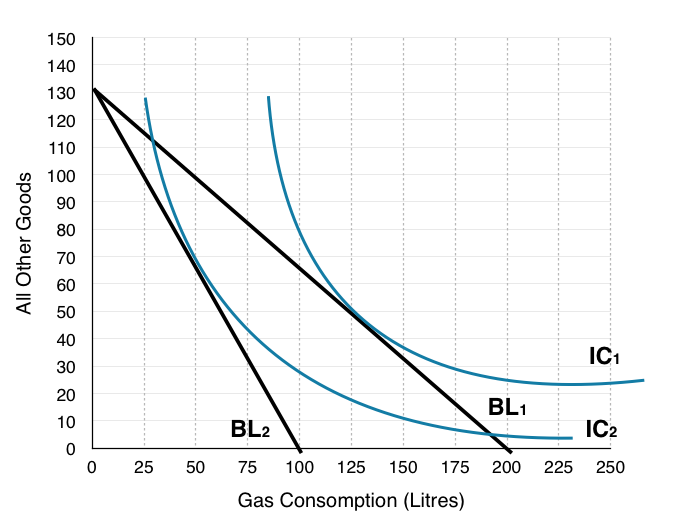
5. Indicate where the household will consume. How many litres of gas? How many of all other goods? Label this Point B.
On the graph below, households consume where BL2 is tangent to IC2 at Point B, consuming 50L of gas and 70 Other Goods.
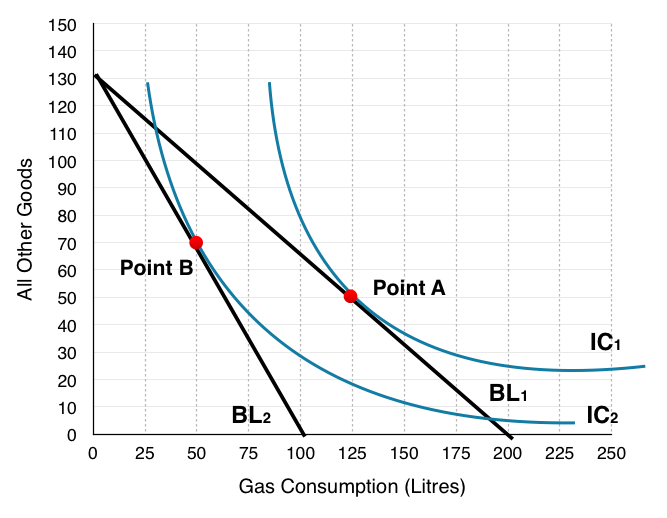
6. Is the household better off or worse off as a result of the tax? How do you know?
We can see that the household is worse off as a result of the tax since they are consuming on a lower indifference curve. Remember the household views every point along an indifference curve as equal, so operating at a point on a lower indifference curve means you are worse off.
7. How much money does the government collect from each household from the gas tax?
The government collects $0.90 for every L of gas that is consumed, in question 5 we identified that households consume 50L after the tax. This means that the government collects $0.90*50 = $45 from each household.
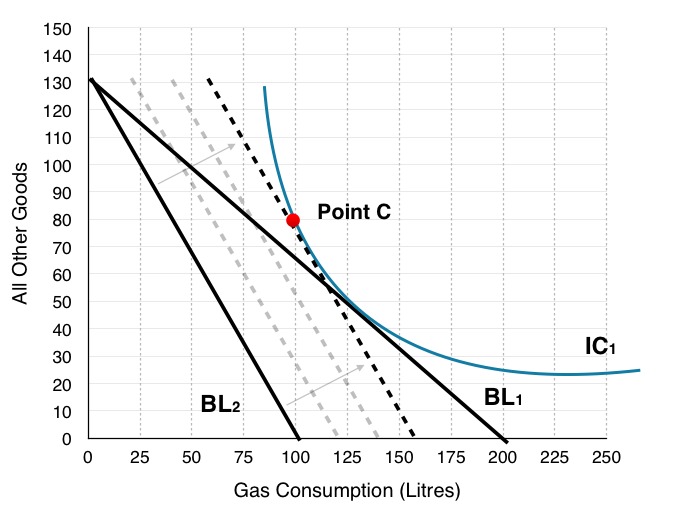
8. If the government compensates each household until they are indifferent to the gas tax, where will the households consume? Label this Point C.
In order to find this information we have to shift the new budget line (BL2) until it is tangent to the original indifference curve. In question 6 we emphasized that if households are on a lower indifference curve they are worse off, and that the consumer is indifferent between points on its indifference curve. In the figure below we can see BL2 gradually shift out as the government gives more and more to the household. This continues until the budget line + compensation is tangent to the original indifference curve at Point C.
At Point C, households consume 100L of gas and 80 Other Goods.
What is very important to note here is that even though the government compensated the households for their losses, they have still reduced consumption of gas by 25L. This shows that the policy can be effective at reducing pollution without making households worse off.
9. How much money would the government have to give to each household to make them indifferent about the tax?
To find out how much the government must give each household, the best method is to find how much money the household needs to afford Point C. If other goods cost $1.38 and gas costs $1.80, then we can simply multiply the consumption bundle by the prices
1.38 * 80 + 100* 1.80 = $290.50.
Since the household still only has a budget of $180, the government must compensate the difference ($290.50 – $180). This means that the government must give each household $110.50 for them to remain indifferent about the gas tax.
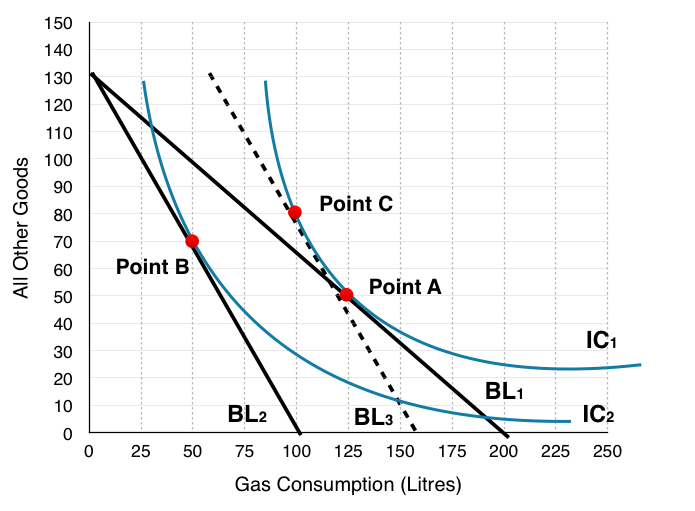
10. Indicate the Income Effect, the Substitution Effect and the Final Effect of the tax (without compensation) with reference to the 3 points (A, B & C). What is the final effect of the entire policy (with compensation)?
In Topic 6 we have mentioned numerous times that to isolate the income effect and substitution effect we have to give back the ‘hypothetical’ income to see how a household would behave if they had no reduction in purchasing power. In this exercise (question 9) we calculated how much this income would have to be, so that the government could remove the effects. This means that the final effect of the tax + compensation (Point A to Point C) is just the substitution effect and that the government’s compensation is the income effect. In summary:
Just Tax
Substitution Effect: Point A to Point C
Income Effect: Point C to Point B
Final Effect: Point A to Point B
Tax + Compensation
Substitution Effect: Point A to Point C
Income Effect: N/A
Final Effect: Point A to Point C
11. How could this policy represent a potential Pareto improvement if the revenue the government receives is not enough to compensate the households?
We can notice that the government collects $45 but gives out $110.50 from this policy, making them lose $65.60. First off we can recognize that this tax in no way helps the firms, in fact it will make them worse off as less consumers buy gas. How then can this policy ever increase social surplus?
If we remember from Topic 5, households, firms, and government are not the only players we need to consider, but also the marginal external cost of actions. In this case the government may be losing money, but they are reducing the amount of pollution and benefiting the environment. Without information about the value we place on this reduction of pollution, we cannot determine whether this policy is increasing social surplus.
