2.3 Trade
Learning Objectives
By the end of this section, you will be able to:
- Explain the gains of trade created when a country specializes
- Define absolute advantage, comparative advantage
- Understand how to find comparative and absolute advantage from looking at a PPF
The American statesman Benjamin Franklin (1706–1790) once wrote: “No nation was ever ruined by trade.” Many economists would express their attitudes toward international trade in an even more positive manner.
The evidence that international trade confers overall benefits on economies is very strong. Trade has accompanied economic growth in Canada and around the world. Many economies that have shown the most rapid growth in the last few decades—for example, Japan, South Korea, China, and India—have done so by dramatically orienting their economies toward international trade. To understand the benefits of trade, or why we trade in the first place, we need to understand the concepts of comparative and absolute advantage.
Production Possibilities with Trade
In the previous section, we stated that points outside the PPF were not possible given our constraints. With trade, these constraints can change. Continuing the example from Chapter 2.2, suppose another person, Jamie, becomes stranded on the island with you. You could choose to avoid him and live your own separate lives, or you could work together to improve each other’s well-being. It turns out Jamie has different skills than you – he is better at producing both crabs and pineapples. (See Figure 2.3a)
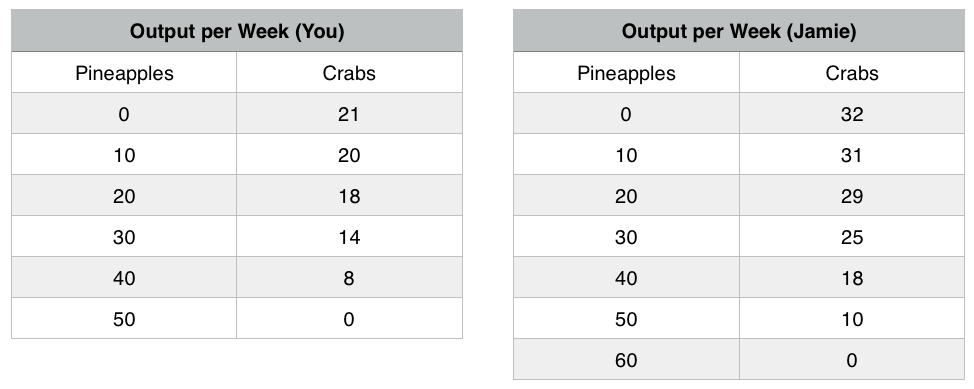
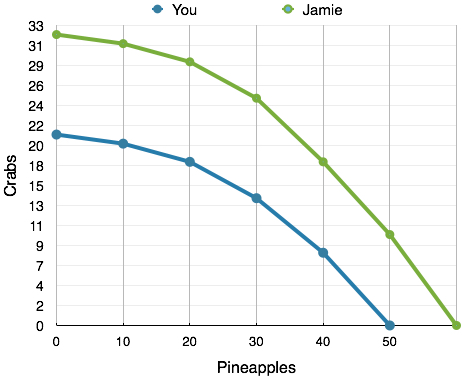
In this case, where one person or group is better at producing both goods, we say they have an Absolute Advantage in the production of the good. In this example, Jamie has the absolute advantage in the production of both goods. This means Jamie’s entire PPF lies outside of yours. (See Figure 2.3b)
Why would Jamie want to trade with you if he is better at producing both goods? We mentioned before that preferences determine where you would produce. For this example, assume that you want to produce and consume the following:
Without Trade
You: 20 pineapples and 18 crabs
Jamie: 50 pineapples and 10 crabs.
Between the two of you, you are producing 70 pineapples and 28 crabs. Is this efficient? Recall that a situation is efficient if there are no available Pareto Improvements. If we can get more pineapples and crabs without having to give anything up, then the situation is inefficient.
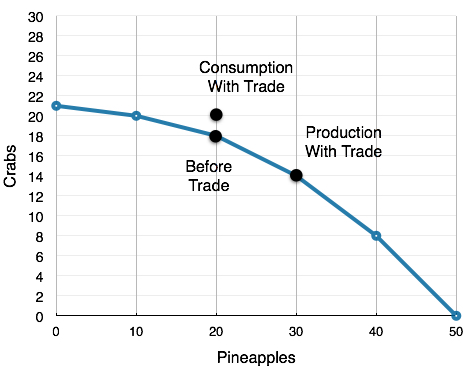
By simply changing both yours and Jamie’s production points, we see that this is inefficient. If you were to produce 30 pineapples and 14 crabs while Jamie was to produce 40 pineapples and 18 crabs, the aggregate production would be 70 pineapples and 32 crabs – four more crabs than before! It is now clear that the previous situation was inefficient. You can trade 10 of your pineapples for 6 crabs, which leaves the following allotment of resources:
With Trade
You: 20 pineapples and 20 crabs
Jamie: 50 pineapples and 12 crabs
Each of you walks away with two more crabs than before. This is what we mean when we talk about gains from trade. Both you and Jamie are now able to produce at a point outside your PPF’s. To understand where these extra crabs come from, we must first explore the concept of comparative advantage.
Application
It’s All About Oil
A country has an absolute advantage in producing if it uses fewer resources to produce. Absolute advantage can be the result of a country’s natural endowment. For example, extracting oil in Saudi Arabia and other Middle Eastern countries is essentially just a matter of drilling a hole. Producing oil in countries like the United States can require considerable exploration and costly technologies for drilling and extraction. This case of absolute advantage has been a key contributing factor towards much of the chaos in the Middle East. The United States and other countries will go to great extents to defend their oil interests, and will sometimes meddle in other country’s affairs in devastating ways.
Comparative Advantage
Let’s look further into these gains from trade.
When you increase your production of pineapples from 20 to 30, you have to give up 4 crabs. This means your marginal cost is 0.4 crabs for 1 pineapple.
When Jamie decreased his production of pineapples from 50 to 40, he gained 8 crabs. This means his marginal cost was 0.8 crabs for 1 pineapple.
The gains from trade arise from this difference in marginal cost. Since it is more expensive for Jamie to produce pineapples (MC of 0.8 versus your MC of 0.4) he should produce fewer pineapples and more crabs. The economic agent with the lower marginal cost of producing a good has the comparative advantage in producing that good. In this case, you have the comparative advantage in producing pineapples, and Jamie has the comparative advantage in producing crabs. This specialization in production results in gains from trade, as each person or country can focus on what it can produce at the lowest cost.
Note that even though Jamie had the absolute advantage in both goods, his marginal cost of producing crabs was still higher, since marginal cost is based on a trade-off between the two goods. We can liken this example to a trade between Canada and a developing country. Canada may be better at producing both computers and textiles (the absolute advantage) but the advantages we have in producing computers are far greater. Any hour we have to give up to produce textiles comes at a much higher cost to us than it would to a developing country, giving us the comparative advantage at producing computers, and the developing country the advantage at producing textiles. The island example is no different. Even though Jamie is better at producing pineapples, what Jamie is really an expert at is producing crabs, so having to give up time spent catching crabs comes at a high cost.
In this example, marginal costs are changing. This means that depending on where individuals produce, they may have a different comparative advantage. Recall that marginal cost is the slope of the PPF, so as each individual produces more pineapples, the pineapples become more expensive to produce. This is known as the law of diminishing returns which states that as additional increments of resources are added to producing a good or service, the marginal benefit from those additional increments will decline. This example has introduced a lot of different concepts – moving forward, our examples will be simpler, and linear.
Linear PPF’s
Most of the examples will deal with linear PPF’s. This makes problems considerably easier, since in the case of a linear PPF (in which the marginal cost will be constant), one individual will always have the comparative advantage in one good. This means that comparative advantage is the same at any point on the PPF, and can be easily calculated.
We have changed Jamie and your skill set to be linear in Figure 2.3d.
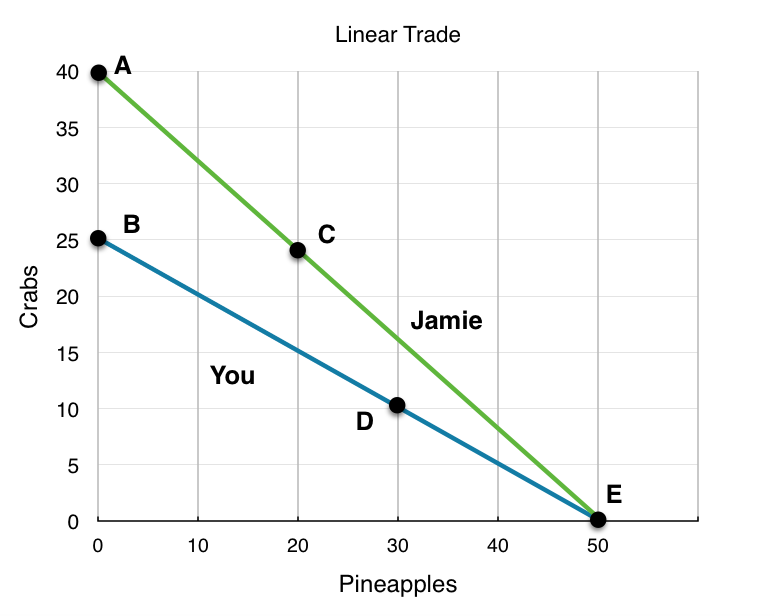
Now we can use our tools of efficiency and trade to determine if certain points are efficient. In Figure 2.3d various points have been shown to reflect possible points of production for you (blue) and Jamie (green). Remember, we have no information about preferences. The first step is to find who has the comparative advantage for which good. For a linear PPF, this just means finding the slope.
Jamie
Jamie’s PPF has the slope of 40/50 or 0.8 Crabs for 1 Pineapple.
This means his opportunity costs are:
0.8 Crabs for 1 Pineapple.
1.25 Pineapples for 1 Crab (the inverse of the slope)
You
Your PPF has the slope of 25/50 or 0.5 Crabs for 1 Pineapple.
This means your opportunity costs are:
0.5 Crabs for 1 Pineapple.
2 Pineapples for 1 Crab
Who Has the Comparative Advantage
Comparing the opportunity costs, it costs Jamie 0.8 Crabs to produce 1 Pineapple, whereas is costs you only 0.5 Crabs. This means:
You have the comparative advantage in producing Pineapples.
Remember that the 0.8 and 0.5 crabs represent the cost of pineapples in terms of crabs. It is similar to saying “It costs Jamie $0.80 to buy a Pineapple, it costs you $0.50, who should buy it?” In a PPF, cost is denoted in terms of the other good, not dollars.
Furthermore, it costs Jamie only 1.25 Pineapples to produce 1 Crab, whereas is costs you 2 Pineapples This means:
Jamie has the comparative advantage in producing Crabs.
This is true for every point on our PPF. Now we will examine each of the points using this information.
Jamie Produces @ Point E, You Produce @ Point B
In this combination, Jamie produces only Pineapples and you produce only Crabs. This situation is clearly inefficient since each player is producing a good the other can produce for less. By changing production and trading goods, both parties stand to benefit.
Jamie Produces @ Point C, You Produce @ Point D
Recognizing that the last combination was inefficient, Jamie begins producing more Crabs and you begin producing more Pineapples. Although this seems to adhere to the comparative advantage, each of you are still producing goods that the other can produce for less. Jamie is still producing 20 Pineapples, and you are still producing 10 Crabs. As we saw before, if you both specialize in what you are comparably good at, then there will be even more gains from trade. This means that the situation is inefficient.
Jamie Produces @ Point A, You Produce @ Point E
Realizing the previous points were inefficient, Jamie produces only Pineapples and you produce only Crabs. In this situation both players are producing only the good they have the comparative advantage in. This situation is certainly efficient, as there are no production changes that can be made that result in more than 40 Crabs, and 50 Pineapples.
Jamie Produces @ Point A, You Produce @ Point D
What if we want 50 Crabs? Is there no way to produce this efficiently? There is. Point A/Point E is not the only efficient point possible. This is because of preferences. If in total, you and Jamie prefer only 40 Crabs, then Point A/ Point E would be the efficient point where you would produce, but if you and Jamie desire 50 Crabs, that would not be the preferred combination. If you desire 50 Crabs, then the person who has the comparative advantage in Crabs (in this case Jamie) should produce all 50 Crabs, or produce as many Crabs as possible. In this case, Jamie can only produce 40, which leaves the remaining 10 to be produced by you. Although Jamie could produce these 10 Crabs more efficiently, he is constrained by his production ability. This means that Point A/Point D is also an efficient combination of goods, since there is no way to acquire 50 Crabs which results in more than 30 Pineapples being produced.
Jamie Produces @ Point A, You Produce @ Point B
It should logically follow that this combination is also efficient. Even though you have the comparative advantage at producing Pineapples, if the Pineapples are poisonous and no one wants any, both you and Jamie will produce only Crabs! There is no other way to produce 65 Crabs where you will have any Pineapples left.
To simplify the analysis above you can use the following rule for linear PPF’s
If at least one player is maximizing their comparative advantage, then the situation is efficient
This simple rule occurs since any combination where both players produce a mix of goods is a combination where players stand to gain from more specialization and trade. These gains only end when at least one player has exhausted the gains from specialization, and is producing only the good they are comparatively better at.
Summary
In summary, the PPF is a model we can use to represent the production of one or more parties. Trade allows parties to consume at points outside their PPF when they maximize comparative advantage. The party with the lower opportunity cost will have the comparative advantage in the production of a good. Even though a party might have the absolute advantage in the production of both goods, since comparative advantage is based on opportunity costs, other parties can still retain comparative advantage. Parties can achieve gains from trade by specializing in the good they are comparably good at, to the extent that consumers want that good.
Conclusion
In Topic 2, we have explored the production possibility model in depth, looking at a simplified version of trade and deepening our understanding of opportunity costs. Now, we can take our knowledge of basic economic modelling and our comprehension of costs and examine one of the most important of microeconomics: supply and demand.
Glossary
- Absolute Advantage
- when one country can use fewer resources to produce a good compared to another country; when a country is more productive compared to another country
- Comparative Advantage
- when a country can produce a good at a lower cost in terms of other goods; or, when a country has a lower opportunity cost of production
- Gains from Trade
- a country that can consume more than it can produce as a result of specialization and trade
- Law of Diminishing Returns
- as additional increments of resources are added to producing a good or service, the marginal benefit from those additional increments will decline
- Specialization
- a method of production where one party focuses on the production of a limited group of products or services
Exercises 2.3
1. The following question refers to the table below, which shows the maximum number of goods X and Y that producers A and B can produce in one day.
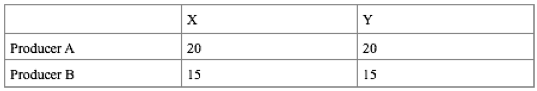
Which of the following statements in TRUE?
a) Producer A has the comparative advantage in producing X.
b) Producer A has the comparative advantage in producing Y.
c) Producer B has the absolute advantage in producing X and Y.
d) No producer has the comparative advantage in producing either X or Y.
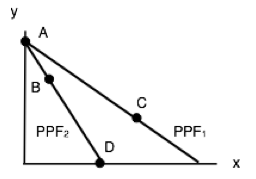
2. Consider the PPF diagram drawn below, for two countries that are free to trade with one another.
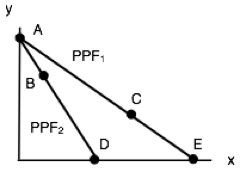
Which of the following production combinations is/are INEFFICIENT?
I. Country 1 produces at point C and country 2 produces at point D.
II. Country 1 produces at point E and country 2 produces point at B.
III. Country 1 produces at point E and country 2 produces at point A.
a) II only.
b) I only.
c) I and II only.
d) I, II and III.
3. The diagram below illustrates the PPFs for two countries that produce wine and cheese. With no trade, country 1 produces at point A on its PPF and country 2 produces at point B.
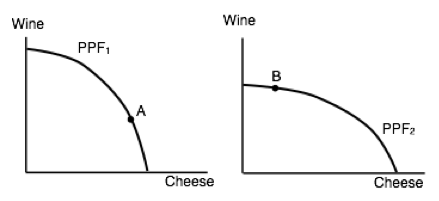
Assume that the two countries now begin to trade with one another. Which of the following will NOT occur (relative to the case with no trade).
a) Country 1 will produce less cheese.
b) Country 2 will export wine.
c) Country 1 will import cheese.
d) Country 2 will produce more cheese.
4. Which of the following statements about production and trade is FALSE?
I. If a country has an absolute advantage in producing a good, then it also has the comparative advantage in the production of that good.
II. Rich countries will generally have the comparative advantage in the production of all goods.
III. If a country has the absolute advantage in the production of a good, then this country will be made better off by specializing in the production of that good.a) I only.
b) I and II only.
c) I, II and III.
d) III only.
The following THREE questions refer to the diagram below, which illustrates the PPFs for two countries who are free to trade.
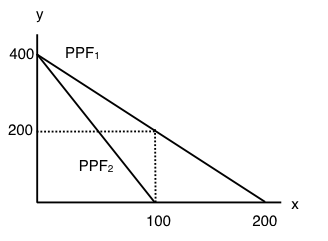
5. What is the marginal opportunity cost (MC) of producing good x in each country?
a) 2 units of good y in country 1 and 4 units of good y in country 2.
b) 1/2 a unit of good y in country 1 and 1/4 of a unit of good y in country 2.
c) 2 units of good y in country 1 and 1/4 of a unit of good y in country 2.
d) 1/2 a unit of good y in country 1 and 4 units of good y in country 2.
6. What is the marginal opportunity cost (MC) of producing good y in each country?
a) 2 units of good x in country 1 and 4 units of good x in country 2.
b) 1/2 a unit of good x in country 1 and 1/4 of a unit of good x in country 2.
c) 2 units of good x in country 1 and 1/4 of a unit of good x in country 2.
d) 1/2 a unit of good x in country 1 and 4 units of good x in country 2.
7. Suppose that aggregate production of x across the two countries is equal to 100 (that is, country one’s production of x plus country two’s production of x equals 100 units). If these 100 units of x are being produced efficiently, then aggregate production of y will equal:
a) 200 units of y.
b) 400 units of y.
c) 600 units of y.
d) 800 units of y.
8. The diagram below illustrates the identical PPFs of two countries.
Initially, there is no trade allowed between the two countries, and each country produces at point A. If trade is opened up, which of the following will occur?
I. Country 1 will export coal to country 2.
II. Country 2 will produce more clothing.
III. Country 1 will produce less coal.
a) I and II only.
b) III only.
c) II and III only.
d) None of the above.
9. The table below shows the maximum amounts of coffee and salmon that Brazil and British Colombia can produce if they just produce one good.
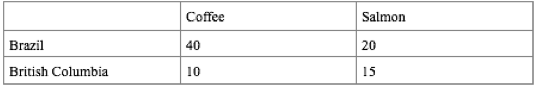
Assuming constant marginal costs:
a) Brazil has a comparative advantage in coffee production
b) In Brazil, the marginal cost of salmon production is 2 units of coffee.
c) In BC, the marginal cost of coffee production is 1½ units of salmon.
d) All of the above are correct.
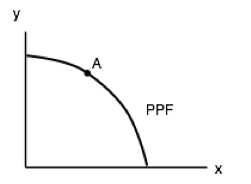
10. The diagram below illustrates the PPFs for two countries that produce two goods. The two countries are free to trade with one another.
Which of the following production combinations are efficient?
a) Country 1 is at point C; country 2 is at point D.
b) Country 1 is at point A; country 2 is at point B.
c) Country 1 is at point C; country 2 is at point A.
d) All of the above are efficient.
