8.4 Monopolistic Competition
Learning Objectives
- Explain the significance of differentiated products
- Describe how a monopolistic competitor chooses price and quantity
- Discuss entry, exit, and efficiency as they pertain to monopolistic competition
- Analyze how advertising can impact monopolistic competition
We have now explored the two sides of the spectrum. In perfect competition, we assume identical products, and in a monopoly, we assume only one product is available.
Monopolistic competition lies in-between. It involves many firms competing against each other, but selling products that are distinctive in some way. Examples include stores that sell different styles of clothing, restaurants or grocery stores that sell different kinds of food and even products like golf balls or beer that may be at least somewhat similar but differ in public perception because of advertising and brand names. Firms producing such products must also compete with other styles, flavours and brand names. The term “monopolistic competition” captures this mixture of mini-monopoly and tough competition.
Who invented the theory of imperfect competition?
The theory of imperfect competition was developed by two economists independently but simultaneously in 1933. The first was Edward Chamberlin of Harvard University who published The Economics of Monopolistic Competition. The second was Joan Robinson of Cambridge University who published The Economics of Imperfect Competition. Robinson subsequently became interested in macroeconomics where she became a prominent Keynesian, and later a post-Keynesian economist.
Differentiated Products
A firm can try to make its products different from those of its competitors in several ways: physical aspects of the product, selling location, intangible aspects of the product, and perceptions of the product. Products that are distinctive in one of these four ways are called differentiated products.
Physical aspects of a product include all the phrases you hear in advertisements: such as an unbreakable bottle, nonstick surface, freezer-to-microwave, non-shrink, extra spicy, newly redesigned for your comfort. The location of a firm can also create a difference between producers. For example, a gas station located at a busy intersection can probably sell more gas than one located on a small side-road. A supplier to an automobile manufacturer may find that it is advantageous to locate near the car factory.
Intangible aspects can differentiate a product, too. Some intangible aspects may be promises like a guarantee of satisfaction or money back, a reputation for high-quality services like free delivery, or a loan to purchase the product. Finally, product perception may occur in the minds of the buyers. For example, many people could not tell the difference in taste between common varieties of beer or cigarettes if they were blindfolded, but because of past habits and advertising, they have strong preferences for certain brands. Advertising can play a role in shaping these intangible preferences.
The concept of differentiated products is closely related to the degree of variety that is available. If everyone in the economy wore only blue jeans, ate only white bread, and drank only tap water, then the markets for clothing, food, and drink would be much closer to perfectly competitive. The variety of styles, flavors, locations, and characteristics creates product differentiation and monopolistic competition.
Perceived Demand for a Monopolistic Competitor
A monopolistically competitive firm faces a demand for its goods that is between monopoly and perfect competition. Figure 8.4a offers a reminder that the demand curve as faced by a perfectly competitive firm is perfectly elastic or flat, because the perfectly competitive firm can sell any quantity it wishes at the prevailing market price. In contrast, the demand curve, as faced by a monopolist, is the market demand curve, since a monopolist is the only firm in the market, and hence is downward sloping.
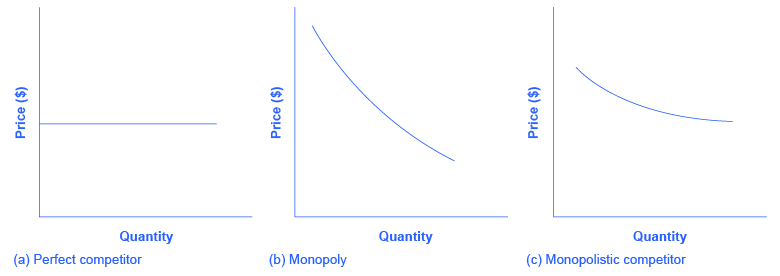
The demand curve as faced by a monopolistic competitor is not flat, but rather downward-sloping, meaning that the monopolistic competitor, like the monopoly, can raise its price without losing all of its customers or lower its price and gain more customers. Since there are substitutes, the demand curve for a monopolistically competitive firm is relatively more elastic than that of a monopoly, where there are no close substitutes. If a monopolist raises its price, some consumers will choose not to purchase its product—but they will then need to buy a completely different product. However, when a monopolistic competitor raises its price, consumers can choose to buy a similar product from another firm. If a monopolistic competitor raises its price, it will not lose as many customers as would a perfectly competitive firm, but it will lose more customers than a monopoly would.
At a glance, the demand curves faced by a monopoly and monopolistic competitor look similar—that is, they both slope down. Still, the underlying economic meaning of these demand curves is different because a monopolist faces the market demand curve and a monopolistic competitor does not.
Cellular Competition

Recall that monopolistic competition refers to an industry that has more than a few firms that each offer a distinguished product. The Canadian cellular industry is one such market. With a history dating back as far as Alexander Graham Bell’s invention of the telephone in 1876, the Canadian cellular industry now has a number of large firms including Rogers, Telus, and Bell. What about Fido, Koodo, and Virgin Mobile? They are owned by Rogers, Telus, and Bell, respectively. While this market has some similarities to an Oligopoly (which we will not explore in this course), it is often classified as a monopolistic competition.
Consider what you would do if your monthly cell phone bill increased by $2. Would you switch to another company? Likely not. This means that the cellular market is certainly not perfectly competitive as cell phone companies have some ability to change prices. Therefore, the demand faced by each of the cellular companies will be more elastic than market demand, but not perfectly elastic. Let’s explore how these monopolistic competitive firms set prices.
How a Monopolistic Competitor Chooses Price and Quantity
To explore monopolistic competition, let’s consider Rogers, one of the Cellular companies in the market. Rogers faces a downward sloping demand curve and has ATC and MC curves similar to the ones we have seen before.
The monopolistically competitive firm decides on its profit-maximizing quantity and price similar to the way that a monopolist does. Since they face a downward sloping demand curve, the same considerations about how elasticity affects revenue are relevant, and the firm will maximize profits where MR = MC when P > MR.
Step 1. Rogers determines its profit-maximizing level of output. This will occur where MR = MC. Two situations are possible:
- If the firm is producing at a quantity of output where marginal revenue exceeds marginal cost, then the firm should keep expanding production, because each marginal unit is adding to profit by bringing in more revenue than cost. In this way, the firm will produce up to the quantity where MR = MC.
- If the firm is producing at a quantity where marginal costs exceed marginal revenue, then each marginal unit is costing more than the revenue it brings in, and the firm will increase its profits by reducing the quantity of output until MR = MC.
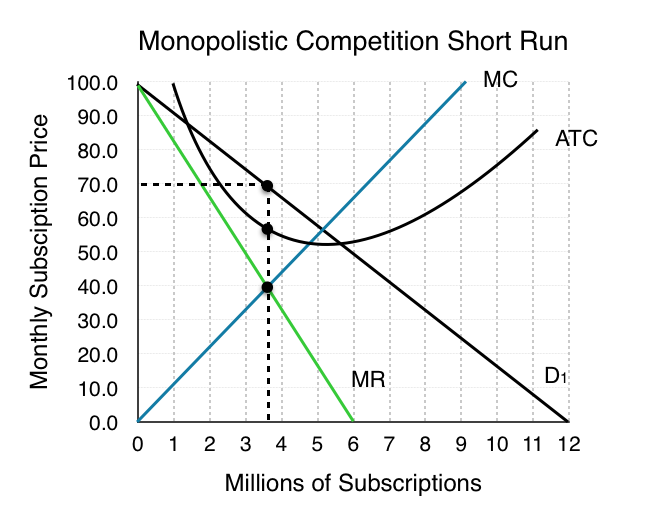
In this example, MR and MC intersect when Rogers has 3.6 million subscribers.
Step 2. Rogers decides what price to charge. When the firm has determined its profit-maximizing quantity of output, it will behave like a monopoly and charge the maximum it can at the quantity. On the graph, this process can be shown as a vertical line reaching up through the profit-maximizing quantity until it hits the firm’s perceived demand curve. For Rogers, this occurs at a price of $70/month.
Monopolistic Competitors and Entry
Consider the profits of Rogers at equilibrium quantity of 3.6 million subscribers:
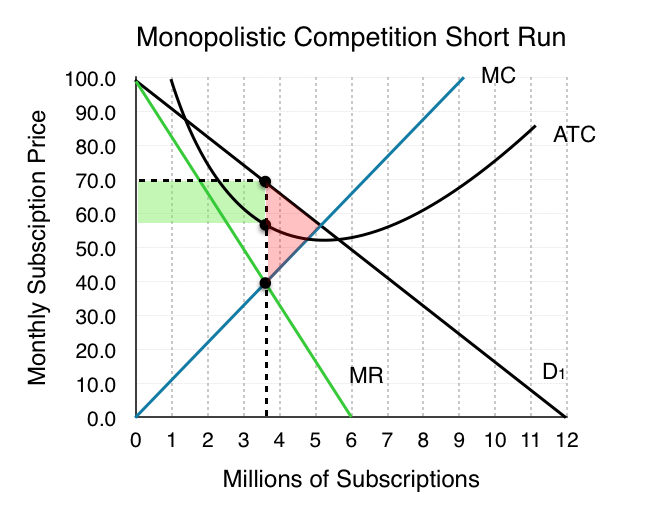
At a price of $70/month, ATC is only $60 and Rogers’ profit is $36 million. ($10 profit/subscriber) Notice that this market creates a deadweight loss equal to the red area since the equilibrium quantity is less than what would occur in competitive equilibrium (5 million subscriptions).
Remember that in monopolistic competition, there are few barriers to entry. Since Rogers is earning positive economic profits, other firms will be tempted to enter the market.
The entry of other firms into the same general market shifts the demand curve faced by a monopolistically competitive firm. As more firms enter the market, the quantity demanded at a given price for any particular firm will decline, and the firm’s perceived demand curve will shift to the left. As a firm’s perceived demand curve shifts to the left, its marginal revenue curve will also shift to the left. The shift in marginal revenue will change the profit-maximizing quantity that the firm chooses to produce since marginal revenue will then equal marginal cost at a lower quantity.
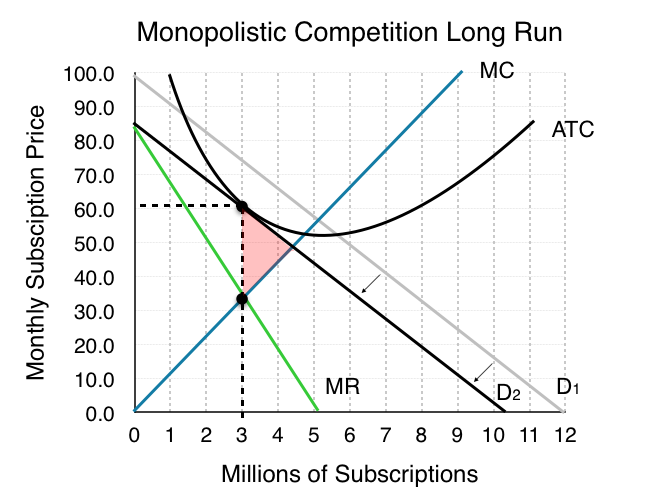
When will this shifting stop? When profits are 0. As long as P > ATC firms will continue to enter the market, and demand will continue to shift inward. As shown in Figure 8.4d, this occurs when P = ATC and MR = MC. This specific point happens when Demand is tangent to ATC, because only when this is true can P = ATC, given that ATC is downward sloping (recall that the MC curve passes through ATC at the minimum point of ATC, and note that the minimum point of ATC is at a quantity higher than that produced by the monopolistically competitive firm).
What about the social surplus? Although profits are now 0, a deadweight loss persists. This is because, unlike perfect competition, P > MR, which also means that P > MC. Since consumers’ willingness to pay is greater that the marginal cost of the firm, market failure continues. Remember that a key reason for this is the firms’ inability to charge more that one price. Notice also that ATC is not at a minimum. This is the price the market pays for variety since the aggregate market does not ensure the most efficient production when there is slight differentiation in products.
The Benefits of Variety and Product Differentiation
Even though monopolistic competition does not provide efficiency, it does have benefits of its own. Product differentiation is based on variety and innovation. Many people would prefer to live in an economy with many kinds of clothes, foods, and car styles; not in a world of perfect competition where everyone will always wear blue jeans and white shirts, eat only spaghetti with plain red sauce, and drive an identical model of car. Many people would prefer to live in an economy where firms are struggling to figure out ways of attracting customers by methods like friendlier service, free delivery, guarantees of quality, variations on existing products, and a better shopping experience.
Economists have struggled, with only partial success, to address the question of whether a market-oriented economy produces the optimal amount of variety. Critics of market-oriented economies argue that society does not really need dozens of different athletic shoes or breakfast cereals or automobiles. They argue that much of the cost of creating such a high degree of product differentiation, and then of advertising and marketing this differentiation, is socially wasteful—that is, most people would be just as happy with a smaller range of differentiated products produced and sold at a lower price. Defenders of a market-oriented economy respond that if people do not want to buy differentiated products or highly advertised brand names, no one is forcing them to do so. Moreover, they argue that consumers benefit substantially when firms seek short-term profits by providing differentiated products. This controversy may never be fully resolved, in part because deciding on the optimal amount of variety is very difficult, and in part because the two sides often place different values on what variety means for consumers.
How does advertising impact monopolistic competition?

The Canadian economy spent about $12.22 billion on advertising in 2016, according to statista.com.
Advertising is all about explaining to people, or making people believe, that the products of one firm are differentiated from the products of another firm. In the framework of monopolistic competition, there are two ways to conceive how advertising works: either advertising causes a firm’s perceived demand curve to become more inelastic (that is, it causes the perceived demand curve to become steeper), or advertising causes demand for the firm’s product to increase (that is, it causes the firm’s perceived demand curve to shift to the right). In either case, a successful advertising campaign may allow a firm to sell either a greater quantity or to charge a higher price, or both, and thus increase its profits.
However, economists and business owners have also long suspected that much of the advertising may only offset other advertising. Economist A. C. Pigou wrote the following back in 1920 in his book, The Economics of Welfare:
It may happen that expenditures on advertisement made by competing monopolists [that is, what we now call monopolistic competitors] will simply neutralise one another, and leave the industrial position exactly as it would have been if neither had expended anything. For, clearly, if each of two rivals makes equal efforts to attract the favour of the public away from the other, the total result is the same as it would have been if neither had made any effort at all.
Summary
Monopolistic competition refers to a market where many firms sell differentiated products. Differentiated products can arise from characteristics of the good or service, location from which the product is sold, intangible aspects of the product, and perceptions of the product.
If the firms in a monopolistically competitive industry are earning economic profits, the industry will attract entry until profits are driven down to zero in the long run. If the firms in a monopolistically competitive industry are suffering economic losses, then the industry will see an exit of firms until economic profits are driven up to zero in the long run.
A monopolistically competitive firm is not efficient because it does not produce at the minimum of its average cost curve or produce where P = MC. Thus, a monopolistically competitive firm will tend to produce a lower quantity at a higher cost and charge a higher price than a perfectly competitive firm.
Monopolistically competitive industries do offer benefits to consumers in the form of greater variety and incentives for improved products and services. There is some controversy over whether a market-oriented economy generates too much variety.
The following table summarizes the three types of market structure we have examined. The fourth, oligopoly, is not in the scope of this course.
Market type |
Description |
MR v P |
P v MC |
LR Π |
LR ATC |
DWL |
| Perf. Comp. | Many sellers, identical goods, free entry in LR | MR = P | P = MC | Π = 0 | ATCLR = ATCMIN | No |
| Monopoly | Single seller, barriers to entry | MR < P | P > MC | Π > 0 | ATCLR > ATCMIN | Yes |
| Monopolistic Comp. | Many sellers, differentiated products, free entry in LR | MR < P | P > MC | Π = 0 | ATCLR > ATCMIN | Y |
Glossary
- Differentiated Products
- a product that is perceived by consumers as distinctive in some way
- Monopolistic Competition
- many firms competing to sell similar but differentiated products
Exercises 8.4
The following TWO questions refer to the diagram below, which illustrates the demand, marginal revenue, and relevant cost curves for a monopolistically competitive firm.
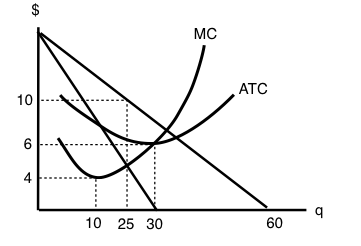
1. How many units of output should this firm produce, in order to maximize profits?
a) 10.
b) 25.
c) 30.
d) 60.
2. In the long run, what price will this firm charge for its output?
a) $10.
b) A price less than $10 and greater than $6.
c) $6.
d) A price less than $6 and greater than $4.
The following TWO questions refer to the diagram below.
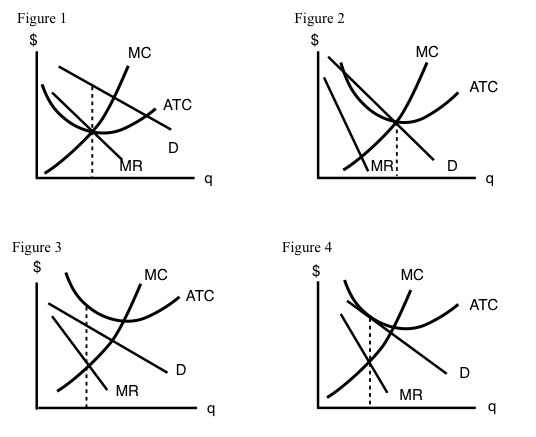
3. Which of the four diagrams illustrates a long run equilibrium for a monopolistically competitive firm?
a) Figure 1.
b) Figure 2.
c) Figure 4.
d) Figures 2 and 4.
4. Which of the four diagrams illustrates a monopolistically competitive firm able to make positive economic profits in the short run?
a) Figure 1.
b) Figure 2.
c) Figures 1 and 2.
d) None of the above.
5. Which of the following statements about the comparison between monopolistic competition in the long run and monopoly in the long run is FALSE?
a) Marginal revenue is less than price for both monopoly and monopolistic competition.
b) Price is greater than marginal cost for both monopoly and monopolistic competition.
c) Price is greater than average total cost for both monopoly and monopolistic competition.
d) Neither monopoly or monopolistic competition produce at the minimum point of the average total cost curve.
6. Which of the following statements about the comparison between perfect competition and monopolistic competition is TRUE?
I. Both perfectly competitive and monopolistically competitive firms produce where marginal revenue equals marginal cost.
II. Both perfectly competitive and monopolistically competitive firms produce where price equals marginal cost.
III. Both perfectly competitive and monopolistically industries are characterized by free entry and zero profits in the long run.
a) I only.
b) I and III only.
c) I and II only.
d) I, II and III.
