4.9 Tariffs
Learning Objectives
By the end of this section, you will be able to:
- Describe how the market changes when it is open to the world market
- Explain the impact of tariffs to domestic consumers, producers, and government
- Understand and show why a tariff causes a deadweight loss

The Wooden Wall to Exports
Canadian lumber is one of the most well-known Canadian exports next to maple syrup and bacon. This means relations with Canada’s biggest trading partner, the United States, can substantially help or harm the industry. An expired deal in 2015, with a one-year grace period, means that renegotiations will impact lumber sales for years to come. The problem – the U.S. may increase its tariff (a common trade policy) from 15% to up to 25%, in response to what they say are unfair subsidies from the Canadian government.
How would this increase affect consumers? How would it affect American and Canadian producers? We will explore the incidence of trade policy, specifically tariffs, in this section.

In Topic 2, we briefly looked at the Production Possibility Frontier, a trade model that looks at the production of two goods. As we know, trade is far more complicated than that. With our supply and demand model and the policy tools we have explored, we can analyze a piece of this complex topic by looking at the impact of trade policy on each domestic.
Trade policy is often motivated by the desire to protect the domestic industry and workers since imports are typically cheaper than domestic counterparts. Imports create unwanted competition for the firms and give domestic jobs to other countries. The preventative policy can take a number of forms, from direct price controls to quotas or taxes on imported goods. In this section, we will focus on one of the more common forms of trade policy: tariffs.
Tariffs
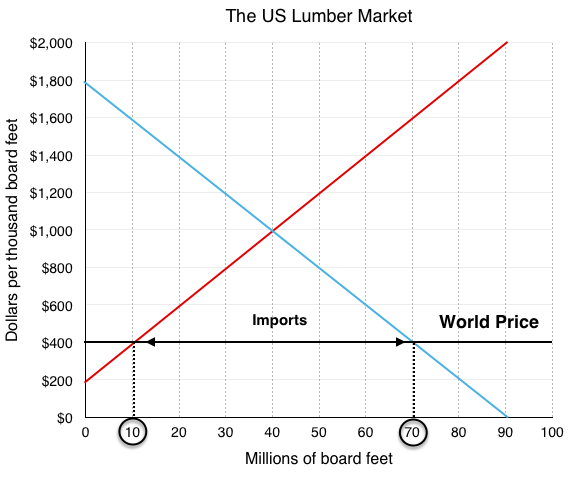
A tariff is defined as a tax on imported goods. The easiest way to show how it works is with an example. Below, we have continued the example from the beginning of this section: the US lumber market. In the domestic market, the domestic equilibrium price and quantity are $1,000/board feet, and 40 million board feet, respectively. This is denoted as PD = $1,000 and QD = 40 million. In this case, the world price, or PW is substantially lower than the domestic price. While this is not always the case, there is no incentive to import if PW is greater than PD (This model assumes that imports are identical to domestic products in every respect except for price).
With access to imports with prices as low as $400, American consumers will purchase significantly more lumber. Their quantity demanded will increase to 70 million units (40 million more than the domestic equilibrium). These consumers are significantly better off with the new access to cheap lumber.
Domestic producers, on the other hand, lose a large degree of surplus from the imports. Whereas before they supplied 40 million board feet of lumber at $1000, now they can only supply 10 million board feet. This is because many domestic firms are no longer able to compete with the foreign production and will either leave the market or decrease production.
With domestic production of 10 million and total production of 70 million, 60 million board feet of lumber are imported from Canada.
With such a significant portion of lumber production being imported, the government may choose to introduce a protectionist policy to restrict foreign competition, due to severe pressure from domestic producers. One important clarification about our model at this point is that the only surplus America cares about is domestic. Any producer surplus to Canadian firms is irrelevant in American decision making.
Suppose the government enacts a $400 tariff on imports to restrict competition. A tariff is a tax imposed on important goods or services. This creates an equilibrium price equal to $800 (world price + the $400 tariff). While this price is still below the domestic equilibrium, more domestic firms are now able to compete. In the new equilibrium, total quantity is 50 million board feet, 30 million of which are domestic. This means that imports have dropped from 60 million to 20 million board feet.
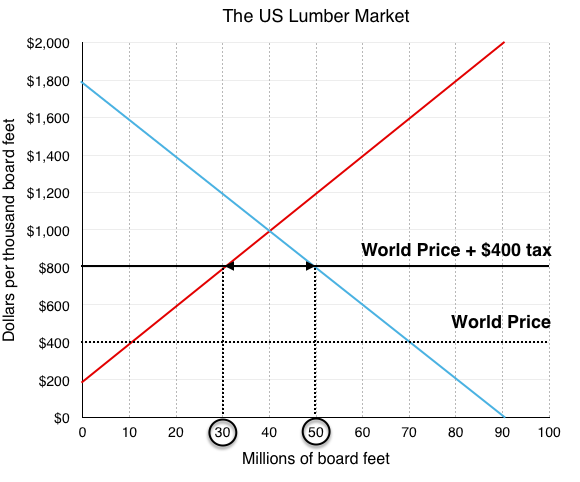
In this situation, domestic producers are better off, as they are now able to sell 20 million more units. Consumers, on the other hand, are worse off, as they face a higher price. The government is better off with revenue collected by the tariff. In Figure 4.10c, we have broken down the effects of the tariff on each of the market players.
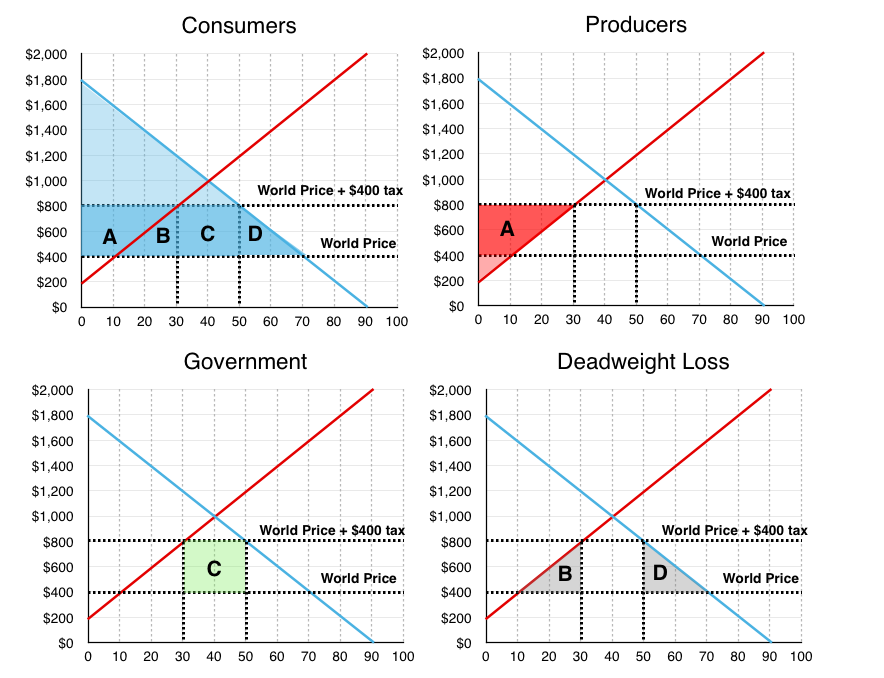
Consumers
Consumers originally purchased 70 million board feet at $400 each, and now purchase 50 million at $800 each.
The change in surplus is represented by a decrease in areas A + B + C + D
Producers (Domestic)
Domestic producers now sell 20 million more units for $400 more than previously (note that the tariff only applies to imports, not domestic production).
The change in surplus is represented by an increase in area A
Government
The government charges a $400 tariff on the 20 million remaining imported board feet.
The change in surplus is represented by an increase in area C
Net Result
The government and producers gained areas A and C as a result of the tariff, but consumers lost areas A, B, C, and D. Overall, the policy created a deadweight loss equal to area B and D.
Conclusion
In chapter 4, we looked at a number of policies that resulted in gains for some market players, but overall deadweight loss for society. We explored price and quantity controls, taxes and subsidies, and trade policy. In all cases except for subsidies, the policies reduced equilibrium quantity to a point where MB > MC. This means that although the net marginal benefits from an additional unit were greater than the net marginal costs, the policy was restricting the market from returning to equilibrium
Why would the government implement policies that decrease market surplus? One possible reason we addressed is politics. In our example of trade policy, the domestic producers of lumber pressured the government to increase protection against foreign competition. This protectionist stance is quite common. Though trade is beneficial for society overall, many workers can lose jobs in the short run to foreign competition. In addition, when the people who stand to gain from a policy are concentrated and vocal, the majority is often ignored.
One of the most common reasons for policy, which we will discuss in detail in Topic 5, is that the market does not take into account all the costs it imposes on society. This does not mean the model is flawed, we just need to add another layer: externalities.
Glossary
- Domestic Equilibrium
- The equilibrium acheived by a market if it is not open to trade
- Tariff
- a tax imposed on imported goods or services
- World Price
- the equilibrium price of the world market
Exercises 4.9
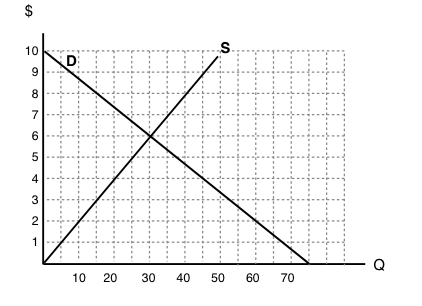
Use the diagram below, illustrates the domestic supply curve (SD) and demand curve for a good, to answer the following THREE questions. Assume that the world price is equal to $20 per unit, and initially there are no trade restrictions in place.
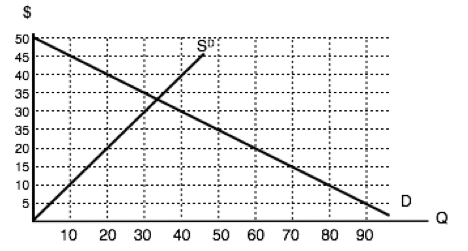
1. If a tariff of $10 per unit is introduced in the market, then, at the new equilibrium:
a) Consumers will pay a price of $20, quantity sold will be 60 units, of which 40 are imported.
b) Consumers will pay a price of $30, quantity sold will be 40 units, of which 30 are produced domestically.
c) Consumers will pay a price of $20, quantity sold will be 60 units, of which none are produced domestically.
d) Consumers will pay a price of $30, quantity sold will be 40 units, of which none are imported.
2. If a tariff of $10 per unit is introduced in the market, then the government will raise ____ in tariff revenue.
a) $400.
b) $300.
c) $200.
d) $100.
3. If a tariff of $10 per unit is introduced in the market, then the deadweight loss will equal:
a) $50.
b) $100.
c) $150.
d) None of the above.
The following two questions refer to the diagram below, which illustrates the domestic supply curve (SD) and demand curve for a good. Assume that the world price is equal to $5 per unit, and that initially there are no trade restrictions.
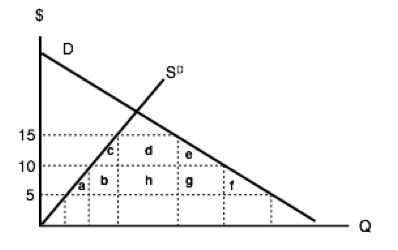
4. If a tariff of $10 per unit of imports is introduced, which area represents the deadweight loss?
a) a + f.
b) c + e.
c) a + b + c + e + f + g.
d) a + b + d + h + g + f.
5. If a tariff of $10 per unit of imports is introduced, which area represents the tariff revenue raised?
a) d.
b) d + h.
c) h.
d) b + h + g.
Use the diagram below – which illustrates the domestic supply and demand curves for a good – to answer the following TWO questions. Assume that the world price is equal to $2.
6. If there are no trade restrictions in place, what will be the equilibrium quantity of IMPORTS?
a) 40.
b) 50.
c) 60.
d) None of the above.
7. If a tariff of $2 is introduced, then:
a) Imports will decrease and social surplus will increase.
b) Imports will decrease and consumer surplus will increase
c) Imports will decrease and domestic producer surplus will increase.
d) All of the above will occur.
8. The diagram below illustrates the domestic supply curve (SD) and demand curve for a good. Assume that the world price is equal to $5 per unit.
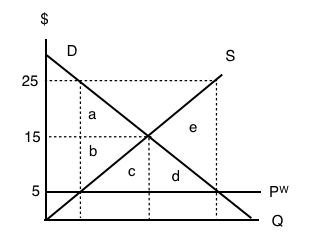
If imports of this good are banned altogether, which area represents the deadweight loss?
a) a + b.
b) e.
c) c+d.
d) a + b + c + d + e.
9. The diagram below illustrates the domestic supply curve (SD) and demand curve for a good. Assume that the world price is equal to $10 per unit, and initially there are no trade restrictions.
If a tariff of $10 per unit is introduced, by how much to imports decrease?
a) 10 units.
b) 20 units.
c) 30 units.
d) 40 units.
