3.6 Equilibrium and Market Surplus
Learning Objectives
By the end of this section, you will be able to:
- Explain equilibrium, equilibrium price, and equilibrium quantity
- Understand how supply and demand bring markets back to equilibrium
- Analyze the effect of supply and demand shocks to market price and quantity
- Calculate market surplus given supply and demand curves

Who Sets the Price?
Have you ever been to a busy street corner and seen a row of fast food vendors lined up beside each other? Oftentimes, the vendors have little to no branding, so the stands are relatively homogeneous. How do you decide where to buy? Assuming the quality looks about the same, you might go for the cheapest option.
What about the vendors? Knowing that consumers will purchase the cheapest option, they will avoid setting their price above their competitors, and may lower prices to sell more. As long as the price is above thier costs there is still an opportunity to undercut the competition. This will cause a race to the bottom until the price is at the equilibrium level.
Who sets the price? With many different firms and consumers, no individual has the power to influence price. But collectively, their actions determine it. This brings us to the core conclusion of this chapter: market price is determined by the interactions between supply and demand.
Equilibrium
Equilibrium is formally defined as a state of rest or balance due to the equal action of opposing forces. In economics, these forces are supply and demand. As we will see, when supply and demand are not in balance, economic forces will work until the balance is restored.
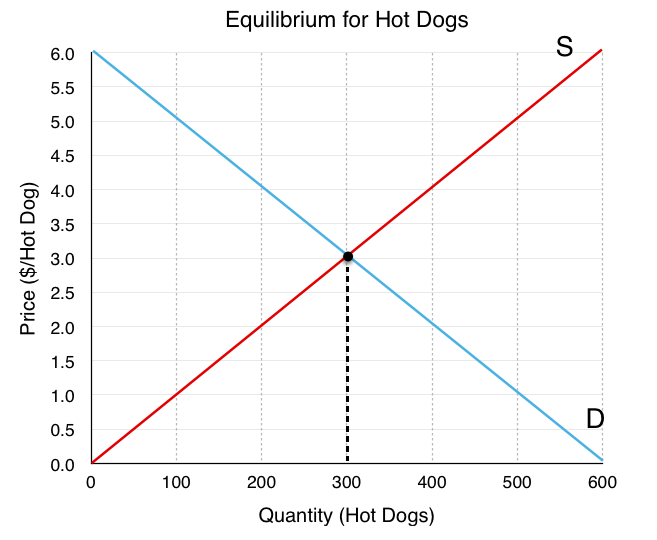
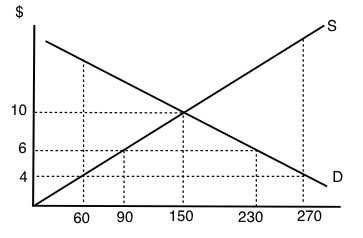
Figure 3.6a shows the competitive market for hot dogs, with aggregate demand in blue and aggregate supply in yellow. As price rises, quantity demand for hot dog falls, and quantity supplied rises. There are two important points on this diagram. First is equilibrium quantity (QE). QE is where the quantity supplied is equal to the quantity demanded. It is important to recognize this value and the mechanism that leads us there. There is only one price that corresponds with equilibrium quantity, and that is equilibrium price (PE). The question remains, how do we arrive at equilibrium? Let’s first consider what occurs when the price is too high.
When Price is Higher than Equilibrium
What if the price is above our equilibrium value? How will the equal and opposite forces bring it back to equilibrium? There are a number of reasons why the price may be too high. One common example that we will explore in greater depth in Topic 4 is the price floor. Regardless of the cause, we see in Figure 3.6b that a price above equilibrium will result in quantity supplied being greater than quantity demanded. This excess supply is also known as a surplus. There are too many sellers who are enticed by the high price, and not enough buyers. Consider a hot dog vendor, Paul, in this situation. Though Paul would be happy to receive the high price of $5 from the customers who buy the good, he will find that he will be unable to sell all the hot dogs he cooks, since 500 hotdogs are being made, and only 100 sold. This will result in wasted product, and a surplus of 400 hotdogs in the market. If vendors were forced to stay in this market, the quantity supplied would fall to 100, as vendors would quickly reduce production to what customers are willing to purchase.
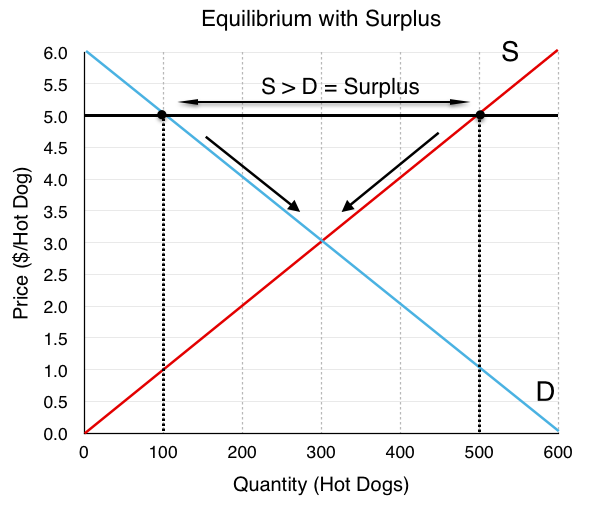
In order to sell all his hot dogs, Paul could start offering the hot dogs for a cheaper price until he is able to sell everything he produces. In this case, every vendor has the incentive to drop their price, since (all else equal) consumers will purchase the product with the lowest price. As price falls, two things occur:
- There is a decrease in quantity supplied (a movement along the supply curve)
- There is an increase in quantity demanded (a movement along the demand curve)
Notice that both supply and demand are forces that bring the market back to equilibrium. When price is at equilibrium of $3, no vendor has the incentive to decrease their price, since this would result in them selling hotdogs at a loss.
When Price is Lower than Equilibrium
What if price is lower than equilibrium? This is depicted in Figure 3.6c with a market price of $1.0. When price is too low, the quantity demanded is greater than quantity supplied. This excess demand is known as a shortage. In this situation, the low price causes an excess of buyers. When we have a shortage, the consumers who are able to buy the good are happy, but due to the low price, not enough will be produced and not every consumer will get thier hands on a hotdog.
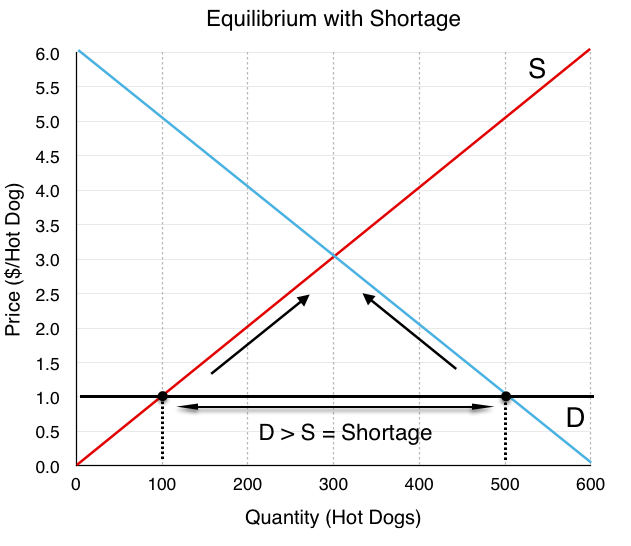
At $1.0, 500 hot dogs are demanded, but only 100 are being produced. This means there are many consumers who are willing to pay more than the $1 for a hotdog, but are unable to find one. So, how do the 100 hot dogs get allocated? Perhaps it will be on a first come first serve basis, but frustrated consumers will likely start to offer a higher price to the hot dog stands and outbid other consumers. This will drive price back to the equilibrium level. As a price rises, two things occur:
- There is an increase in quantity supplied (a movement along the supply curve)
- There is a decrease in quantity demanded (a movement along the demand curve)
Again, both supply and demand are forces that bring the market back to equilibrium.
External Market Shocks & Equilibrium
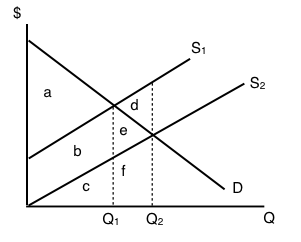
In Topic 3.3 and 3.5, we explored the determinants of demand and supply, and examined the impact of different external shocks on the demand and supply curve. How will these shocks affect equilibrium? Suppose the price of a hamburger, a substitute for hot dogs, rises. We learned in Topic 3.3 that when the price of a substitute increases, our demand for hot dogs will increase. In Figure 3.4d below, we see the initial effects of the demand shift. (recall that a demand shift changes the relationship between quantity demanded and quantity supplied at every point!)
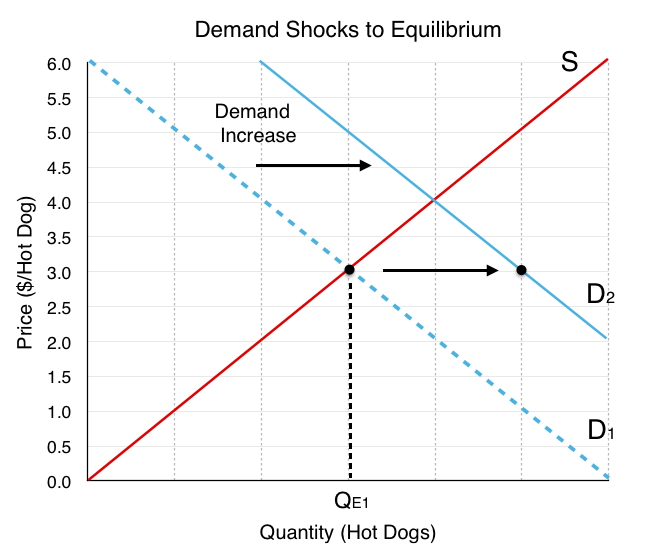
Whereas supply and demand were in equilibrium at QE1 at the initial price of $3, the demand shift has caused QD > QS. As discussed, this causes a shortage (see left side of Figure 3.6e). Like before, the equal and opposite effects of supply and demand will cause a movement along both the supply and demand curve until we return to our equilibrium at QE2 (right side of Figure 3.6e).
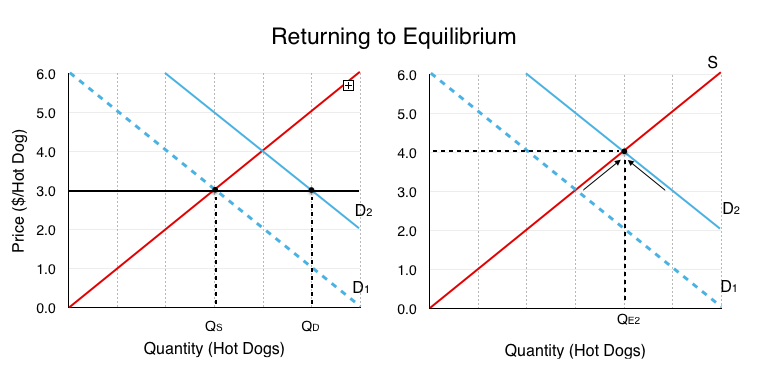
Notice the effects of the demand shift on our overall equilibrium. Both equilibrium price and quantity are now higher. Understanding these final effects is extremely important to understanding the supply and demand model.
What if two curves shift?
We have viewed the separate effects of demand and supply shifts, but what happens if both shift at once? Assume that in addition to an increase in the price of hamburgers, there is a decrease in the number of hot dog stands in the market, causing a decrease in supply. How do these two shocks change our equilibrium? The effects are depicted in Figure 3.6f.
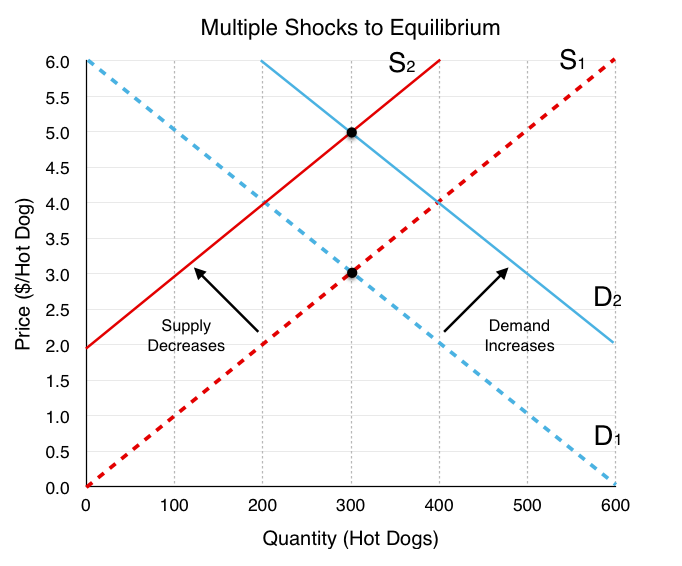
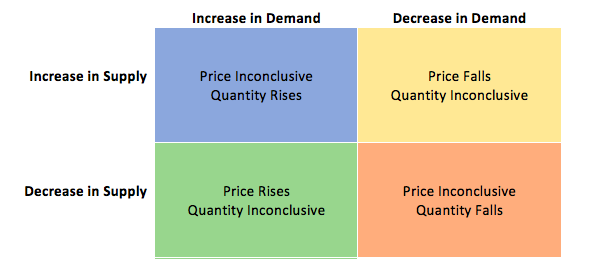
Our two effects, an increase in demand and a decrease in supply, each have thier own effects. The increase in demand causes both the price and quantity to increase, whereas the decrease in supply causes the price to increase and quantity to decrease. What does this mean for our equilibrium? Summarizing these effects:
Price: Demand causes increase, Supply causes increase.
Quantity: Demand causes increase, Supply causes decrease.
If both the supply and demand shifts are causing the price to rise, our prices will clearly rise; however, the change in quantity is not so simple. If one shift causes quantity to rise and another causes it to fall, what is the overall effect? In Figure 3.6f, there appears to be no change in quantity, but this is because the two shifts are depicted as equal and opposite. In reality, unless we know the magnitude of the curve shifts, we cannot say much about the change in quantity. In other words, the resulting quantity change is inconclusive. Figure 3.6g summarizes the results from different combinations of curve shifts.
Remember, the best way to understand these impacts is through practice not memorization.
Market Surplus
In this topic, we have outlined the importance of using consumer surplus and producer surplus to measure net benefits for consumers and producers. Recall consumer surplus is the difference between what consumers are willing to pay and what they actually pay, whereas producer surplus is the difference between what the producer is paid and the marginal costs of production. Oftentimes, we want to look holistically at the market and calculate market/private surplus, a measure of the net benefits accruing to all participants in the market. This includes our consumer surplus, producer surplus, and, as we will explore in Topic 4, government revenue/expenditure.
For our hot dog market, using our market surplus definition of consumer surplus + producer surplus + government, we can see in Figure 3.6g that the market surplus is equal to the green and yellow areas.
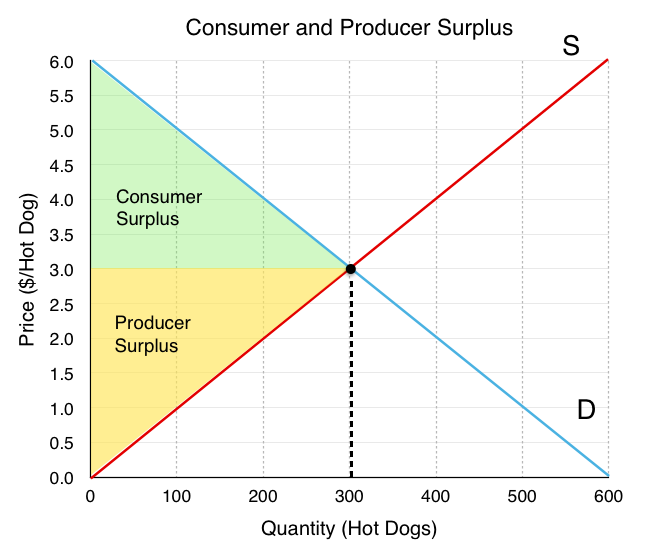
To calculate market surplus, simply find the area of the shaded regions.
The area of a triangle is (base x height)/2.
Consumer surplus (green)= (300 x 3)/2 = $450
Producer surplus (yellow) = (300 x 3)/2 = $450
Market Surplus = $450 + $450 = $900
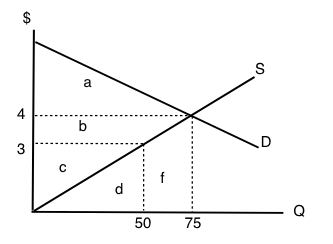
While adding up the surplus of every party is simple with just consumers and producers, it gets more complicated as more players enter the market. In Figure 3.6i, a different process is outlined. Since the demand curve is the marginal benefit curve, it represents the marginal benefits at each quantity level. (We know that this is distributed between consumers and producers) Therefore, the area under our marginal benefit curve represents our total market benefits. Likewise, the supply curve is the marginal cost curve and represents the marginal costs at each quantity level. The area under the marginal cost curve represents our total market costs.
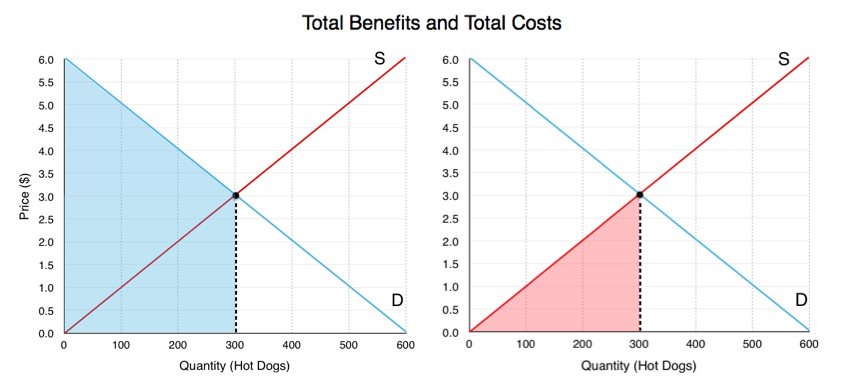
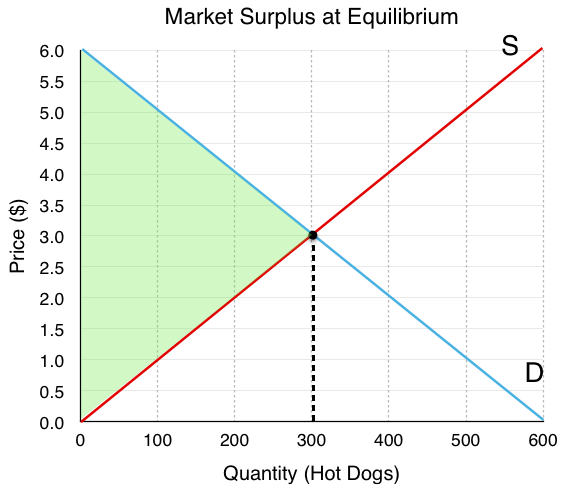
With our total benefits (blue) and our total costs (red), we can easily determine our total market surplus is the green area in Figure 3.6j below. To calculate:
Total Benefits: $1350
Total benefits correspond to the blue area in Figure 3.6i. This area is made up of a rectangle with dimensions 300 x $3 and a triangle with base 300 and height of $3. The area is (300 x $3) + (300 x $3)/2.
Total Costs: $400
Total costs correspond to the red area in Figure 3.6i. This area is made up of a triangle with a base of 300 and height of $3. The area is (300 x $3)/2.
Total Market Surplus: $900
Total market surplus can be calculated as total benefits – total costs. Alternatively, we can calculate the area between our marginal benefit and marginal cost, constrained by quantity. This is the equivalent of finding the difference between the marginal benefits and the marginal costs at each level of production. In Figure 3.6j, this is the green area, with base of $6 and height of 300.
Market Surplus and Efficiency
Market surplus is certainly a useful way to measure the net benefits to players in the market, but it can also be used to measure efficiency. By comparing market surplus in different situations, we can confirm whether an equilibrium is efficient. (Recall efficiency is a situation where we cannot make one person better off without making another worse off.) With this in mind, we can infer that an equilibrium is efficient if it maximizes market surplus.
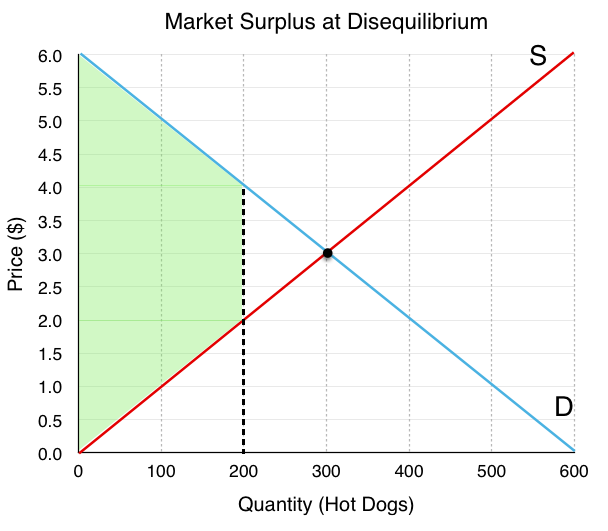
In Figure 3.6k, we have a market that is producing 200 hot dogs – 100 less than our equilibrium. Is this efficient? Well, if we calculate the green shaded region below, we find that it is $800, which is $100 less than before. By simply increasing production back to our original level, we make both consumers and producers better off without making anyone worse off. The difference in green regions from Figure 3.6j and Figure 3.6k is called Deadweight Loss, because it is cost to society made by an inefficiency. As a whole, the market could be made better off by increasing quantity.
Summary
In this section we completed the construction of our competitive market model, bringing together supply and demand. The equal and opposite forces of supply and demand lead the market to a single equilibrium price and quantity, which is generally self sustaining. Looking at shocks introduced in earlier sections, we saw that external events can change our equilibrium, and combinations of shocks can sometimes lead to ambiguous effects. Using consumer and producer surplus, we developed a criteria for efficiency – market surplus – that can be used to calculate deadweight loss.. Market surplus and deadweight loss will be a key focus of Topic 4, where we look at the impact of government intervention in the market.
Glossary
- Deadweight Loss
- A cost to society created by a market inefficiency, occurs when quantity is different from equilibrium quantity
- Equilibrium Price
- the price where quantity demanded is equal to quantity supplied
- Equilibrium Quantity
- the quantity at which quantity demanded and quantity supplied are equal for a certain price level
- Equilibrium
- the situation where quantity demanded is equal to the quantity supplied; the combination of price and quantity where there is no economic pressure from surpluses or shortages that would cause price or quantity to change
- Excess Demand
- at the existing price, the quantity demanded exceeds the quantity supplied; also called a shortage
- Excess Supply
- at the existing price, quantity supplied exceeds the quantity demanded; also called a surplus
- Market Surplus
- the total welfare to society, includes producer surplus, consumer surplus, and government expenditure
- Shortage
- at the existing price, the quantity demanded exceeds the quantity supplied; also called excess demand
- Surplus
- at the existing price, quantity supplied exceeds the quantity demanded; also called excess supply
Exercises 3.6
1. Suppose that – at a given level of some economic activity – marginal benefit is greater than marginal cost. The economic agent in question (the decision-maker) can increase net benefits by increasing the level of the activity, for which of the following reasons?
a) Total costs will fall by more than total benefits.
b) Total benefits will rise by more than total costs.
c) Neither a) nor b).
d) Either a) or b).
2. Which of the following statements is TRUE?
a) Consumer surplus is the difference between the minimum amount a consumer is willing to pay, and what he or she actually pays.
b) Producer surplus is the difference between the amount of money a seller is paid, and the maximum amount that he or she needs to be paid.
c) Market surplus is equal to the sum of consumer surplus and producer surplus.
d) All of the above are true.
The following TWO questions refer to the supply and demand curve diagram below.
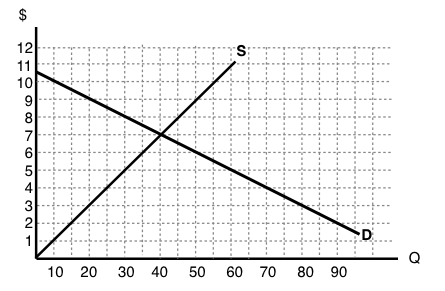
3. The equilibrium price in this market is equal to:
a) $6 per unit.
b) $5 per unit.
c) $4 per unit.
d) $3 per unit.
4. At a price of $8, there is:
a) Excess demand (a shortage) of 25 units.
b) Excess demand (a shortage) of 15 units.
c) Excess supply (a surplus) of 15 units.
d) Excess supply (a surplus) of 25 units.
5. Which of the following statements about consumer surplus and producer surplus is TRUE?
a) Consumer surplus is equal to the area under the demand curve.
b) Producer surplus is equal to the area under the supply curve.
c) Both producer and consumer surplus are equal to price multiplied by quantity.
d) None of the above statements is true.
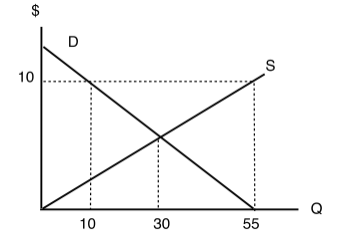
6. Consider the supply and demand curve diagram below.
If the price of this good is $6, then:
a) There is an excess demand (a shortage) equal to 210 units.
b) There is an excess demand (a shortage) equal to 140 units.
c) There is an excess supply (a surplus) equal to 210 units.
d) There is an excess supply (a surplus) equal to 140 units.
7. When deciding how much of a particular good to purchase, a consumer should:
a) Keep buying more units until the total benefits equal the total costs.
b) Always buy at additional unit if its marginal net benefit is positive.
c) Keep buying more units if marginal cost is greater than marginal benefit.
d) Always buy at additional unit if its marginal benefit is positive.
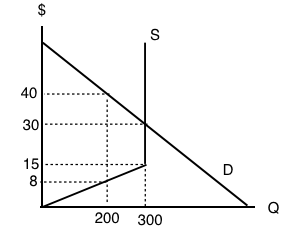
8. Refer to the supply and demand diagram below.
At the equilibrium price in this market, consumer surplus is equal to area ___ and producer surplus is equal to area ____
a) a + b; c.
b) a; b + c.
c) a + b; b + c.
d) a + b + c; d + f.
9. Which of the following statements about consumer and producer surplus is TRUE?
a) Consumer surplus is equal to the maximum amount a consumer is willing to pay for a good, minus what the consumer has to pay for the good.
b) Producer surplus is equal to the amount received from selling a good, minus the minimum amount the seller needed to receive, in order to be willing to sell the good.
c) Both a) and b) are true.
d) Neither a) nor b) are true.
The following TWO questions refer to the supply and demand diagram below.
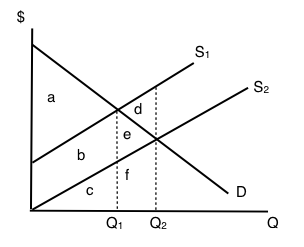
10. Which of the following COULD explain the shift in supply from S1 to S2.
a) An increase in the cost of producing the good.
b) A decrease in the number of sellers in the market.
c) Both a) and b).
d) Neither a) nor b).
11. If supply is S2, which area represents MARKET surplus?
a) a
b) a + b.
c) a + b + e.
d) We need to know price in order to determine market surplus.
12. Consider the supply and demand diagram drawn below.
Suppose that demand is initially D1, but, following a change in consumer preferences, demand shifts to D2. Note that the two demand curves are parallel. Which of the following statements is TRUE?
a) Demand increases by 30 units.
b) Quantity demanded increases by 30 units.
c) Equilibrium quantity increases by 30 units.
d) More than one of the above statements is true.
13. Suppose the equilibrium price of good X is $10 and the equilibrium quantity is 60 units. If the price of good X is $4:
a) The quantity demanded will be less than 60 units.
b) The quantity supplied will be more than 60 units.
c) There will be an excess demand for good X.
d) There will be an excess supply of good X.
14. All else equal, a decrease in the marginal cost of producing a good will result in:
a) A lower equilibrium quantity and a higher equilibrium price.
b) A lower equilibrium quantity and a lower equilibrium price.
c) A higher equilibrium quantity and a higher equilibrium price.
d) A higher equilibrium quantity and a lower equilibrium price.
The following TWO questions refer to the diagram below.
15. The equilibrium price is ____ the equilibrium quantity is _____.
a) $5; 30.
b) $7; 30.
c) $7; 40.
d) $8; 40.
16. If the marginal cost of producing this good rises by $3 at every output level, then the new equilibrium price will be _____.
a) There is insufficient information to calculate the new equilibrium price
b) $3.
c) $8.
d) $10.
17. Consider the supply and demand diagram drawn below.
What does the equilibrium price equal in this market?
a) $8.
b) $15.
c) $30.
d) $45.
18. Refer to the diagram below.
At a price of $10 per unit:
a) There is excess demand (a shortage) equal to 45 units.
b) There is excess supply (a surplus) equal to 45 units.
c) There is excess demand (a shortage) equal to 20 units.
d) There is excess supply (a surplus) equal to 20 units.
19. Consider the market for oranges. Suppose that both of the following occur simultaneously: (i) the price of apples (a substitute for oranges) decreases; and (ii) world-wide droughts reduce the harvest of oranges by 30%. Then, in the market for oranges we would expect:
a) The equilibrium price of oranges could either increase or decrease, but equilibrium quantity will definitely decrease.
b) The equilibrium quantity of oranges could either increase or decrease, but equilibrium price will definitely decrease.
c) The equilibrium price of oranges could either increase or decrease, but equilibrium quantity will definitely increase.
d) The equilibrium quantity of oranges could either increase or decrease, but equilibrium price will definitely increase.
20. Suppose that, following a decrease in the supply of good X, we observe that the price of good Y decreases. If no other curves have shifted, which of the following can we infer?
a) Good X is an inferior good.
b) Goods X and Y are complements.
c) Goods X and Y are substitutes.
d) None of the above.
21. In recent years there have been a couple of high profile cases of contamination of baby formula produced in China. As a result, many Chinese parents buy baby formula that is produced outside China. Which of the following accurately describes the likely effect of this on baby formula prices?
a) An increase in the price of baby formula produced in China and a decrease in the price of baby formula produced outside China.
b) A decrease in the price of baby formula produced in China and an increase in the price of baby formula produced outside China.
c) A decrease in the price of both baby formula produced in China and baby formula produced outside China.
d) An increase in the price of both baby formula produced in China and baby formula produced outside China.
22. Refer to the supply and demand diagram below.
If supply is S1, which area represents MARKET surplus?
a) a
b) a + b.
c) a + b + e.
d) We need to know price in order to determine market surplus.
23. Suppose that in the market for good X (a normal good), the following occur simultaneously: (i) consumer incomes increase and (ii) the price of oil (an input to the production of X) increases. Which of the following statements is TRUE?
a) The equilibrium price of X could either increase or decrease, but equilibrium quantity will definitely decrease.
b) The equilibrium quantity of X could either increase or decrease, but equilibrium price will definitely decrease.
c) The equilibrium price of X could either increase or decrease, but equilibrium quantity will definitely increase.
d) The equilibrium quantity of X could either increase or decrease, but equilibrium price will definitely increase.
24. Consider the supply and demand diagram below.
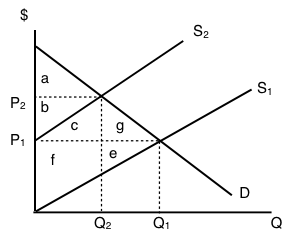
If supply decreases from S1 to S2, which area represents the change in PRODUCER surplus?
a) b + c – f.
b) a + b + c.
c) b – f – e.
d) c + f + g + e.
25. A recent news story reported that OPEC is expected to decrease the supply of oil next summer. Summer is traditionally a time of increased demand for oil because of the many families driving and flying to vacation sites. What would be the combined effect of these two activities on the summer market for gasoline?
a) An increase in the equilibrium price and the quantity.
b) An increase in the equilibrium price and an unpredictable change in the equilibrium quantity.
c) An unpredictable change in both the equilibrium price and the quantity.
d) An unpredictable change in the equilibrium price and a decrease in the equilibrium quantity.
26. Consider the supply and demand curves drawn below.
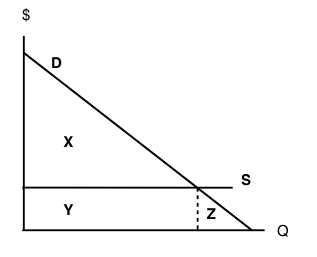
Given the equilibrium quantity, which area represents MARKET SURPLUS?
a) X + Y + Z.
b) X + Y.
c) X.
d) There is no market surplus.
27. Which of the following CANNOT result in an increase in price in a competitive market for a normal good?
a) An increase in income.
b) A decrease in the price of a complement to this good.
c) An increase in the price of a substitute for this good.
d) A decrease in the wages paid to workers who produce this good.
28. Consider the supply and demand curves illustrated below.
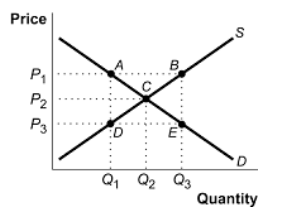
Which of the following statements is true?
a) At a price of P3, there is excess demand equal to the distance DE.
b) At a price of P3, there is excess demand equal to the distance BE.
c) At a price of P3, there is excess supply equal to the distance BE.
d) At a price of P3, there is excess supply equal to the distance DE.
29. Which of the following CANNOT result in a decrease in the equilibrium quantity sold of an inferior good?
a) An increase in the price of a substitute for the good.
b) An increase in consumer incomes.
c) An increase in wages paid to workers who produce the good.
d) An increase in the price of a complement for the good.
30. Which of the following statements is FALSE?
a) At the competitive equilibrium, market surplus is maximized.
b) At the competitive equilibrium, the marginal benefit to consumers equals the marginal cost to producers.
c) At the competitive equilibrium, social surplus is maximized if there are no externalities.
d) At the competitive equilibrium, it is possible to make at least one person better off without making anyone worse off.
31. A recent Health Canada report argued that there is a strong link between the consumption of steak and heart disease. At the same time, Canadian consumers’ incomes rose. If steak is a normal good, what are the combined effects in the market for steak?
a) An increase in the equilibrium price and the quantity.
b) An increase in the equilibrium price and an unpredictable change in the equilibrium quantity.
c) An unpredictable change in both the equilibrium price and the quantity.
d) An unpredictable change in the equilibrium price and a decrease in the equilibrium quantity.
The next THREE questions refer to the diagram below.
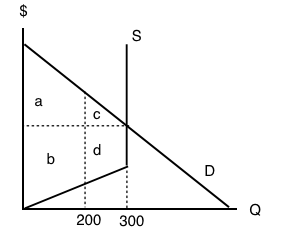
32. Given the equilibrium quantity of 300 units, which areas represent MARKET SURPLUS?
a) a+b+c+d.
b) a+b+c.
c) a+c.
d) a+b.
33. Given the equilibrium quantity of 300 units, which areas represent PRODUCER SURPLUS?
a) c+d.
b) a+b.
c) a+c.
d) b+d.
34. Given the equilibrium quantity of 300 units, which areas represent CONSUMER SURPLUS?
a) c+d.
b) a+b.
c) a+c.
d) b+d.
