3.3 Other Determinants of Demand
Learning Objectives
By the end of this section, you will be able to:
- Understand the difference between demand and quantity demanded
- Know the four main determinants of demand
- Explain demand shifts from both horizontal and vertical perspectives
- Create an aggregate demand curve given individual curves

A Better Bus System
In section 3.2, we explored how the price of gasoline affected quantity demanded, but what about other factors that affect our choices? In May 2016, New York’s Metropolitan Transit Authority introduced high-tech buses equipped with Wi-Fi and USB ports to charge phones and other devices. These improvements encourage people to substitute away from cars, decreasing the demand for gasoline regardless of price. As we will see in this section, there are many determinants of demand. The four we will explore in detail are:
- Income
- Prices of Related Goods
- Tastes and Preferences
- Expectations
As you will see, changes in these factors affect the interaction of price and quantity on every point of our demand curve, resulting in a shift of the entire curve. First, let’s clear up some terminology.
Is demand the same as quantity demanded?
In economic terminology, demand is not the same as quantity demanded. When economists talk about demand, they mean the relationship between a range of prices and the quantities demanded at those prices, as illustrated by a demand curve or demand schedule. When economists talk about quantity demanded, they mean only a certain point on the demand curve, or one quantity on the demand schedule. In other words, a change in quantity demanded is very different than a change in demand.
A change in demand refers to a shift in the demand curve that affects the whole diagram and the interactions between price and quantity.
A change in quantity demanded refers to a movement along the demand curve, exploring different points along the same curve.
We examined changes in quantity demanded in Topic 3.2. In this section, we discuss changes in demand.
1. Income
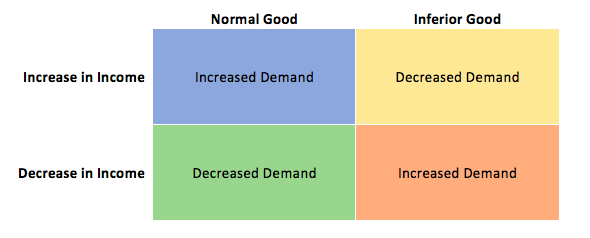
The first determinant of demand we will explore is income. If you were to land a job with a top salary tomorrow, how would that affect your demand for different items? Perhaps you would exchange your old Honda Accord for a Porsche, or go on a shopping spree at a high-end clothing store. Though having more money means you can buy more goods, there are some goods that you may actually buy less of. In introductory microeconomics, we classify goods into two types: inferior goods and normal goods. For inferior goods, as your income rises your demand falls. For normal goods, as income rises your demand rises
Consider Kraft Dinner and steak. On a student budget, Kraft Dinner or similar low-cost items can be a dietary necessity, but as your income increases, you will likely eat less of these low-quality foods. This makes Kraft Dinner an inferior good. On the other hand, as your income increases, you will likely consume more steak and other fine dining foods, making them normal goods. Note that what we consider to be inferior or normal is relative. A millionaire food connoisseur may regard a food you view as a delicacy as an inferior good that they would only eat if they couldn’t afford such a luxurious lifestyle. Regardless, income is still an important factor in our decision making and it is useful to make generalizations about how the market responds when incomes change.

So what effect does income have on the demand curve? Assume we have an increase in income for our consumers of gasoline. With more money you may be less conscious about the amount of gas you use – perhaps you will finally buy an expensive parking pass and drive more. Assuming that gasoline is a normal good, this is going to result in an increase in demand. In Figures 3.3a and 3.3b, we depict two different ways to view this shift.
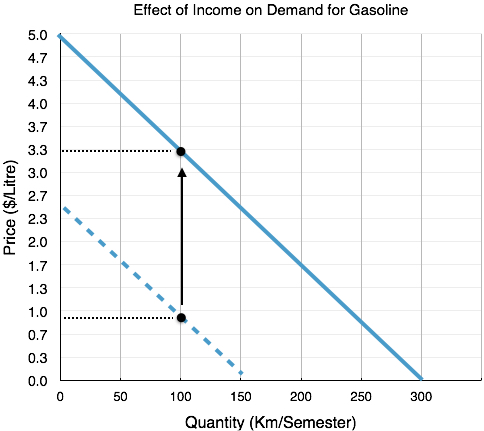
Vertical Shift – Figure 3.3a
The first way to look at a demand shift is to examine how a consumer’s willingness to pay (WTP) changes. With your original income, you were willing to pay $0.9/L to use 100L of gas per semester (note this is simplified from the example in 3.2 to be linear). When income triples, it is estimated we are willing to pay $3.3/L. Recall that demand is determined by preferences and ability to pay, so for a normal good WTP will increase as income rises. Notice that this increase is uniform at any point along the demand curve. Whereas you were WTP only $1.7/L for 50 units, you are now WTP $4.1/L. All across the demand curve, our willingness to pay has increased by$2.4/L.
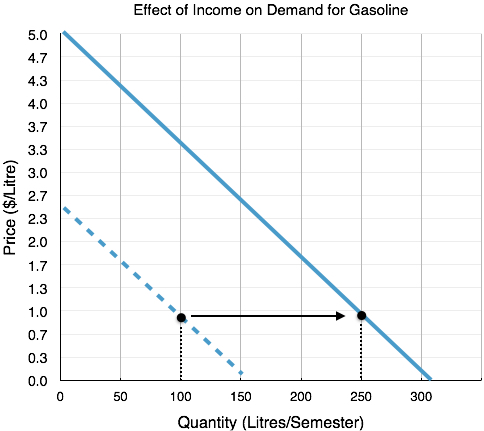
Horizontal Shift – Figure 3.3b
The second way to view a demand shift is to look at how a consumer’s quantity demanded changes at each point along the curve. At a price of $0.9/L, the student initially has a quantity demanded of 100L. After income increase this has risen to 250L. This way of viewing the demand shift is why we call the change a shift in ‘demand’ instead of quantity demanded as the quantity demanded at every point along the curve has changed.
Where the individual actually chooses to consume depends on the supply curve. In 3.2, we examined a demand curve with a constant price. As we will see when we examine the supply curve, shifts often affect both the final price and quantity in the market.
The following table summarizes the different effects income changes can have on our demand curve. Note that the best way to learn these concepts is to think of examples and practice shifting the demand curve. You can refer to the table to ensure you are on the right track!
2. Price of Related Goods
So far, we have only looked at one good in isolation. In reality, there are many goods in the marketplace that interact with each other in unique ways. Some goods seem to pair nicely, whereas others compete. These interactions have specific classifications in economics. With reference to the good we are analyzing in our demand curve:
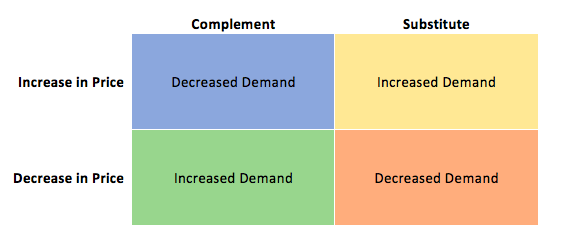
Complement goods are goods that a consumer likes to consume with a given good. For example, peanut butter and jelly. Demand for complements is positively correlated with the other goods price. If jelly increases in price, we will purchase less peanut butter.
Substitute goods are goods that a consumer could consume instead of a given good. For example, peanut butter and almond butter. Demand for substitutes is negatively correlated with the other goods price. If almond butter increases in price, we will purchase more peanut butter.
Like income, the impact of market price fluctuations on our demand curve depends on whether the two goods are substitutes or complements. The following table summarizes how our demand for a given good can be impacted by price fluctuations of other goods.
Taking Advantage of Complements
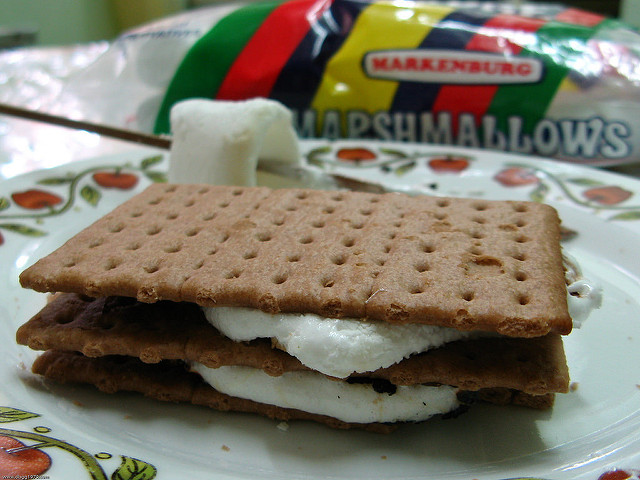
Businesses are well-versed in the knowledge of complements and substitutes, and often use consumer behavior to their advantage. Consider common displays of complementary products, such as a display of marshmallows, chocolate, and graham crackers, each a component of the summer-beloved S’more. A business may put graham crackers are on sale, but not the chocolate. If the graham crackers were displayed alone on sale, the quantity demanded of the good would rise, according to the law of demand. By displaying the goods together, this business is reminding consumers that graham crackers are a complement to chocolate. This will make consumers also more likely to purchase chocolate, even though price has not changed.
3. Tastes and Preferences
Our tastes and preferences change over time. In our gasoline example, assume you start dating someone who drives an electric car and constantly reminds you of the impact your gasoline consumption has on the environment. You will likely begin to follow some of their habits and purchase less gasoline. Marketing departments constantly try to influence your preferences, and sometimes even create them. That’s because the more you prefer a product, the more you will demand it!
4. Expectations
The last determinant of demand we will explore is perhaps the most nuanced. It is that the expectation of the future price of a good can affect how much consumers will demand it today. For example, if you are a frequent shopper at Hudson’s Bay, you will be aware of the company’s regular sales. With sales so frequent, you may be reluctant to purchase any non-discounted item. Since the actual date of the sale is unknown, this is a motivator to wait, decreasing demand today. To really emphasize this point, consider Steam, a digital distribution platform developed by Valve Corporation that sells PC video games online and provides a platform for users to interact. Steam has performed well, with its sales constituting 50%–70% of the US$4 billion market for downloaded PC games. If you are a Steam user, you understand the role of expectations play when purchasing games. Since Steam holds regular holiday-themed sales where they blow out a large portion of their catalog with discounts as high as 80% off there is always the expectation that you can buy the game for a lower price later. This is an even stronger motivator as consumers know exactly when to look for the sales. This will decrease demand for the game when there are no promotions.
If you expect the good to become more expensive, your present demand will increase.
If you expect the good to become less expensive your present demand will decrease.
How soon you expect prices to change will affect the power of expectations. We all know the new iPhone is going to be cheaper six months down the road than when it first comes out, but there are certain benefits to having the product when it first hits the shelves. Firms work hard to create a perceived obsolescence in order to sell goods when they are new. For example, if you fear clothes may go out of style, you are influenced to purchase them immediately rather than wait for sales.
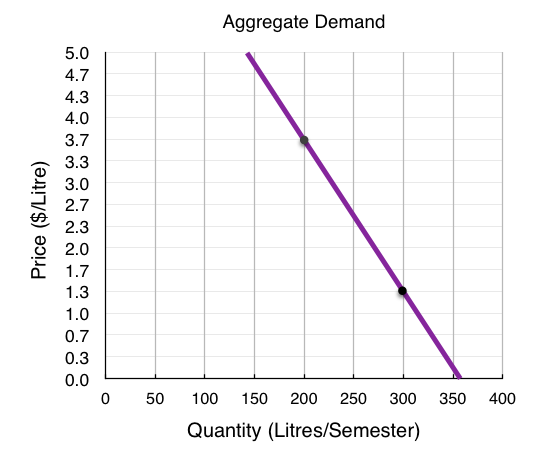
Market Demand
So far, while we have hinted at the market as a whole, the majority of our analysis has looked at one consumer and their demand curve. In reality, we know the market is made up of many consumers, each with individual preferences and willingness to pay. To illustrate market demand (also known as aggregate demand), we can start with two demand curves. In Figure 3.3e below, two individual demand curves for gasoline are illustrated in green and blue. These demand curves could be different for a number of reasons, consumer B could have higher income, could enjoy driving more, or any other determinant of demand that would make his willingness to pay higher. Notice first that the slopes of the demand curves are the same, and while this need not be the case, it makes analysis simple.
To find the aggregate demand line, you simply pick two prices on the individual demand curves and add up the quantity demanded from each consumer. For example, at the price of $1.3/litre, consumer A has quantity demanded of 100 litres/semester, whereas consumer B has quantity demanded of 200 litres/ semester. In aggregate consumer A + consumer B have quantity demanded of 300 litres/semester – this gives us point C on the graph of aggregate demand. Likewise at the price of $3.7/litre, consumer A has quantity demanded of 50 litres/semester, whereas consumer B has quantity demanded of 150 litres/semester resulting in 200 litres of aggregate demand (50+150).
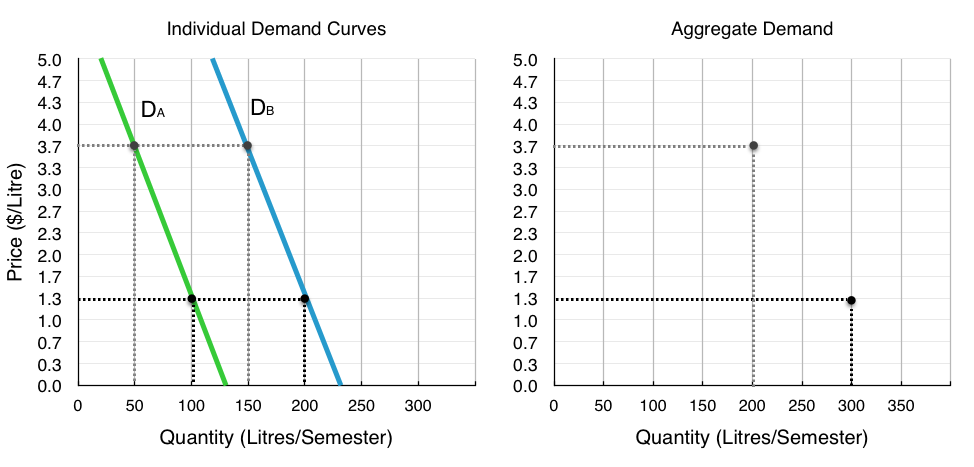
Now you have two points on the market demand curve, with this, you can connect the two points to give the whole curve.
Note that market demand behaves in the same way as individual demand: it is shifted by external forces like income, prices of related goods, preferences, and expectations. When examining demand from now on, we will, for the most part, be analyzing market demand to determine equilibrium.
Summary
We now know that a demand curve is constructed by considering a consumers willingness to pay and different quantities, and the aggregate demand curve is the sum of all consumers demand curves. While price changes influence our quantity demanded, shocks such as changes in income, price changes of related goods, changes in tastes, and expectations can shift our demand, resulting in a different willingness to pay at every level. Now that we understand demand, we can turn to supply and its determinants.
Glossary
- Complements
- goods that are often used together so that consumption of one good tends to enhance consumption of the other
- Inferior Good
- a good in which the quantity demanded falls as income rises, and in which quantity demanded rises and income falls
- Market Demand
- The aggregate of the demands of all potential customers (market participants) for a specific product over a specific period in a specific market.
- Normal Good
- a good in which the quantity demanded rises as income rises, and in which quantity demanded falls as income falls
- Shift in Demand
- when a change in some economic factor (other than price) causes a different quantity to be demanded at every price
- Substitute
- a good that can replace another to some extent, so that greater consumption of one good can mean less of the other
Exercises 3.3
1. Which of the following statements about demand curves is TRUE?
a) If price falls and quantity demanded increases, this is represented by a movement along a given demand curve.
b) If price falls and quantity demanded increases, this is represented by a shift of the demand curve.
c) If price falls and quantity demanded increases, this can be represented by either a movement along a given demand curve, or a shift of the demand curve.
d) None of the above are true.
2. Which of the following is NOT a determinant of the demand for good X?
a) The income of consumers who buy good X.
b) The cost of labor used to produce good X.
c) The price of good Y, a complement to X.
d) The number of buyers of good X.
3. Which of the following will result in a DECREASE in demand (i.e., a leftward shift of the demand curve)?
a) An increase in income, if the good is normal.
b) A decrease in the price of a complement to the good.
c) An increase in the price of a substitute for the good.
d) None of the above.
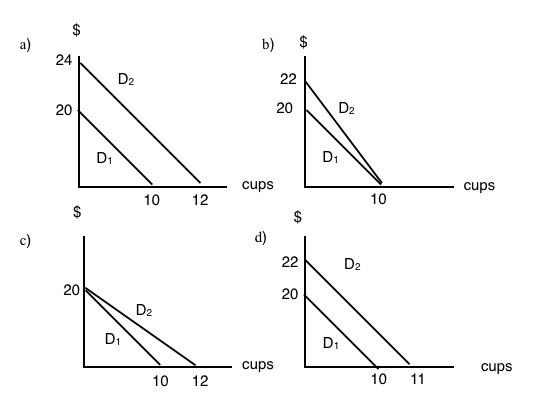
4. Suppose that my daily marginal benefit from drinking coffee increases by $2 per cup. Which of the following represents the effect of this on my coffee demand curve?
5. Which of the following is NOT a determinant of the demand for good X?
a) The cost of labor used to produce good X.
b) The price of good X.
c) The income of consumers who buy good X.
d) The price of good Y, which is a substitute for good X.
6. Which of the following IS a determinant of the demand for good X?
a) The income of consumers who buy good X.
b) The cost of labor used to produce good X.
c) The supply of good X.
d) The number of sellers of good X.
7. A decrease in quantity demanded is, graphically, represented by:
a) A leftward shift in the demand curve.
b) A rightward shift in the demand curve.
c) A movement up and to the left along a demand curve.
d) A movement down and to the right along a demand curve.
8. Suppose goods X and Y are substitutes. Which of the following is TRUE?
a) An increase in the price of X will result in a decrease in the equilibrium price of Y.
b) An decrease in the price of X will result in an increase in the equilibrium quantity of Y.
c) An increase in the price of X will result in an increase in the equilibrium quantity of Y.
d) More than one of the above is true.
9. If cookies are a normal good and incomes increase, we would expect:
a) An increase in equilibrium price and a decrease in equilibrium quantity.
b) A decrease in equilibrium price and an increase in equilibrium quantity.
c) A decrease in equilibrium price and equilibrium quantity.
d) An increase in equilibrium price and equilibrium quantity.
10. A decrease in demand is, graphically, represented by:
a) A leftward shift in the demand curve.
b) A rightward shift in the demand curve.
c) A movement up and to the left along a demand curve.
d) A movement down and to the right along a demand curve.
11. The diagram below illustrates 3 possible demand curves for coconuts.
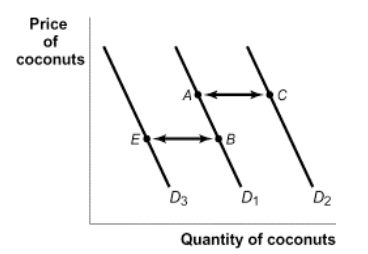
Suppose that coconuts and pineapples are substitutes. If the price of pineapples increases, which of the following movements will represent the effect of this in the market for coconuts?
a) A to C.
b) A to B.
c) B to A.
d) B to E.
The following TWO questions refer to the diagram below.
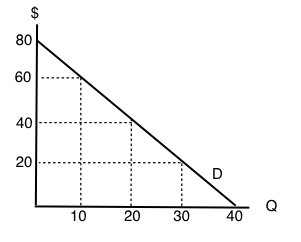
12. If the price of this good is $20, what will be the quantity demanded?
a) 10.
b) 20.
c) 30.
d) 40.
13. If the price of this good is $60, what will consumer surplus equal?
a) $50.
b) $100.
c) $150.
d) $200.
14. The following question refers to the diagram below, which illustrates an individual’s demand curve for a good.
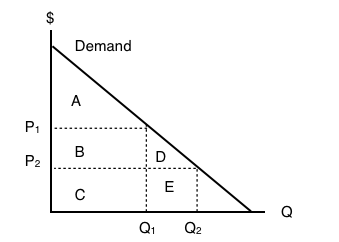
If the price of this good falls from P1 to P2, then consumer surplus will _____ by areas _____.
a) increase; B+D.
b) decrease; B+D.
c) increase; A+B+D.
d) decrease; A.
15. Consider the diagram below.
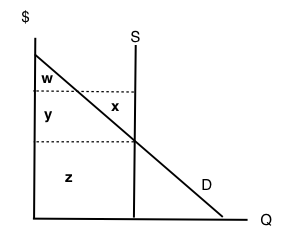
At the equilibrium in this market, which area represents CONSUMER surplus?
a) There is no consumer surplus.
b) Area w.
c) Area x + y.
d) Area w + y.
16. Which of the following CANNOT result in a shift of the demand curve for a good?
a) A change in consumers’ incomes.
b) A change in the price of the good.
c) A change in the price of a complement to the good.
d) All of the above will shift the demand curve.
17. Suppose the price of good X increases. If X and Y are substitutes, then, in the market for good Y, we would expect:
a) An increase in both the equilibrium price and quantity.
b) A decrease in the equilibrium price and an increase in the equilibrium quantity.
c) An increase in the equilibrium price and a decrease in the equilibrium quantity.
d) A decrease in both the equilibrium price and quantity.
18. If coffee and milk are complements, then which of the following will occur if the price of coffee increases?
a) The quantity of coffee demanded will increase.
b) The quantity of coffee supplied will decrease.
c) The demand for milk will increase.
d) The demand for milk will decrease.
19. Consumer surplus is equal to:
a) Revenue received for a good minus that good’s cost of production.
b) The amount of money a consumer is willing to pay for a good.
c) The opportunity cost of a good.
d) None of the above.
20. The diagram below illustrates 3 possible demand curves for coconuts.
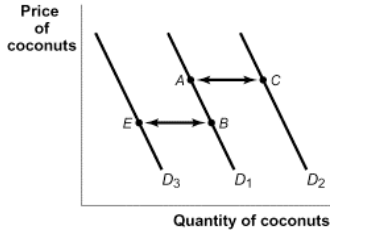
Suppose that (i) coconuts are an inferior good and (ii) consumer incomes decrease. Which of the following movements could represent the effect of this in the market for coconuts?
a) A to C.
b) B to A.
c) C to A.
d) B to E.
