Case Study – The Liberal Gas Tax
In October of 2016, Justin Trudeau made an announcement that Saskatewan Premier Brad Wall called a betrayal. Trudeau told premiers to adopt a carbon tax or cap-and-trade plan or Ottawa will impose its own levy – a minimum of $50 a tonne by 2022 – and return the revenue the provinces. The problem was not so much the policy, but that it signals Trudeau’s determination to impose federal control in jurisdictions previously under the control of the provinces.
Although federal-provincial relations were strained, the policy is moving forward. In this case study, we will explore the impacts of this policy from a consumer theory perspective.
The specific policy that was announced was as follows: the floor price will start at $10 a tonne in 2018, and go up by $10 a year for the next four years. Provinces with a pre-existing policy must make up the difference. It is estimated that a $50 carbon tax would drive up pump prices by 11 cents a litre.

Read more about the Liberal Carbon Tax plan
Assume a households budget is $180, that the price of gas is $0.90 and that the price of all other goods is $1.38.
1. Draw the household’s budget line on the diagram below. If they were to buy only one good or the other, how many total L of gas could they buy? How many of all other goods?
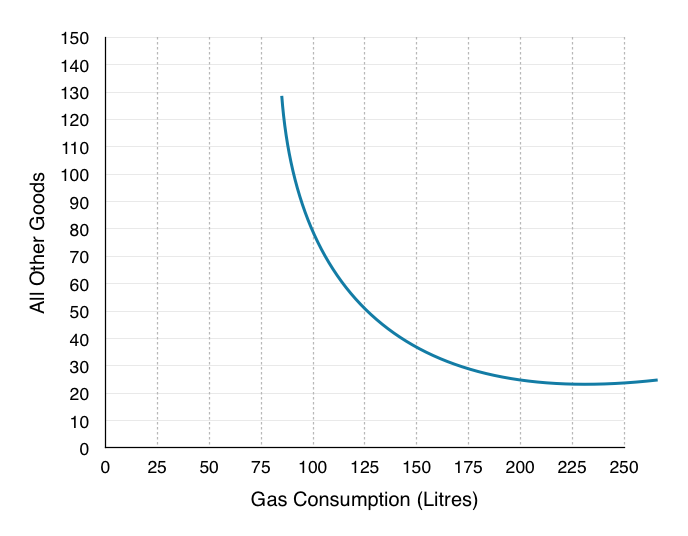
2. Indicate where the household will consume. How many litres of gas? How many of all other goods? Label this Point A.
3. Assume the government was to tax gas consumption by $0.11, draw the new budget line on the graph above.
You should notice that the $0.11 increase causes a very minor shift in the budget line, which would make the rest of the problem rather difficult. In order to consider the effects of the tax let’s pretend the province has decided to tax carbon by doubling the price.
4. Redraw the households original budget line on the diagram below, and draw a new budget line where the price of gas has doubled.
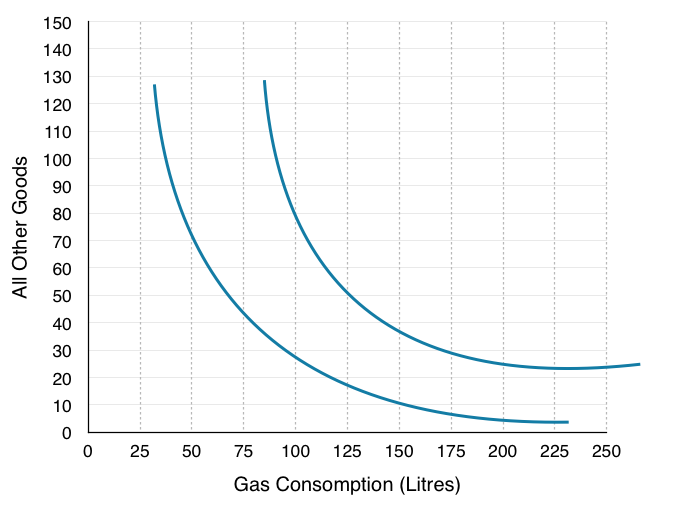
5. Indicate where the household will consume. How many litres of gas? How many of all other goods? Label this Point B.
6. Is the household better off or worse off as a result of the tax? How do you know?
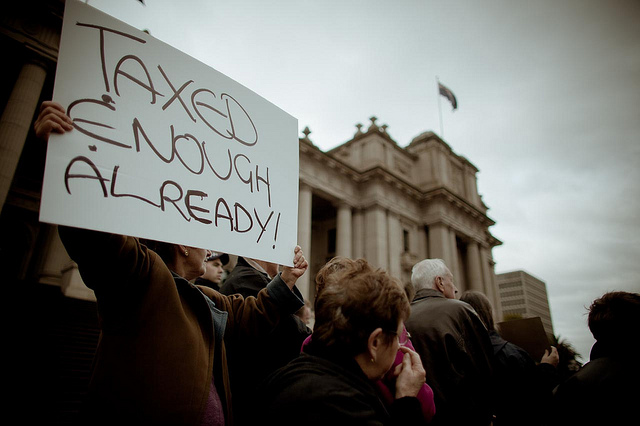
In Topic 5 we explored how government intervention can be useful to solve externalities, but we also know that a tax does not represent a Pareto improvement for all parties. In this case, many consumers are worse off as the policy brings them to a lower indifference curve. In a potential Pareto improvement, we have the necessary gains to compensate the losers, and in the Liberal policy, they give all the tax revenue back to the provinces to help correct household losses. If the province wanted, they could use that money to compensate the losers.
7. How much money does the government collect from each household from the gas tax?
8. If the government compensates each household until they are indifferent to the gas tax, where will the households consume? Label this Point C. Does this still reduce pollution?
9. How much money would the government have to give to each household to make them indifferent about the tax?
10. Indicate the Income Effect, the Substitution Effect and the Final Effect of the tax (without compensation) with reference to the 3 points (A, B & C)
11. How could this policy represent a potential Pareto improvement if the revenue the government receives is not enough to compensate the households?
Notice that this analysis does not pass judgement on whether the government is doing too much or not enough for the environment. As an economist, you can evaluate policy to determine whether they are the best method to achieving a certain objective, without making comment on the objective.
In this case study we have shown how microeconomic concepts of environmental policy and consumer theory can be used to understand current events in the news. Do you have a story you think would make a good case study? Contact economics103@uvic.ca to propose your story.
