6.4 Building Demand
Learning Objectives
- Understand how the demand curve and consumer theory are linked
The Foundations of Demand Curves
Changes in the price of a good cause the budget constraint to shift, and new indifference curves to form. In this way, the logical foundations of demand curves—which show a connection between prices and quantity demanded—are based on the underlying idea of individuals seeking utility. Figure 6.4a shows a budget constraint with a choice between housing and “everything else.” (Putting “everything else” on the vertical axis can be a useful approach in some cases, especially when the focus of the analysis is on one particular good.) The preferred choice on the original budget constraint that provides the highest possible utility is labelled M0. The other three budget constraints represent successively higher prices for housing of P1, P2, and P3. As the budget constraint continues to rotate inwards, the utility-maximizing choices are labelled M1, M2, and M3, and the quantity demanded of housing falls from Q0 to Q1 to Q2 to Q3. Note that indifference curves have not been represented to keep the graph easy to follow. M0, M1, M2, and M3 represent the points where IC0, IC1, IC2, and IC3 are tangent to the changing budget lines.
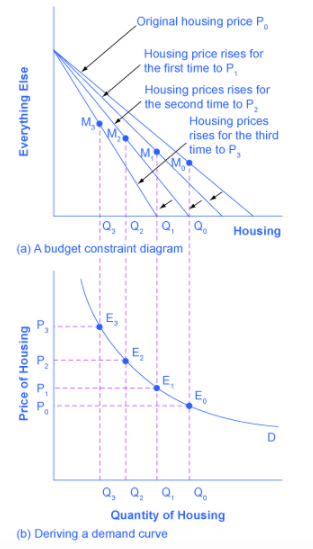
So, as the price of housing rises, the budget constraint shifts to the left, and the quantity consumed of housing falls, ceteris paribus (meaning, with all other things being the same). This relationship – the price of housing rising while the quantity of housing demanded falls – is graphed on the demand curve. Indeed, the vertical dashed lines stretching between the top and bottom show that the quantity of housing demanded at each point is the same in both (a) and (b). The shape of a demand curve is ultimately determined by the underlying choices made to maximize utility subject to a budget constraint. While economists may not be able to measure utility, they can certainly measure price and quantity demanded.
Conclusion
In chapter 6, we explored the inner workings of the demand curve and showed how consumers strive to maximize their utility given their budget constraints. This analysis shows us how to determine whether a good is normal or inferior, and whether two goods are substitutes or compliments. Next, we will examine the back-end of the supply curve with an in-depth analysis of producer theory.
