4.6 Quantity Controls
Learning Objectives
By the end of this section, you will be able to:
- Explain the effects of a quantity control
- Understand why quotas cause a deadweight loss
We looked at an example of the government regulating prices, and concluded that a deviation from the equilibrium quantity is what causes a deadweight loss. What if the government regulates quantity directly? It should be fairly obvious that this will also cause a deadweight loss, but the distribution of surplus will be different.
In Figure 4.6a, we show the market for oil. The equilibrium quantity is 3.5 million barrels of oil. Assume the government, pursuing an environmental strategy, wants to reduce both the level of production and consumption. A policy to reduce quantity is called a quota, a government-imposed restriction on the number of goods bought and sold. If the government sets a quota of 2 million barrels, both consumers and producers have to reduce consumption and production to that level.
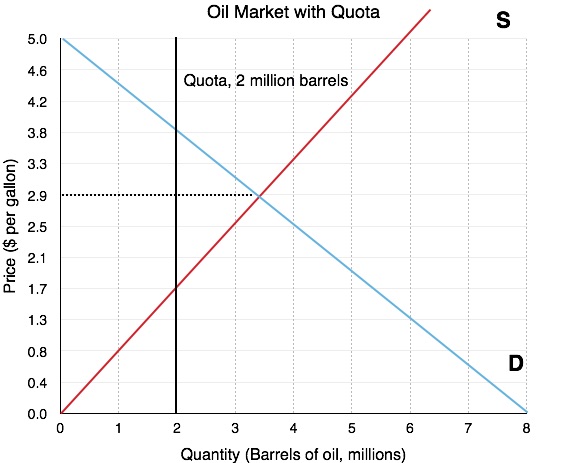
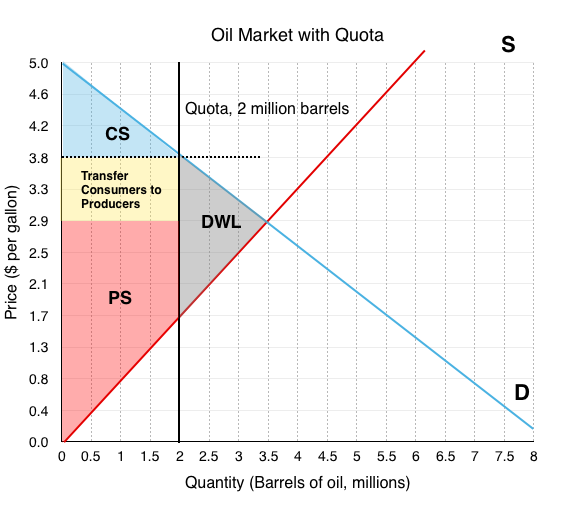
We can see from Figure 4.6b that as a result of the quota, price increases from $2.9/gallon to $3.8/gallon. This may seem counter-intuitive. The government set a restriction on quantity, and price changed as well. Notice that at the restricted quantity of 2 million barrels, consumers are willing to pay $3.8/gallon. The producers, seeing the consumers are willing to pay more than the previous price of $2.9/gallon, will increase prices to $3.8/gallon.
Market Surplus
To examine the effects of this quota on the individual stakeholders, and the market as a whole, we can calculate the change in Consumer Surplus, Producer Surplus, and Market Surplus.
Before
The market surplus before has not been depicted, as the process should be routine. Ensure you understand how to find the following values:
Consumer Surplus = $3.675 million
Producer Surplus = $5.075 million
Market Surplus = $8.75 million
After
The market surplus after the policy can be calculated with:
Consumer Surplus (Blue Area) = $1.2 million
Producer Surplus (Red Area + Yellow Area)= $5.9 million
Market Surplus = $7.1 million
Comparing market surplus before and market surplus after, notice that the effect of a quota is similar to that of a price floor. The main difference is that the government put a restriction on quantity, and price changed as a by-product, whereas with price restrictions the government puts a restriction on price, with quantity changing as a by-product.
Summary
A quota is the simplest of the government policies we will look at. It is a straightforward way for the government to restrict production. We will see later that while this policy decreases market surplus, it can be useful for other reasons.
Glossary
- Quota
- A government-imposed restriction on the number of goods bought and sold
Exercises 4.6
1. Which of the following CANNOT reduce the equilibrium quantity sold in a market?
a) A price ceiling.
b) A price floor.
c) A quota.
d) All of the above can decrease equilibrium quantity sold.
