Introduction to Cost and Industry Structure
The Assembly Line – A Cost Revolution
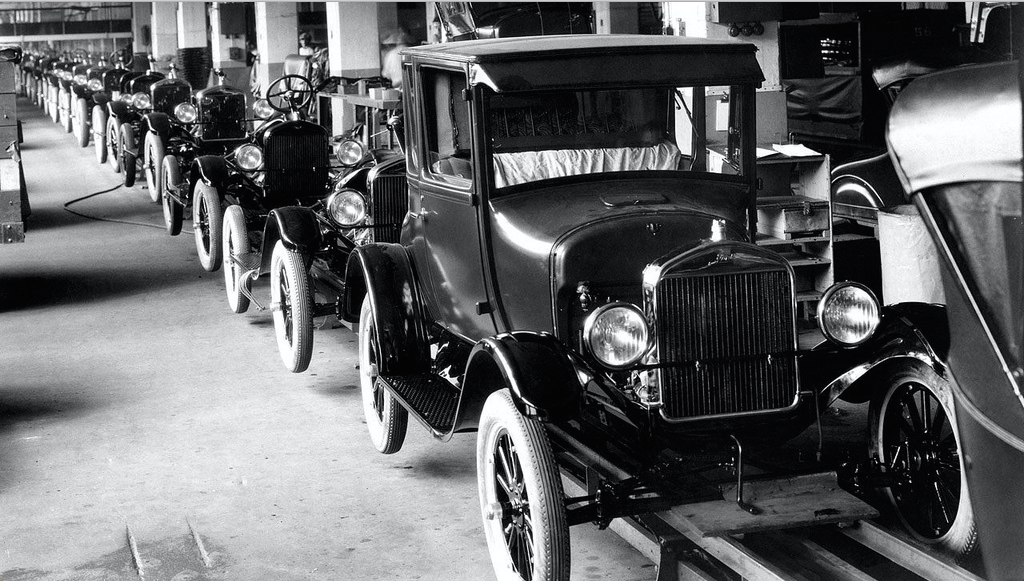
In 1908, the automobile industry changed forever. The first automobiles date back to the 15th century when Leonardo da Vinci was creating designs and models for transport vehicles. Karl Benz, a German inventor, developed the first gas-powered automobile in 1885 and the first American car manufacturer opened in 1893. However, until 1908, the automobile was a luxury enjoyed only by the rich. It was not a technological innovation that changed the industry, but rather a revolution on costs.
Henry Ford, an American car manufacturer, developed a method that steadily reduced the cost of the automobile: the assembly line. Rather than having workers involved with each component of the manufacturing of a vehicle, workers specialized in certain areas. This example illustrates the marginal product of labour, a concept we will explore in this section. We will see that the MPL will rise as you add more workers, as each new worker helps make the assembly line more efficient than before.
The Model T, known popularly as the “Tin Lizzie” has become an American folkloric symbol, as it was a turning point in allowing the majority of Americans to afford the automobile. By 1927, over 15 million Model-T’s had been produced.
This innovation in production shows that the economics of the firm has an important bearing on the overall market and allows us to understand how costs affect supply.

Read more about the Model-T
Topic Objectives
Topic 7: Producer Theory
In this Topic, you will learn about:
- Fixed versus variable factors
- The structure of costs in the short run
- The structure of costs in the long run
- Marginal and average productivity of labour
- Marginal costs, average variable costs, average total costs, and average fixed costs
- Producer surplus versus profits
- Short and long run competitive equilibria
In Topic 6, we explored the underlying behaviours of the demand curve, and how consumers make consumption decisions based on preferences and budget constraints. Now, we will examine the underlying behaviours of individual firms in our supply curve.
First, let’s review some of the assumptions we have made about supply curves in perfectly competitive markets:
- Producers will increase production if MB (or price) is greater than the MC
- Producers will reduce production if MB (price) is less than MC
- Producers maximize profits where MB = MC
- The supply curve represents the aggregate MC of all firms
So far, we have shown the supply, or marginal cost curve, as linear and upward sloping. In this topic, we will give greater consideration to the workings of a firm, and how firms respond to demand/supply shocks.
