Learning Objectives
By the end of this section, you will be able to:
- Explain price controls, price ceilings, and price floors
- Understand why price controls result in deadweight loss
The first government policy we will explore is price controls. In Topic 3, we examined what will occur if price is below or above equilibrium price, and concluded that market pressures will return the market to equilibrium. But what if the government regulates the market so that it cannot move?
Price Ceiling
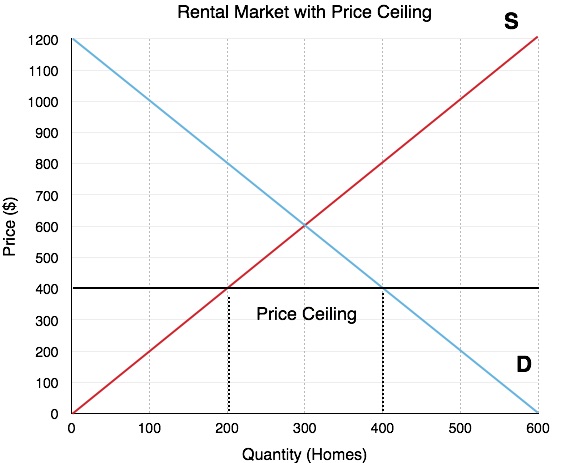
A common example of a price ceiling is the rental market. Consider a rental market with an equilibrium of $600/month. If the government wishes to decrease this price to make it more affordable for renters, it may place a binding price ceiling of $400/month. This policy means the landlords cannot charge more than $400 per month. What will this do to our equilibrium? Refer to Figure 4.5a. Whereas before 300 homes were rented, there is now a housing shortage. At the lower price of $400/month, quantity supplied is only 200 housing units and a quantity demanded is 400 housing units. This means that 200 renters who want to rent can no longer find homes! This is important, because when quantity demanded and quantity supplied are unequal, the market is restrained by the lower value.
Despite this information, it is not enough to tell us if the market is more or less efficient – our metric for that is market surplus. Even though some renters cannot find homes, the government still successfully lowered the price for some consumers. So how do these effects weigh out?
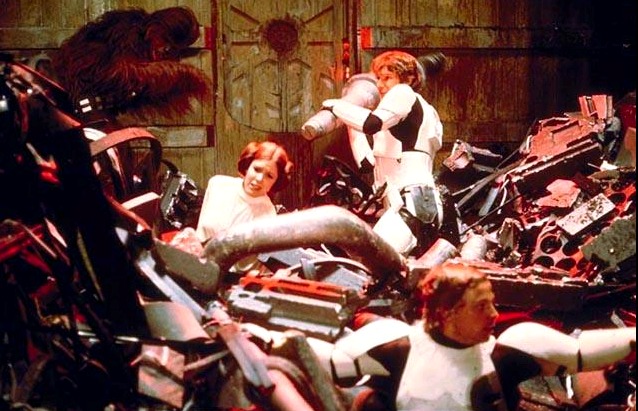
Save Us R2-D2, You’re Our Only Hope!
If the equilibrium price is $6 and the government says you cannot charge more than $8, the government intervention is meaningless or ‘non-binding’. Whereas price ceiling aims to lower the price, price floors aim to raise it. Since this seems backwards, it is easy to get confused about when price ceilings and price floors are binding. Rather than memorizing which is which, consider an example from Star Wars to help remember.
In the original Star Wars, Luke, Leia, Han Solo, and Chewbacca are trapped in a garbage disposal that begins to collapse inwards. The room becomes more constrained as the walls come together. If you were in a room, what would cause you to feel constrained? If the ceiling is rising you have more space, so it is not constraining. Similarly, if the floor falls, you have more room. If the ceiling starts falling, or the floor begins to rise then you are constrained. This helps us remember an important principle:
Only a price floor above equilibrium or a price ceiling below equilibrium is binding.
Calculating Market Surplus
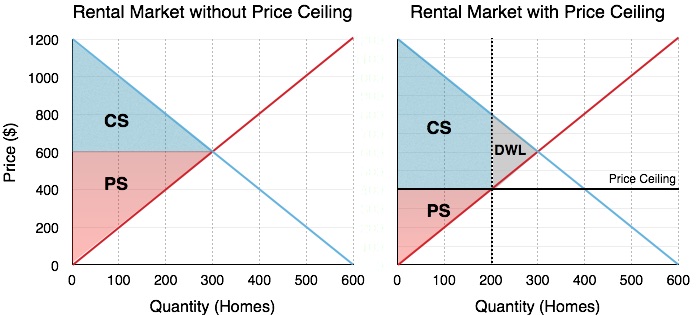
To find out the impact of government’s price ceiling, we must calculate market surplus before, and after a policy. This method will be an important gauge for all our policy analysis in this topic. Consider Figure 4.5b, where the effects of the Price Ceiling is shown.
Before
The calculation of market surplus before policy intervention should be straight forward by now. Market surplus is equal to the sum of consumer surplus and producer surplus, calculating from Figure 4.6b:
Consumer Surplus (Blue Area): [(1200-600) x 300]/2 = $90,000
Producer Surplus (Red Area): [(600) x 300]/2 = $90,000
Market Surplus: $180,000
After
The calculation of market surplus after intervention is less obvious. Consumers have lost surplus in some areas, but gained surplus in others (we will look at this closely in the next Figure 4.5c). Producers have lost surplus.
Consumer Surplus (Blue Area): [(1200-800) x 200]/2] + (400×200) = $120,000
Producer Surplus (Red Area): [(600) x 300]/2 = $40,000
Market Surplus: $160,000
Looking before and after we see that producer surplus has decreased and consumer surplus increased – but the decrease in producer surplus outweighed the effects of the increase in consumer surplus, causing deadweight loss. This means that the market is less efficient, because by removing the regulation, the market as a whole is better off.
What About Redistribution?
It’s easy to look at the total numbers and show that market surplus has decreased, but how does this change affect individual consumers and firms?
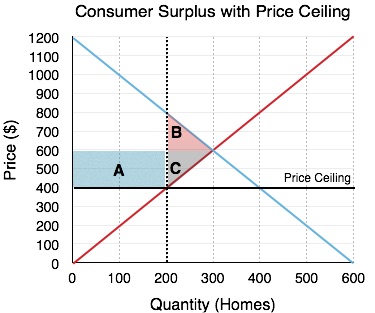
In Figure 4.6d the areas which change as a result of the policy are shown.
Consumers
Consumers gain an area of A and lose an area of B.
Surplus Decrease – Area B
As mentioned previously, the quantity supplied in the market decreases from 300 rental units to 200. This means that 100 renters can no longer find homes. We can assume that the consumers who are willing to pay most for the homes will end up with the rental units (they will start looking earlier, exploring more options etc.) so consumers on the demand curve WTP between $800 and $600 will be cut out of the market. This results in a $10,000 loss in consumer surplus, shown in Figure 4.6d as area B.
Surplus Increase – Area A
Alternatively, the 200 consumers who are able to find homes now go from paying $600/month to paying $400/month, resulting in a $40,000 increase in consumer surplus. This is shown in Figure 4.6d as area A.
Overall, consumers gain $30,000, which is consistent with the calculations above.
Producers:
Producers lose areas C and A
Surplus Decrease – Area C
The price ceiling causes the landlords to reconsider staying in the rental market, as fewer landlords can make a profit with the lower price. This causes 100 landlords to leave the market, reducing their producer surplus to nothing. This forgone surplus amounts to $10,000 and is represented in Figure 4.6b as area C.
Surplus Decrease – Area A
Like consumers, some producers will remain in the market, but these producers now have to face the reality of lower rent revenue. Each of the 200 landlords loses $200 of revenue. This results in a $40,000 decrease, represented as area A.
Overall, producers lose $50,000, which is consistent with the calculations above.
Transfer and Deadweight Loss:
dWe can summarize the overall effects in the market as two categories: a transfer of surplus and a deadweight loss.
Transfer
Notice that Area A was a transfer from the landlords to the renters who remain in the market. 200 renters now save $200 each, and 200 landlords now lose $200 each. It is important to recognize that this transfer is a result of the price effect of the policy, meaning it occurred because price differed from equilibrium.
DWL
Alternatively, the deadweight loss results because there are players who are no longer able to be a part of the market. 100 renters and 100 landlords all lose a varied amount based on their willingness to pay and marginal costs. This change is a result of the quantity effect on the policy, meaning it occurred because quantity differed from equilibrium.
A change in quantity from the equilibrium value is the only thing that causes a DWL. Changes in price will cause transfers. While the two effects work together, it is important to be able to distinguish between the two.
This was a fairly lengthy explanation of price ceilings, but it is one that will lead into the discussion of all policy. Every policy we will look at in microeconomics has both a quantity effect and a price effect, and it is important to understand how the policy impacts individual market players.
Price Floor
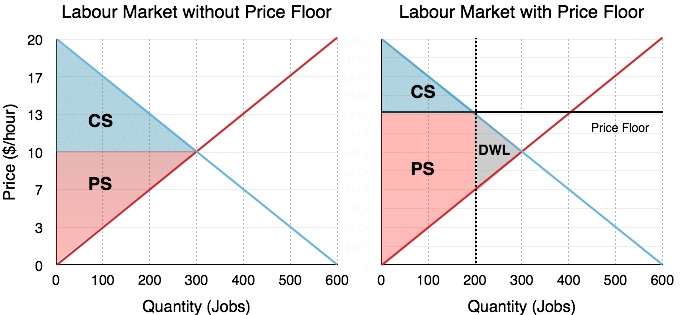
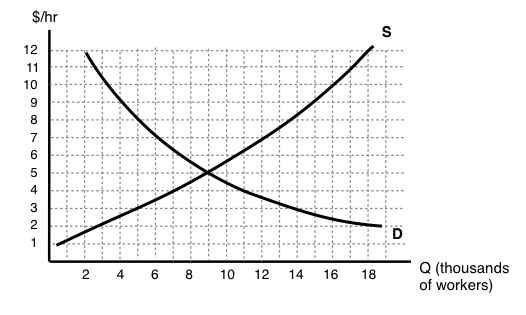
While the price floor has a very similar analysis to the price ceiling, it is important to look at it separately. A common example of a price floor is a minimum wage policy. The labor market is unique in that the workers are the producers of labor and the firms are consumers of labor. Price can be denominated in hourly wage, with the quantity of workers on the x-axis. If the government sets a binding minimum wage (price floor), it must be set above the equilibrium price.

In Figure 4.6e, the equilibrium wage is shown as $10/hour. This is where the demand for labor is equal to the number of workers who want to find jobs. At this level there is no unemployment. However, if the government sets a minimum wage of $13/hour, this will change. The Quantity of Labor Supplied (workers looking for jobs) will be 400, but the quantity demanded will be 200. This means that 200 workers will be unemployed! Again, this is not enough information to determine whether the market is inefficient – we have to calculate the change in market surplus!
Using the same process as before:
Before
Consumer Surplus (Blue Area): [(20-10) x 300]/2 = $1500
Producer Surplus (Red Area): [(10) x 300]/2 = $1500
Market Surplus: $3000
After
Consumer Surplus (Blue Area): [(20-13) x 200]/2= $700
Producer Surplus (Red Area): [(13-7) x 200] + (7 x 200)/2 = $1900
Market Surplus: $2600
Since the market surplus after the policy is less than the market surplus before, there is a deadweight loss!
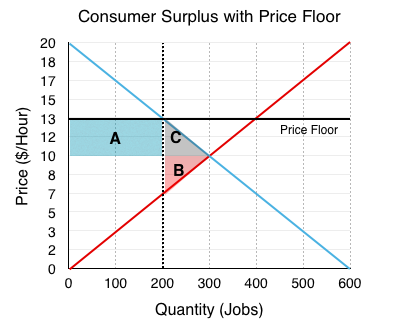
Again, the changes in the market can be categorized as a transfer and a deadweight loss. This time, the transfer is from consumers (firms) to producers (workers), since the workers who are able to find work are better off. This causes no change to market surplus in isolation but is coupled with the deadweight loss caused by workers who are no longer able to find jobs as firms leave the market.
Summary
In the absence of externalities, both the price floor and price ceiling cause deadweight loss, since they change the market quantity from what would occur in equilibrium. This is accompanied by a transfer of surplus from one player to another. If the goal of the policy is to reduce quantity to a certain level, both a price ceiling or a price floor could be used to achieve this aim. In this case, both policies would result in the same size DWL. The distribution of surplus will be very different, but the change in quantity away from equilibrium is the only variable that matters when calculating DWL. As we will see, if a tax, quota, or any other policy causes the same change in quantity as another, the deadweight loss will be the same.
Glossary
- Price Ceiling
- a legal maximum price
- Price Control
- government laws to regulate prices instead of letting market forces determine prices
- Price Effect
- the impact when price differs from equilibrium, causes a transfer of surplus between parties
- Price Floor
- a legal minimum price
- Quantity Effect
- the impact when quantity differs from equilibrium, causes a deadweight loss to society
Exercises 4.5
The following TWO questions refer to the supply and demand curves illustrated below.
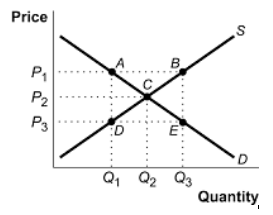
1. A price ceiling of P3 causes:
a) A deadweight loss triangle whose corners are ABC.
b) A deadweight loss triangle whose corners are ACD.
c) A deadweight loss triangle whose corners are BEC.
d) A deadweight loss triangle whose corners are CDE.
2. A price floor of P1 causes:
a) Excess demand equal to the distance AB.
b) Excess supply equal to the distance AB.
c) Excess supply equal to the distance DE.
d) Excess demand equal to the distance DE.
3. Which of the following statements about price ceilings is TRUE? (Assume the price ceiling is set below the unregulated equilibrium price.)
a) Price ceilings make sellers worse off.
b) Price ceilings make buyers better off.
c) Both a) and b) are true.
d) Neither a) nor b is true).
4. Which of the following statements about minimum wages is true?
a) Minimum wage laws may make some workers better off and others worse off.
b) Minimum wage laws make employers worse off.
c) Both a) and b) are true.
d) None of the above are true.
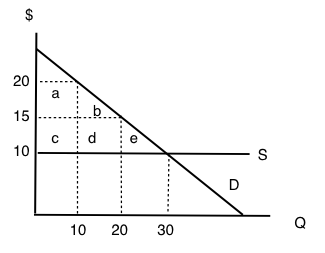
5. Consider diagram below, which illustrates the market for low-skilled labour.
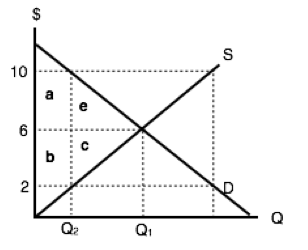
Suppose that the equilibrium quantity is reduced from Q1 to Q2 units, through the introduction of a price floor. Which of the following correctly describes the resulting decrease in MARKET surplus?
a) Market surplus will decrease by a – c.
b) Market surplus will decrease by by e + c.
c) Market surplus will decrease by a + b + e + c.
d) Market surplus will decrease by b – e.
6. Consider diagram below, which illustrates the market for low-skilled labour.
If the government introduces a minimum wage law set at $9 per hour, then, in the new equilibrium, which of the following statements is TRUE?
I. There will be 11,000 workers willing to work who cannot find work, given the wage.
II. The number of workers employed will decrease by 11,000.
III. The number of workers that employers are prepared to hire will decrease by 5,000.
a) I only.
b) I and II only.
c) I, II, and III.
d) I and III only.
7. Suppose that the BC government wishes to reduce the quantity of beer sold in the Province by 20%. It has calculated that this goal can be achieved EITHER through a price floor set at $2 per six-pack of beer OR a price ceiling of $20 per six-pack of beer. Assume that the current price of beer is $10 per six-pack. Which of the following statements about these policies is TRUE?
a) The deadweight loss from the price floor will be greater than the deadweight loss from the price ceiling.
b) The deadweight loss from the price ceiling will be greater than the deadweight loss from the price floor.
c) There is insufficient information to determine which policy will have the large deadweight loss.
d) None of the above statements is true.
8. Consider the supply and demand diagram below. Assume no externalities.
If a price floor of $20 is introduced, then which area will represent the deadweight loss?
a) e.
b) e + d.
c) e + b + d.
d) The deadweight loss will be zero.
9. If a price ceiling (set below the initial equilibrium price) is introduced in a market, then:
a) Producer surplus definitely decreases.
b) Consumer surplus definitely increases.
c) Neither a) nor b) are true.
d) Both a) and b) are true.
10. In Canada, the prices of most medical services are regulated by the Provinces (that is, they are subject to price ceilings). This type of regulation is likely to result in which of the following (relative to an unregulated market)?
a) An increase in the quantity of medical services provided.
b) Consumption of medical services such that the marginal benefit is less than the marginal cost.
c) Lower incomes for providers of medical services.
d) Higher tax revenues for Provincial governments.
