Some hate it and some love it, but regardless of how you feel oil is still a key part of our daily lives. The average Canadian uses about 20 barrels of oil each year, equivalent to about one and a half swimming pools. Since it is such a major part of our expenses, oil is a product where, when price changes, we really notice.
In 2008, China’s expansion sparked a long period of high prices. In this case study, we will analyze what has happened to these prices over time and the impact this has had on oil producers from the lens of producer theory.
To simplify our case study, let’s assume that the oil market is perfect competition.
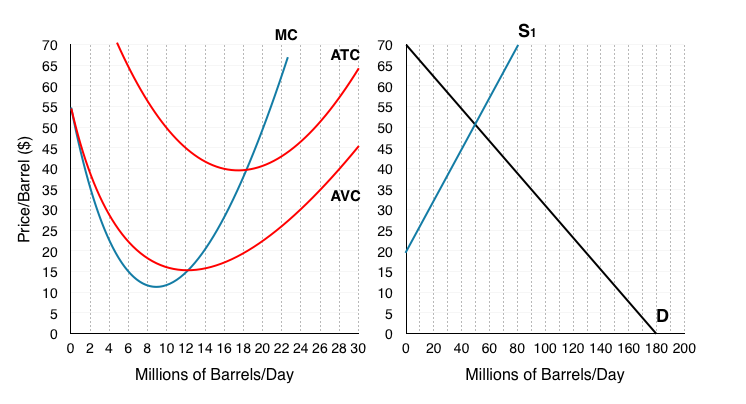
1. Consider the following producer theory model for a single firm producing oil, and the aggregate supply and demand. What is the firm’s equilibrium price and quantity?

2. What is the firm’s profit at this level?
3. What will occur in the long-run for this market? Show this on the new graph below.

The period of high prices indeed incentivized private firms to search farther than ever before – in the Arctic, Brazil’s pre-salt fields, deep waters off Angola, and Canada’s oil sands to ever expand the supply of oil. Investors encouraged this activity, rewarding future growth as much as profitability.

Oil prices have been quite volatile. Recently, from mid 2014 to early 2016 oil prices plummeted from $110 a barrel to around $27. This sharp decline has been due to a number of causes. A key cause was when sanctions were lifted from Iran, a new producer entered the market with large quantities of oil. In addition, growing fears about action on climate change, coupled with the emergence of alternative-energy technologies, caused producers to pump as hard as they can, while they can.

Read more about the reasons for changing oil prices
3. Use the producer theory model from above to show the impact of Iran’s entry, assume this brings the market from long-run equilibrium to a price of $27.
4. What are the firms profits at this price?
In the industry at large, the incentive is to keep producing “as flat out as you can”, once investment costs have been sunk into the ground, says Simon Henry, Shell’s chief financial officer. He says it is sometimes more expensive to stop production than to keep pumping at low prices, because of the high cost of mothballing wells. He suggested that firms will not pack up so long as prices cover day-to-day costs, in some cases as low as $15 a barrel.
It may be uneconomic to drill new deepwater wells at prices under $60 a barrel, he says, but once they are built it may still make economic sense to keep them running at prices well below that. Such resilience is used by some to justify why they expect prices to remain “lower for longer”.

Read more about the impact of price changes on oil firms
6. What does this excerpt suggest about how firms will behave in the short run?
7. Based on the information given about this market, what do you think the time horizon will be for this industries ‘long run’? What will happen in the long run?
Notice that in our model when prices fall, even in the short run individual firms will decrease production. In reality, firms part of the Organization of Petroleum Exporting Countries (OPEC) made a pact to keep production high, to try to retain market share and keep out competitors.
In his book “The Prize”, Daniel Yergin quotes an American academic writing as far back as 1926 about the “spectacle” of massive overproduction. “All saw the remedy but would not adopt it. The remedy was, of course, a reduction in the production.”
8. Comment on the effects of OPEC’s actions on the market.
In this case study we have shown how microeconomic concepts of monopoly and monopolistic competition can be used to understand current events in the news. Do you have a story you think would make a good case study? Contact economics103@uvic.ca to propose your own case.

