4.8 Elasticity and Policy
Maxwell Nicholson
Learning Objectives
By the end of this section, you will be able to:
- Describe how elasticity impacts deadweight loss
- Predict who will bear a greater burden from a policy based on relative elasticity
- Understand the difference between elasticity and relative elasticity

Buttery Elasticity
For many years the U.S dairy market was inelastic, but times have changed, and dairy demand is not as inelastic as it once was, says Sara Dorland, managing partner with Seattle-based Ceres Dairy Risk Management. Higher prices can have a direct effect on the consumption of dairy products.
“Historically a good amount of our product went to the U.S. government, which kept prices stable, especially for skim products,” says Dorland, who holds an MBA in business and finance. “Therefore, once every few years, butter or cheese would have a run-up and fall back down. As a result, milk and dairy product prices played within a rather tight range, a factor that contributed to our belief that demand was rather inelastic. Today, that is not the case as the government is no longer one of our best customers.”
This means that the quantity demanded in the dairy market is becoming more responsive to changes in price in the U.S. Compare this to the Canadian market and you will see a very different story. Due to a supply management system that is operated by farmer-run provincial marketing boards, the Canadian dairy market remains very inelastic as high tariffs and quota requirements restrict market entry. This limits the number of producers in the market and reduces consumer choice, causing a very inelastic demand curve like we saw with the textbook industry.
Relative elasticity is important when looking at how markets respond to a price change. Two of the policies we looked at, taxes and price controls, caused deadweight loss and redistribution among market players. As we will illustrate in this chapter, the relative elasticity of a market will determine which party bears a greater burden of tax policy.

Read the rest of the story here.
https://www.vice.com/en_ca/article/blame-canadas-dairy-cartel-for-our-expensive-milk-and-cheese-867
http://www.theglobeandmail.com/news/politics/canadas-dairy-industry-is-a-rich-closed-club/article25124114/
http://www.agweb.com/article/why-dairy-demand-has-become-more-elastic-naa-catherine-merlo/
In Topic 4.3, we discussed some of the many factors that cause supply and demand to be relatively more or less elastic. Now, we will explore the impact that this has on relative policy burden and deadweight loss.
Elasticity and Deadweight Loss
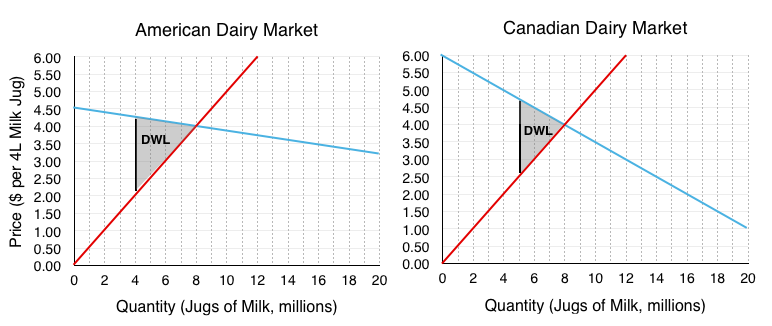
Let’s continue to look at the dairy market. How would a $2.25 per unit tax on the American and Canadian dairy market impact different market players? In our analysis, let’s make the assumption that the Canadian and American markets both start with an equilibrium price of $4/jug and equilibrium quantity of 8 million. This is obviously not realistic, but it allows us to analyze the effects of elasticity holding other factors constant. The only difference in this scenario is the elasticity of the demand curve. Demand in the American market is relatively more elastic than the Canadian market. The tax has been shown on both diagrams and the deadweight loss depicted

At first glance, it is difficult to determine which deadweight loss is greater. Since deadweight loss is the result of a quantity change, we can ignore the redistributive effects of the tax and look exclusively at the lost surplus to consumers and producers who are no longer buying/selling the good.
Deadweight loss to American – Relatively more Elastic
The $2.25 tax causes a wedge between what consumers pay (now $4.25) and what producers receive (now $2.00). This wedge causes a decrease in equilibrium quantity from 8 million milk jugs to just 4 million. Calculations for deadweight loss are shown below:
[latex]\frac{\left(4.25-2.00\right)\cdot \left(8-4\right)}{2}[/latex] = [latex]\frac{2.25\cdot 4}{2}[/latex] = $4.5 million
Deadweight loss to Canadian – Relatively more Inelastic
For Canadians, the $2.25 tax causes a different wedge between what consumers pay and what producers receive. Consumers now pay $4.75 and producers receive $2.50 This wedge causes a different decrease in equilibrium quantity from 8 million milk jugs to 5 million. Notice that this decrease in quantity is less than the American market. Calculations for deadweight loss are shown below:
[latex]\frac{\left(4.75-2.50\right)\cdot \left(8-5\right)}{2}[/latex] = [latex]\frac{2.25\cdot 5}{2}[/latex] = $3.375 million
It should be no surprise that, as else constant, the deadweight loss is greater for the market that experiences the larger decrease in equilibrium quantity. Notice that although the triangles are different shapes, the base of each triangle is the same, and equal to the $2.25 tax. The only difference is the height, which is equal to the decrease in quantity from equilibrium. This leads us to our first principle of relative elasticity:
For a more elastic market a price change causes a greater decrease in quantity therefore a policy in a more elastic market will cause a greater deadweight loss.
Policy Burdens and Elasticity
We have determined that the more elastic a market is, all else equal, the market will have a greater deadweight loss. How does relative elasticity affect the share of the burden producers and consumers bear?

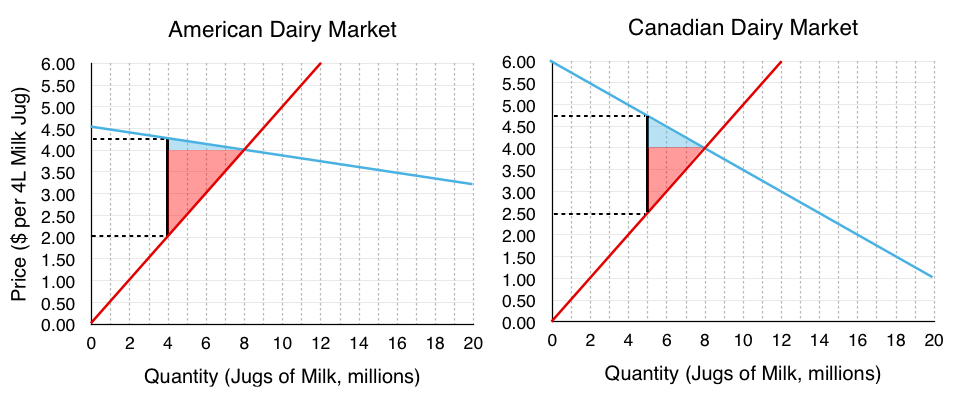
Visually, it seems quite clear that in the American market, where demand is more elastic, consumers bear a smaller burden. Let’s test this mathematically.
American Market
Deadweight Loss to Consumers:
[latex]\frac{\left(4.25-4.00\right)\cdot \left(8-4\right)}{2}[/latex] = $0.5 million
Deadweight Loss to Producers:
[latex]\frac{\left(4.00-2.00\right)\cdot \left(8-4\right)}{2}[/latex] = $4 million
Total Deadweight Loss:
$4.5 million
This means that consumers bear 11.11% of the tax burden and producers bear 88.89%.
Canadian Market
Deadweight Loss to Consumers:
[latex]\frac{\left(4.75-4.00\right)\cdot \left(8-5\right)}{2}[/latex] = $1.125 million
Deadweight Loss to Producers:
[latex]\frac{\left(4.00-2.50\right)\cdot \left(8-5\right)}{2}[/latex] = $2.25 million
Total Deadweight Loss:
$3.375 million
This means that consumers bear 33.33% of the tax burden and producers bear 66.67%.
As we speculated, consumers bear a smaller burden in the US market, and in both cases a smaller burden than the producers. This leads us to our second principle of relative elasticity.
As supply (demand) grows relatively more inelastic, producers (consumers) bear a greater burden of the tax.
As supply (demand) grows relatively more elastic, producers (consumers) bear a smaller burden of the tax.
Recall in Topic 4.7, we examined the difference between legal and economic tax incidence and determined that who the tax was levied on is irrelevant for who bears the burden. Now, we have the tools to determine who will bear the greater burden. Just as we can examine a demand curve being more or less elastic, we can examine the relative elasticity of demand compared to supply. In both instances of this hypothetical this dairy market, producers bear over 50% of the tax, meaning in box cases, supply is relatively more elastic than demand.
Exercises 4.8
1. Suppose a tax is levied in a market in which demand is downward sloping and supply is perfectly elastic. Which of the following statements is/are TRUE? (Assume no externalities.)
I. Producer surplus decreases.
II. The deadweight loss is zero.
III. Consumers bear all the burden of the tax.
a) II only.
b) I and II only.
c) I, II, and III.
d) III only.
2. Which of the following statements about tax incidence and relative elasticities is TRUE?
If demand is relatively inelastic and supply is relatively elastic, then consumers bear more of the burden of a tax.
If supply is perfectly inelastic, then producers bear none of the burden of a tax, no matter what the value of own-price elasticity of demand.
If the relative elasticities of demand and supply are the same, the tax burden is shared equally across consumers and producers.
a) II only.
b) I and III only.
c) I, II, and III.
d) III only.
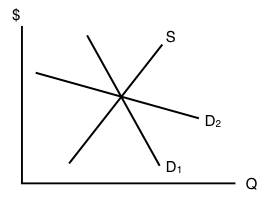
3. The diagram below illustrates the supply curve for a good, and two possible demand curves for that good.

If a price floor (set above the initial equilibrium price) is introduced in this market then:
a) The deadweight loss will be smaller, if demand is D1 than if demand is D2.
b) The decrease in quantity will be smaller, if demand is D1 than if demand is D2.
c) Neither a) nor b) are true.
d) Both a) and b) are true.
4. In which of the following cases will the deadweight loss from taxation be zero?
a) If demand is perfectly elastic.
b) If demand is unit elastic.
c) If demand is perfectly inelastic.
d) Either a) or c) will result in zero deadweight loss from taxation.
5. Which of the following statements about the economic incidence of taxation is TRUE?
I. If demand is elastic, producers will bear a greater burden of the tax than consumers.
II. If supply is perfectly inelastic, producers will bear all the burden of the tax.
III. If the supply curve is perfectly elastic, consumers will bear none of the burden of the tax.
a) II only.
b) I and II only.
c) II and III only.
d) I, II and III.
6. Which of the following correctly describes the equilibrium effects of a per-unit tax, in a market with NO externalities?
a) Consumer and producer surplus increase but social surplus decreases.
b) Consumer and producer surplus decrease but social surplus increases.
c) Consumer surplus, producer surplus, and social surplus all increase.
d) Consumer surplus, producer surplus, and social surplus all decrease
7. Suppose that the price of a good increases. The increase in produce surplus will be:
a) Larger if demand is relatively elastic than if demand is relatively inelastic.
b) Smaller if demand is relatively elastic than if demand is relatively inelastic.
c) Smaller if supply is relatively elastic than if supply is relatively inelastic.
d) Larger if supply is relatively elastic than if supply is relatively inelastic.
Save

