21. Laboratory Analysis of the Immune Response
21.2 Detecting Antigen-Antibody Complexes
Learning Objectives
- Describe various types of assays used to find antigen-antibody complexes
- Describe the circumstances under which antigen-antibody complexes precipitate out of solution
- Explain how antibodies in patient serum can be used to diagnose disease
Laboratory tests to detect antibodies and antigens outside of the body (e.g., in a test tube) are called in vitro assays. When both antibodies and their corresponding antigens are present in a solution, we can often observe a precipitation reaction in which large complexes (lattices) form and settle out of solution. In the next several sections, we will discuss several common in vitro assays.
Precipitin Reactions
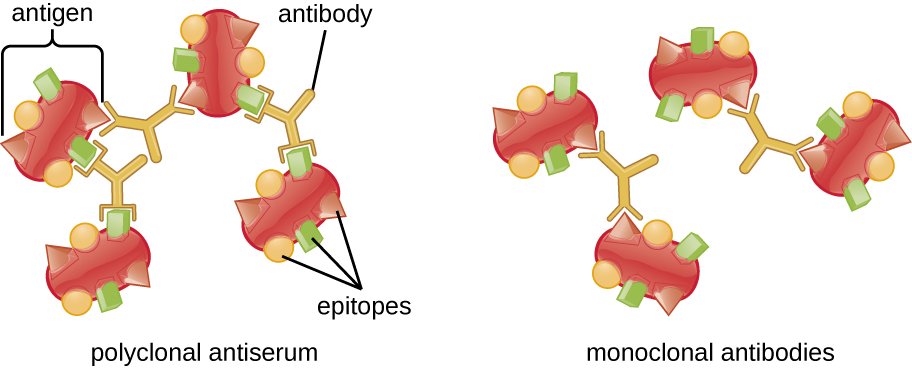
A visible antigen-antibody complex is called a precipitin, and in vitro assays that produce a precipitin are called precipitin reactions. A precipitin reaction typically involves adding soluble antigens to a test tube containing a solution of antibodies. Each antibody has two arms, each of which can bind to an epitope. When an antibody binds to two antigens, the two antigens become bound together by the antibody. A lattice can form as antibodies bind more and more antigens together, resulting in a precipitin (Figure 21.5). Most precipitin tests use a polyclonal antiserum rather than monoclonal antibodies because polyclonal antibodies can bind to multiple epitopes, making lattice formation more likely. Although mAbs may bind some antigens, the binding will occur less often, making it much less likely that a visible precipitin will form.
The amount of precipitation also depends on several other factors. For example, precipitation is enhanced when the antibodies have a high affinity for the antigen. While most antibodies bind antigen with high affinity, even high-affinity binding uses relatively weak non-covalent bonds, so that individual interactions will often break and new interactions will occur.
In addition, for precipitin formation to be visible, there must be an optimal ratio of antibody to antigen. The optimal ratio is not likely to be a 1:1 antigen-to-antibody ratio; it can vary dramatically, depending on the number of epitopes on the antigen and the class of antibody. Some antigens may have only one or two epitopes recognized by the antiserum, whereas other antigens may have many different epitopes and/or multiple instances of the same epitope on a single antigen molecule.
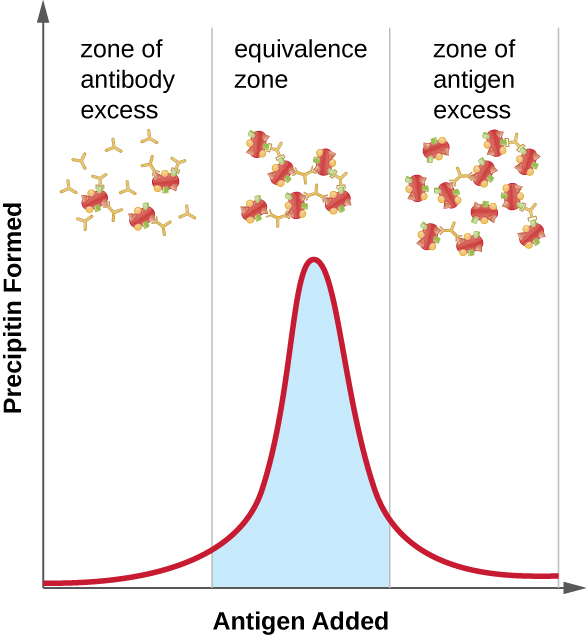
Figure 21.6 illustrates how the ratio of antigen and antibody affects the amount of precipitation. To achieve the optimal ratio, antigen is slowly added to a solution containing antibodies, and the amount of precipitin is determined qualitatively. Initially, there is not enough antigen to produce visible lattice formation; this is called the zone of antibody excess. As more antigen is added, the reaction enters the equivalence zone (or zone of equivalence), where both the optimal antigen-antibody interaction and maximal precipitation occur. If even more antigen were added, the amount of antigen would become excessive and actually cause the amount of precipitation to decline.
- What is a precipitin?
- Why do polyclonal antisera produce a better precipitin reaction?
Precipitin Ring Test
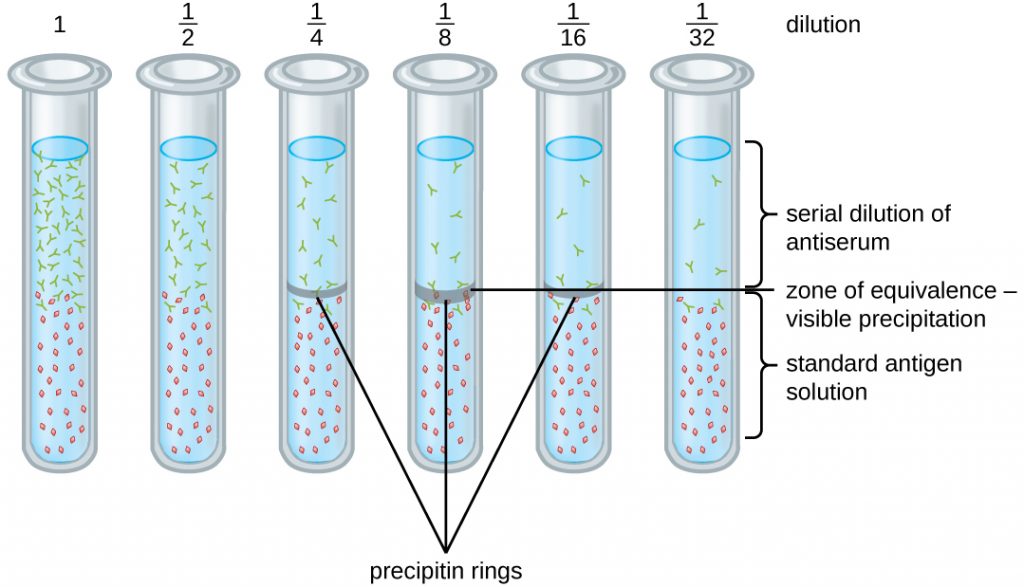
A variety of techniques allow us to use precipitin formation to quantify either antigen concentration or the amount of antibody present in an antiserum. One such technique is the precipitin ring test (Figure 21.7), which is used to determine the relative amount of antigen-specific antibody in a sample of serum. To perform this test, a set of test tubes is prepared by adding an antigen solution to the bottom of each tube. Each tube receives the same volume of solution, and the concentration of antigens is constant (e.g., 1 mg/mL). Next, glycerol is added to the antigen solution in each test tube, followed by a serial dilution of the antiserum. The glycerol prevents mixing of the antiserum with the antigen solution, allowing antigen-antibody binding to take place only at the interface of the two solutions. The result is a visible ring of precipitin in the tubes that have an antigen-antibody ratio within the equivalence zone. This highest dilution with a visible ring is used to determine the titre of the antibodies. The titre is the reciprocal of the highest dilution showing a positive result, expressed as a whole number. In Figure 21.7, the titre is 16.
While a measurement of titre does not tell us in absolute terms how much antibody is present, it does give a measure of biological activity, which is often more important than absolute amount. In this example, it would not be useful to know what mass of IgG were present in the antiserum, because there are many different specificities of antibody present; but it is important for us to know how much of the antibody activity in a patient’s serum is directed against the antigen of interest (e.g., a particular pathogen or allergen).
Ouchterlony Assay
While the precipitin ring test provides insights into antibody-antigen interactions, it also has some drawbacks. It requires the use of large amounts of serum, and great care must be taken to avoid mixing the solutions and disrupting the ring. Performing a similar test in an agar gel matrix can minimize these problems. This type of assay is variously called double immunodiffusion or the Ouchterlony assay for Orjan Ouchterlony,[1] who first described the technique in 1948.
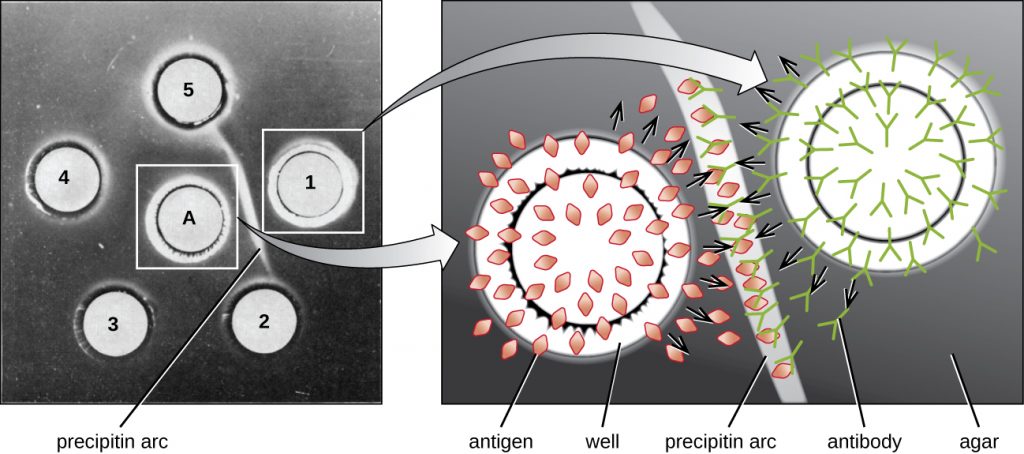
When agar is highly purified, it produces a clear, colourless gel. Holes are punched in the gel to form wells, and antigen and antisera are added to neighbouring wells. Proteins are able to diffuse through the gel, and precipitin arcs form between the wells at the zone of equivalence. Because the precipitin lattice is too large to diffuse through the gel, the arcs are firmly locked in place and easy to see (Figure 21.8).
Although there are now more sensitive and quantitative methods of detecting antibody-antigen interactions, the Ouchterlony test provides a rapid and qualitative way of determining whether an antiserum has antibodies against a particular antigen. The Ouchterlony test is particularly useful when looking for cross-reactivity. We can check an antiserum against a group of closely related antigens and see which combinations form precipitin arcs.
Radial Immunodiffusion Assay
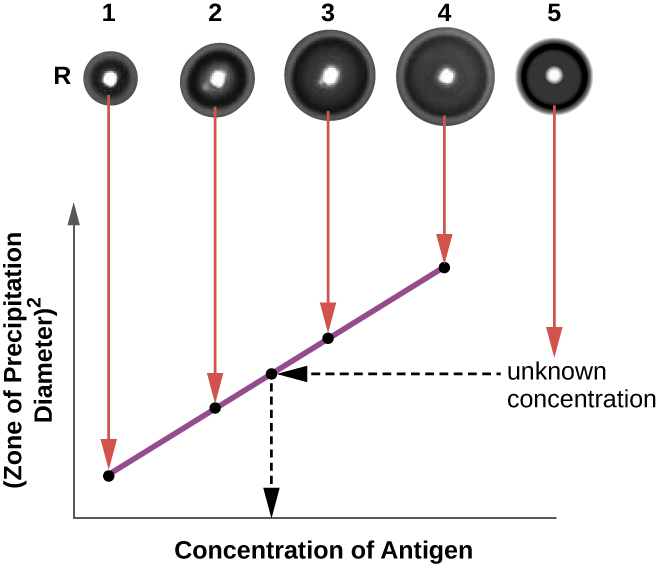
The radial immunodiffusion (RID) assay is similar to the Ouchterlony assay but is used to precisely quantify antigen concentration rather than to compare different antigens. In this assay, the antiserum is added to tempered agar (liquid agar at slightly above 45 °C), which is poured into a small petri dish or onto a glass slide and allowed to cool. Wells are cut in the cooled agar, and antigen is then added to the wells and allowed to diffuse. As the antigen and antibody interact, they form a zone of precipitation. The square of the diameter of the zone of precipitation is directly proportional to the concentration of antigen. By measuring the zones of precipitation produced by samples of known concentration (see the outer ring of samples in Figure 21.9), we can prepare a standard curve for determining the concentration of an unknown solution. The RID assay is a also useful test for determining the concentration of many serum proteins such as the C3 and C4 complement proteins, among others.
- Why does a precipitin ring form in a precipitin ring test, and what are some reasons why a ring might not form?
- Compare and contrast the techniques used in an Ouchterlony assay and a radial immunodiffusion assay.
Flocculation Assays
A flocculation assay is similar to a precipitin reaction except that it involves insoluble antigens such as lipids. A flocculant is similar to a precipitin in that there is a visible lattice of antigen and antibody, but because lipids are insoluble in aqueous solution, they cannot precipitate. Instead of precipitation, flocculation (foaming) is observed in the test tube fluid.
MICRO CONNECTIONS: Using flocculation to Test for Syphilis
Syphilis is a sexually transmitted infection that can cause severe, chronic disease in adults. In addition, it is readily passed from infected mothers to their newborns during pregnancy and childbirth, often resulting in stillbirth or serious long-term health problems for the infant. Unfortunately, syphilis can also be difficult to diagnose in expectant mothers, because it is often asymptomatic, especially in women. In addition, the causative agent, the bacterium Treponema pallidum, is both difficult to grow on conventional lab media and too small to see using routine microcopy. For these reasons, presumptive diagnoses of syphilis are generally confirmed indirectly in the laboratory using tests that detect antibodies to treponemal antigens.
In 1906, German scientist August von Wassermann (1866–1925) introduced the first test for syphilis that relied on detecting anti-treponemal antibodies in the patient’s blood. The antibodies detected in the Wassermann test were anti-phospholipid antibodies that are nonspecific to T. pallidum. Their presence can assist in the diagnosis of syphilis, but because they are nonspecific, they can also lead to false-positive results in patients with other diseases and autoimmune conditions. The original Wasserman test has been modified over the years to minimize false-positives and is now known as the Venereal Disease Research Lab test, better known by its acronym, the VDRL test.
To perform the VDRL test, patient serum or cerebral spinal fluid is placed on a slide with a mixture of cardiolipin (an antigenic phospholipid found in the mitochondrial membrane of various pathogens), lecithin, and cholesterol. The lecithin and cholesterol stabilize the reaction and diminish false positives. Anti-treponemal antibodies from an infected patient’s serum will bind cardiolipin and form a flocculant. Although the VDRL test is more specific than the original Wassermann assay, false positives may still occur in patients with autoimmune diseases that cause extensive cell damage (e.g., systemic lupus erythematosus).
Neutralization Assay
To cause infection, viruses must bind to receptors on host cells. Antiviral antibodies can neutralize viral infections by coating the virions, blocking the binding (Figure 7). This activity neutralizes virions and can result in the formation of large antibody-virus complexes (which are readily removed by phagocytosis) or by antibody binding to the virus and blocking its binding to host cell receptors. This neutralization activity is the basis of neutralization assays, sensitive assays used for diagnoses of viral infections.
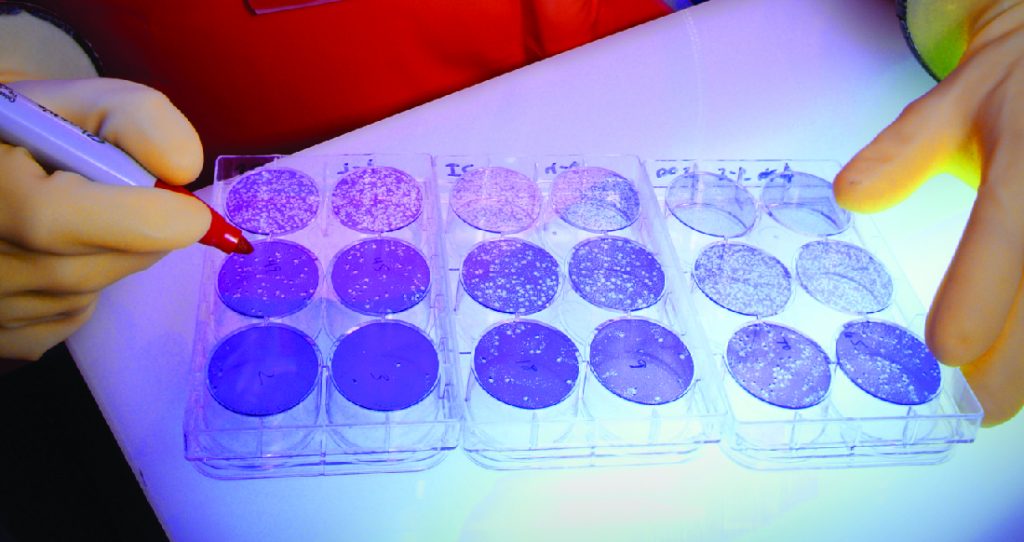
When viruses infect cells, they often cause damage (cytopathic effects) that may include lysis of the host cells. Cytopathic effects can be visualized by growing host cells in a petri dish, covering the cells with a thin layer of agar, and then adding virus (see Isolation, Culture, and Identification of Viruses). The virus will diffuse very slowly through the agar. A virus will enter a host cell, proliferate (causing cell damage), be released from the dead host cell, and then move to neighbouring cells. As more and more cells die, plaques of dead cells will form (Figure 21.10).
During the course of a viral infection, the patient will mount an antibody response to the virus, and we can quantify those antibodies using a plaque reduction assay. To perform the assay, a serial dilution is carried out on a serum sample. Each dilution is then mixed with a standardized amount of the suspect virus. Any virus-specific antibodies in the serum will neutralize some of the virus. The suspensions are then added to host cells in culture to allow any non-neutralized virus to infect the cells and form plaques after several days. The titre is defined as the reciprocal of the highest dilution showing a 50% reduction in plaques. Titre is always expressed as a whole number. For example, if a 1/64 dilution was the highest dilution to show 50% plaque reduction, then the titre is 64.
The presence of antibodies in the patient’s serum does not tell us whether the patient is currently infected or was infected in the past. Current infections can be identified by waiting two weeks and testing another serum sample. A four-fold increase in neutralizing titre in this second sample indicates a new infection.
- In a neutralization assay, if a patient’s serum has high numbers of antiviral antibodies, would you expect to see more or fewer plaques?
Immunoelectrophoresis
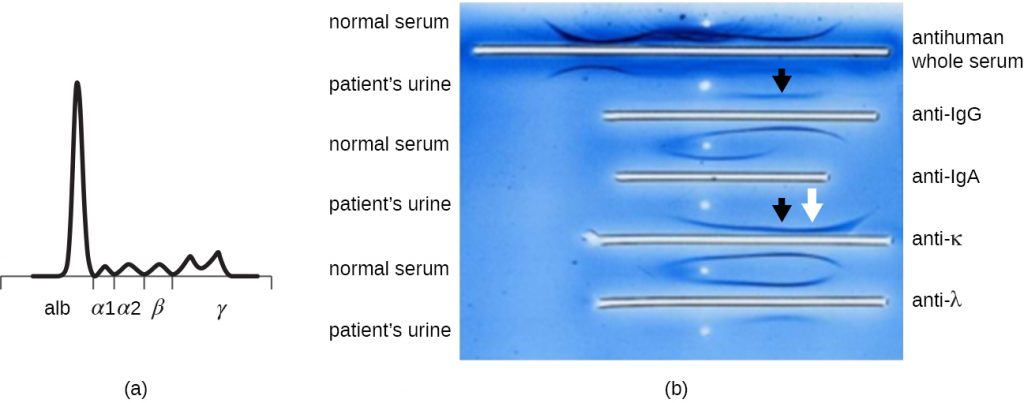
When a patient has elevated protein levels in the blood or is losing protein in the urine, a clinician will often order a polyacrylamide gel electrophoresis (PAGE) assay (see Visualizing and Characterizing DNA, RNA, and Protein). This assay compares the relative abundance of the various types of serum proteins. Abnormal protein electrophoresis patterns can be further studied using immunoelectrophoresis (IEP). The IEP begins by running a PAGE. Antisera against selected serum proteins are added to troughs running parallel to the electrophoresis track, forming precipitin arcs similar to those seen in an Ouchterlony assay (Figure 21.11). This allows the identification of abnormal immunoglobulin proteins in the sample.
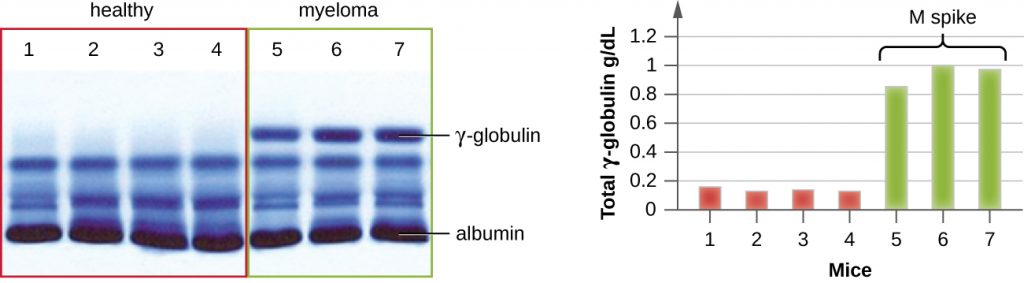
IEP is particularly useful in the diagnosis of multiple myeloma, a cancer of antibody-secreting cells. Patients with multiple myeloma cannot produce healthy antibodies; instead they produce abnormal antibodies that are monoclonal proteins (M proteins). Thus, patients with multiple myeloma will present with elevated serum protein levels that show a distinct band in the gamma globulin region of a protein electrophoresis gel and a sharp spike (in M protein) on the densitometer scan rather than the normal broad smear (Figure 21.12). When antibodies against the various types of antibody heavy and light chains are used to form precipitin arcs, the M protein will cause distinctly skewed arcs against one class of heavy chain and one class of light chain as seen in Figure 21.11.
MICRO CONNECTIONS: Protein Electrophoresis and the Characterization of Immunoglobulin Structure
The advent of electrophoresis ultimately led to researching and understanding the structure of antibodies. When Swedish biochemist Arne Tiselius (1902–1971) published the first protein electrophoresis results in 1937,[2] he could identify the protein albumin (the smallest and most abundant serum protein) by the sharp band it produced in the gel. The other serum proteins could not be resolved in a simple protein electrophoresis, so he named the three broad bands, with many proteins in each band, alpha, beta, and gamma globulins. Two years later, American immunologist Elvin Kabat (1914–2000) traveled to Sweden to work with Tiselius using this new technique and showed that antibodies migrated as gamma globulins.[3] With this new understanding in hand, researchers soon learned that multiple myeloma, because it is a cancer of antibody-secreting cells, could be tentatively diagnosed by the presence of a large M spike in the gamma-globulin region by protein electrophoresis. Prior to this discovery, studies on immunoglobulin structure had been minimal, because of the difficulty of obtaining pure samples to study. Sera from multiple myeloma patients proved to be an excellent source of highly enriched monoclonal immunoglobulin, providing the raw material for studies over the next 20-plus years that resulted in the elucidation of the structure of immunoglobulin.
- In general, what does an immunoelectrophoresis assay accomplish?
Immunoblot Assay: The Western Blot
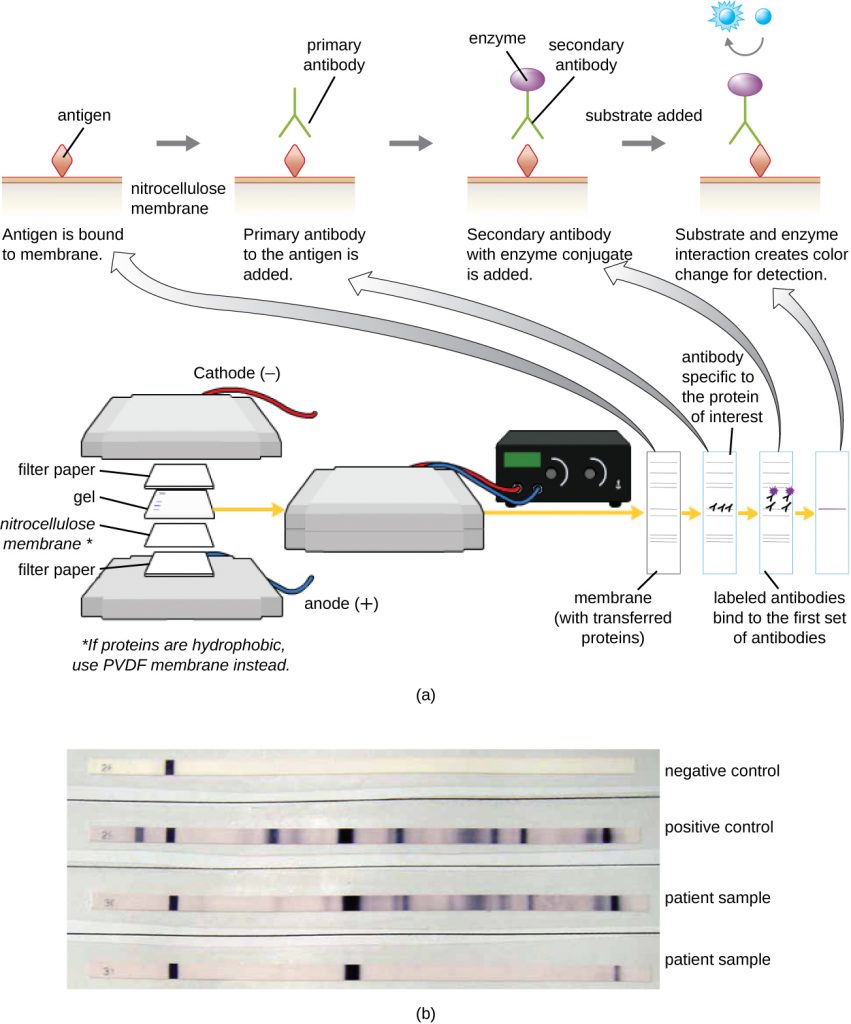
After performing protein gel electrophoresis, specific proteins can be identified in the gel using antibodies. This technique is known as the western blot. Following separation of proteins by PAGE, the protein antigens in the gel are transferred to and immobilized on a nitrocellulose membrane. This membrane can then be exposed to a primary antibody produced to specifically bind to the protein of interest. A second antibody equipped with a molecular beacon will then bind to the first. These secondary antibodies are coupled to another molecule such as an enzyme or a fluorophore (a molecule that fluoresces when excited by light). When using antibodies coupled to enzymes, a chromogenic substrate for the enzyme is added. This substrate is usually colourless but will develop colour in the presence of the antibody. The fluorescence or substrate colouring identifies the location of the specific protein in the membrane to which the antibodies are bound (Figure 21.13).
Typically, polyclonal antibodies are used for western blot assays. They are more sensitive than mAbs because of their ability to bind to various epitopes of the primary antigen, and the signal from polyclonal antibodies is typically stronger than that from mAbs. Monoclonal antibodies can also be used; however, they are much more expensive to produce and are less sensitive, since they are only able to recognize one specific epitope.
Several variations of the western blot are useful in research. In a southwestern blot, proteins are separated by SDS-PAGE, blotted onto a nitrocellulose membrane, allowed to renature, and then probed with a fluorescently or radioactively labeled DNA probe; the purpose of the southwestern is to identify specific DNA-protein interactions. Far-western blots are carried out to determine protein-protein interactions between immobilized proteins (separated by SDS-PAGE, blotted onto a nitrocellulose membrane, and allowed to renature) and non-antibody protein probes. The bound non-antibody proteins that interact with the immobilized proteins in a far-western blot may be detected by radiolabeling, fluorescence, or the use of an antibody with an enzymatic molecular beacon.
- What is the function of the enzyme in the immunoblot assay?
Complement-Mediated Immunoassay
One of the key functions of antibodies is the activation (fixation) of complement. When antibody binds to bacteria, for example, certain complement proteins recognize the bound antibody and activate the complement cascade. In response, other complement proteins bind to the bacteria where some serve as opsonins to increase the efficiency of phagocytosis and others create holes in gram-negative bacterial cell membranes, causing lysis. This lytic activity can be used to detect the presence of antibodies against specific antigens in the serum.
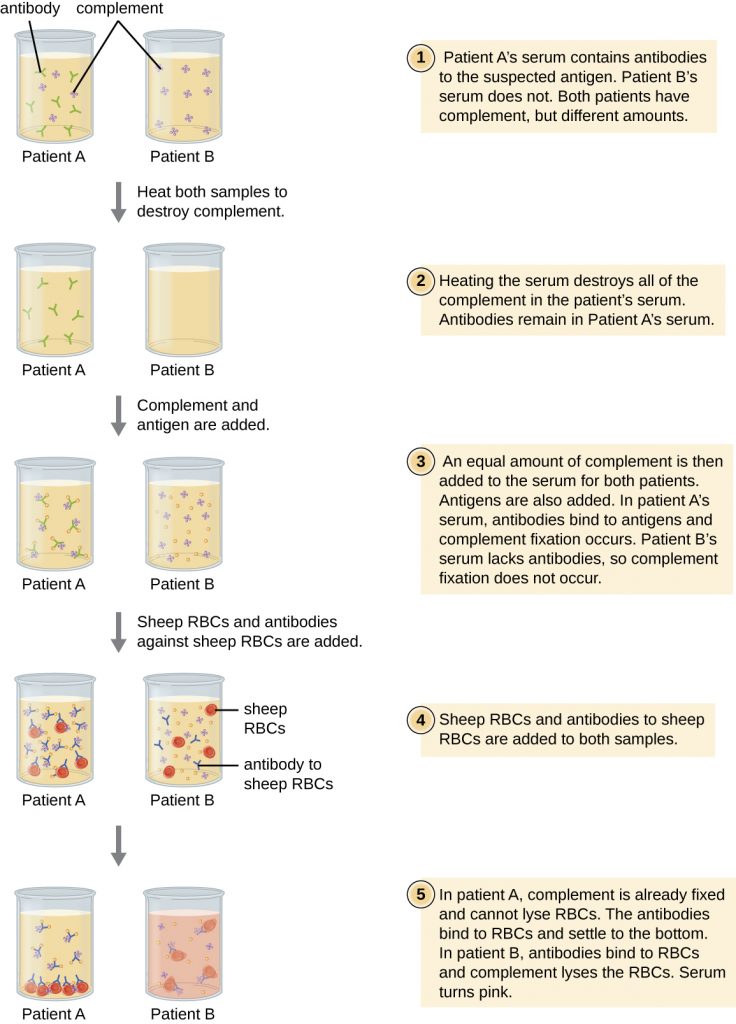
Red blood cells are good indicator cells to use when evaluating complement-mediated cytolysis. Hemolysis of red blood cells releases hemoglobin, which is a brightly coloured pigment, and hemolysis of even a small number of red cells will cause the solution to become noticeably pink (Figure 21.14). This characteristic plays a role in the complement fixation test, which allows the detection of antibodies against specific pathogens. The complement fixation test can be used to check for antibodies against pathogens that are difficult to culture in the lab such as fungi, viruses, or the bacteria Chlamydia.
To perform the complement fixation test, antigen from a pathogen is added to patient serum. If antibodies to the antigen are present, the antibody will bind the antigen and fix all the available complement. When red blood cells and antibodies against red blood cells are subsequently added to the mix, there will be no complement left to lyse the red cells. Thus, if the solution remains clear, the test is positive. If there are no anti-pathogen antibodies in the patient’s serum, the added antibodies will activate the complement to lyse the red cells, yielding a negative test (Figure 10).

- In a complement fixation test, if the serum turns pink, does the patient have antibodies to the antigen or not? Explain.
Table 21.2 summarizes the various types of antibody-antigen assays discussed in this section.
Table 21.2. Mechanisms of Select Antibody-Antigen Assays
| Mechanisms of Select Antibody-Antigen Assays | ||
|---|---|---|
| Type of Assay | Mechanism | Examples |
| Precipitation | Antibody binds to soluble antigen, forming a visible precipitin | Precipitin ring test to visualize lattice formation in solution |
| Immunoelectrophoresis to examine distribution of antigens following electrophoresis | ||
| Ouchterlony assay to compare diverse antigens | ||
| Radial immunodiffusion assay to quantify antigens | ||
| Flocculation | Antibody binds to insoluble molecules in suspension, forming visible aggregates | VDRL test for syphilis |
| Neutralization | Antibody binds to virus, blocking viral entry into target cells and preventing formation of plaques | Plaque reduction assay for detecting presence of neutralizing antibodies in patient sera |
| Complement activation | Antibody binds to antigen, inducing complement activation and leaving no complement to lyse red blood cells | Complement fixation test for patient antibodies against hard-to-culture bacteria such as Chlamydia |
Key Takeaways
- When present in the correct ratio, antibody and antigen will form a precipitin, or lattice that precipitates out of solution.
- A precipitin ring test can be used to visualize lattice formation in solution. The Ouchterlony assay demonstrates lattice formation in a gel. The radial immunodiffusion assay is used to quantify antigen by measuring the size of a precipitation zone in a gel infused with antibodies.
- Insoluble antigens in suspension will form flocculants when bound by antibodies. This is the basis of the VDRL test for syphilis in which anti-treponemal antibodies bind to cardiolipin in suspension.
- Viral infections can be detected by quantifying virus-neutralizing antibodies in a patient’s serum.
- Different antibody classes in plasma or serum are identified by using immunoelectrophoresis.
- The presence of specific antigens (e.g., bacterial or viral proteins) in serum can be demonstrated by western blot assays, in which the proteins are transferred to a nitrocellulose membrane and identified using labeled antibodies.
- In the complement fixation test, complement is used to detect antibodies against various pathogens.
Multiple Choice
Fill in the Blank
Short Answer
- Explain why haemolysis in the complement fixation test is a negative test for infection.
- What is meant by the term “neutralizing antibodies,” and how can we quantify this effect using the viral neutralization assay?
Critical Thinking
- Both IgM and IgG antibodies can be used in precipitation reactions. However, one of these immunoglobulin classes will form precipitates at much lower concentrations than the other. Which class is this, and why is it so much more efficient in this regard?
Media Attributions
- OSC_Microbio_20_02_Preciptin
- OSC_Microbio_20_02_Precipform
- OSC_Microbio_20_02_PRing
- OSC_Microbio_20_02_Ouchter
- OSC_Microbio_20_02_RID
- OSC_Microbio_20_02_Plaques
- OSC_Microbio_20_02_IEP
- OSC_Microbio_20_02_Spike
- OSC_Microbio_20_02_Western
- OSC_Microbio_20_02_Complement
- microbiology sign © Nick Youngson
- Ouchterlony, Örjan, “In Vitro Method for Testing the Toxin-Producing Capacity of Diphtheria Bacteria,” Acta Pathologica Microbiologica Scandinavica 26, no. 4 (1949): 516-24. ↵
- Tiselius, Arne, “Electrophoresis of Serum Globulin: Electrophoretic Analysis of Normal and Immune Sera,” Biochemical Journal 31, no. 9 (1937): 1464. ↵
- Tiselius, Arne and Elvin A. Kabat. “An Electrophoretic Study of Immune Sera and Purified Antibody Preparations,” The Journal of Experimental Medicine 69, no. 1 (1939): 119-31. ↵
