Appendix C| Metabolic Pathways
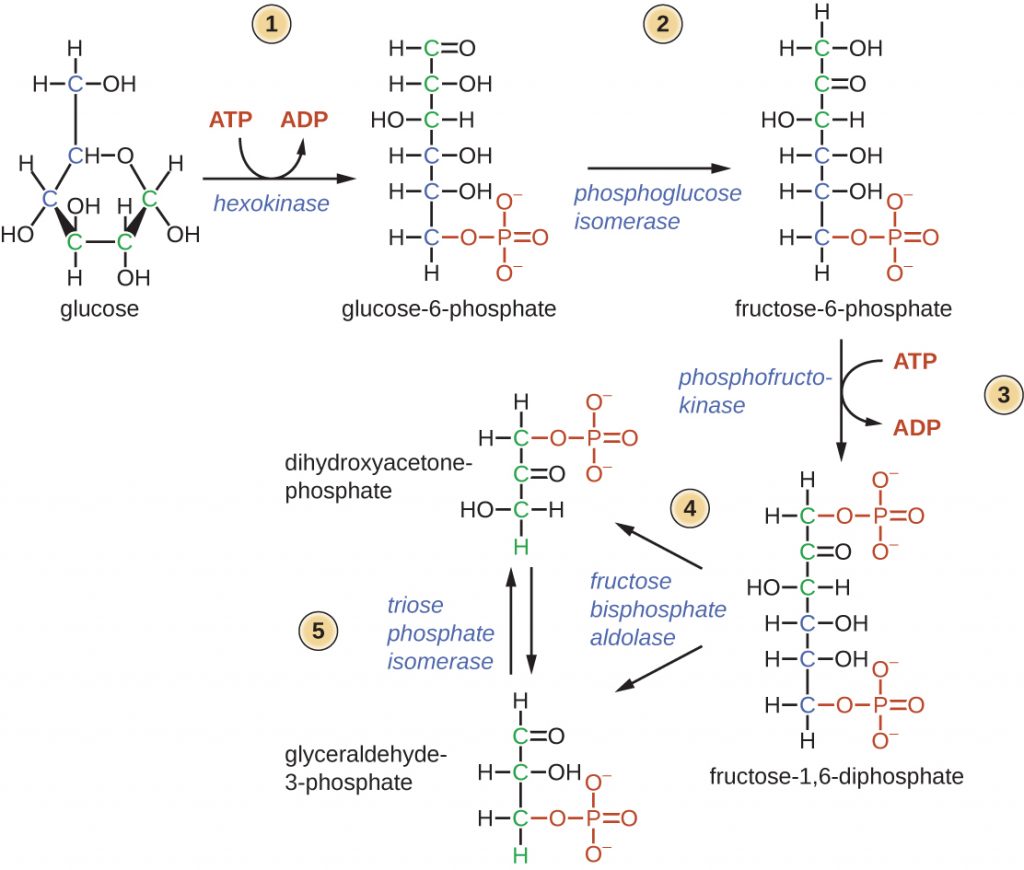
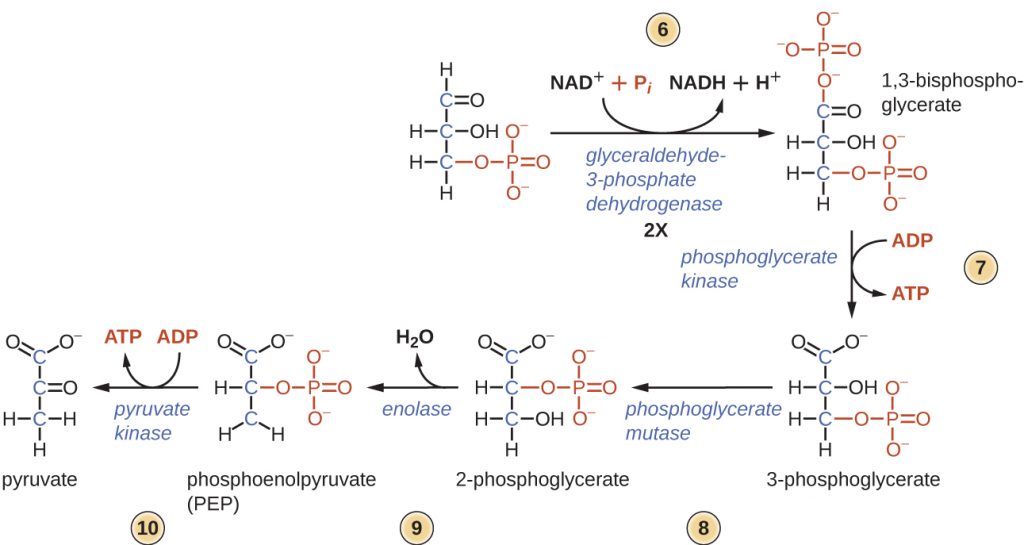
Glycolysis
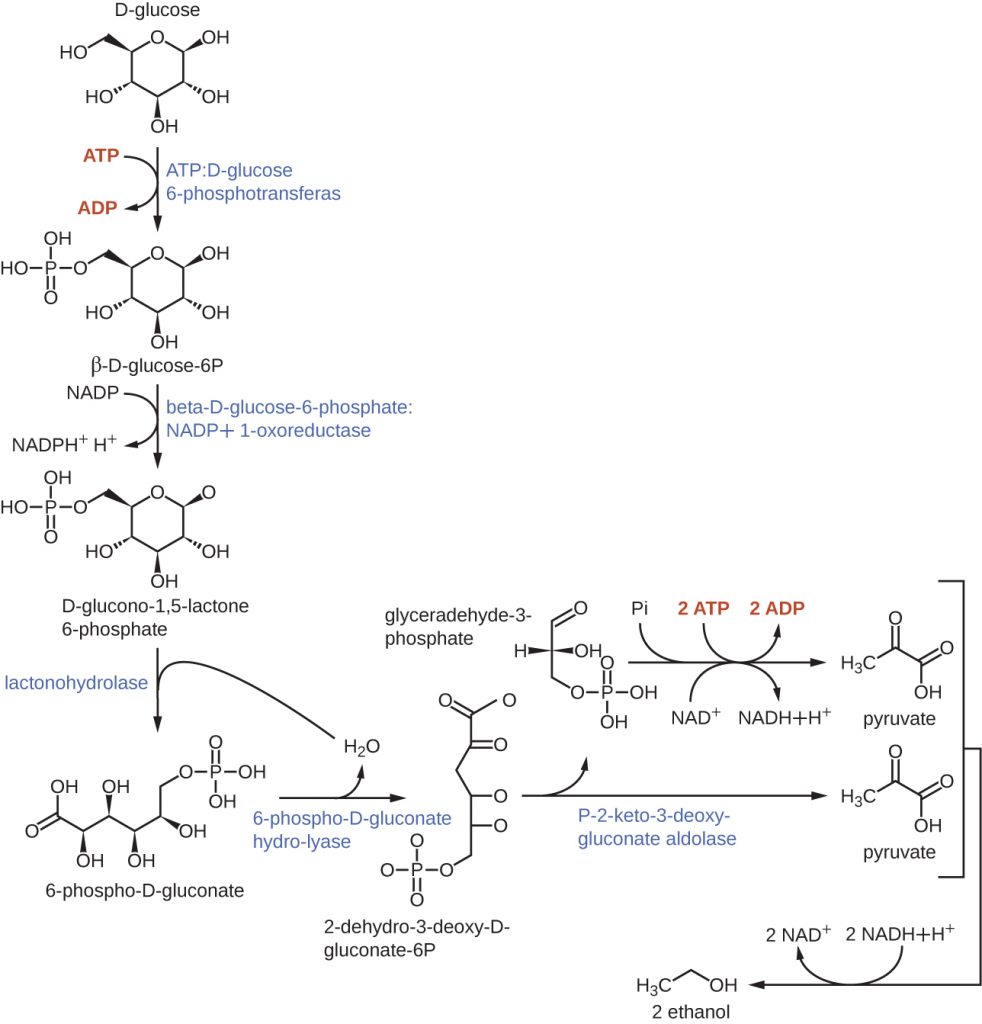
Entner–Doudoroff Pathway
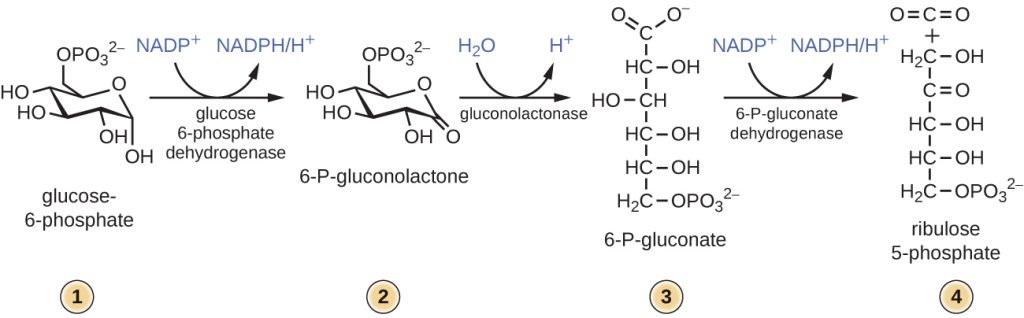
The Pentose-Phosphate Pathway
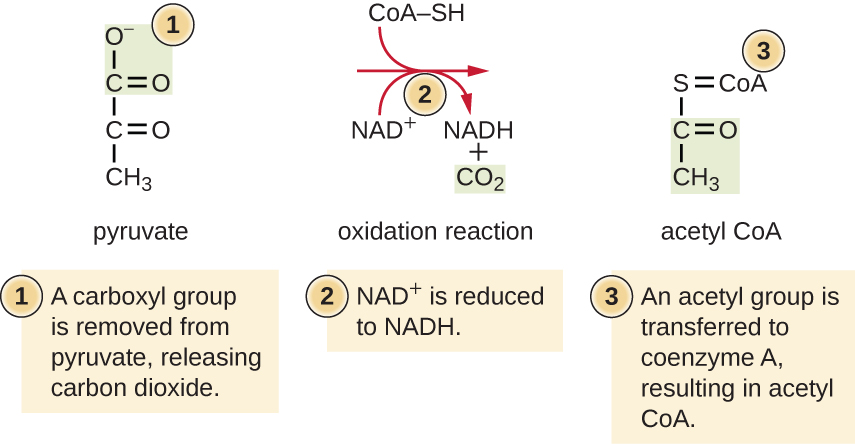
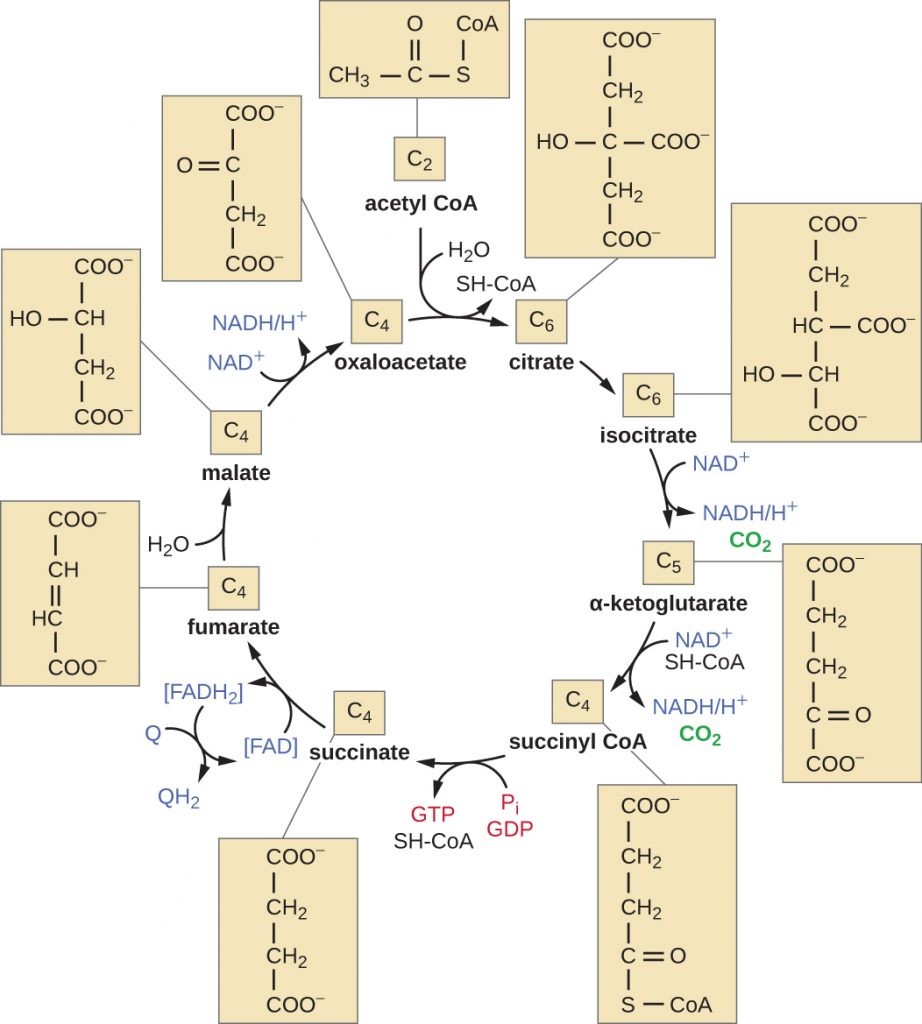
TCA Cycle
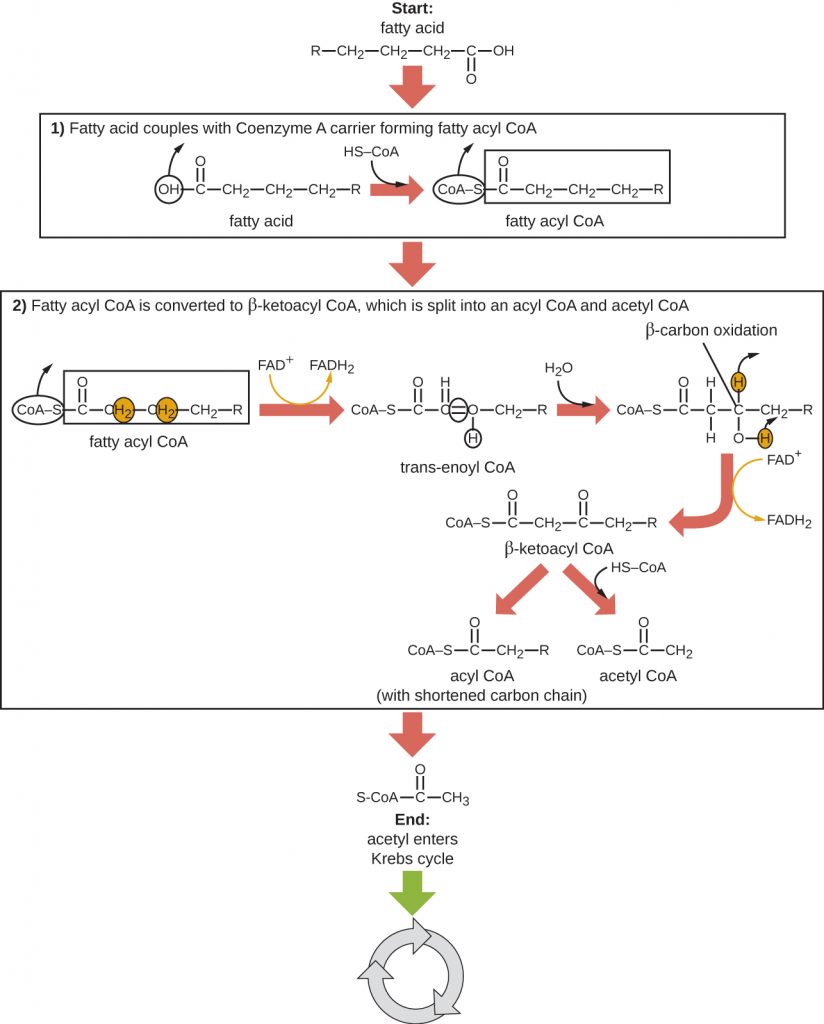
Beta Oxidation
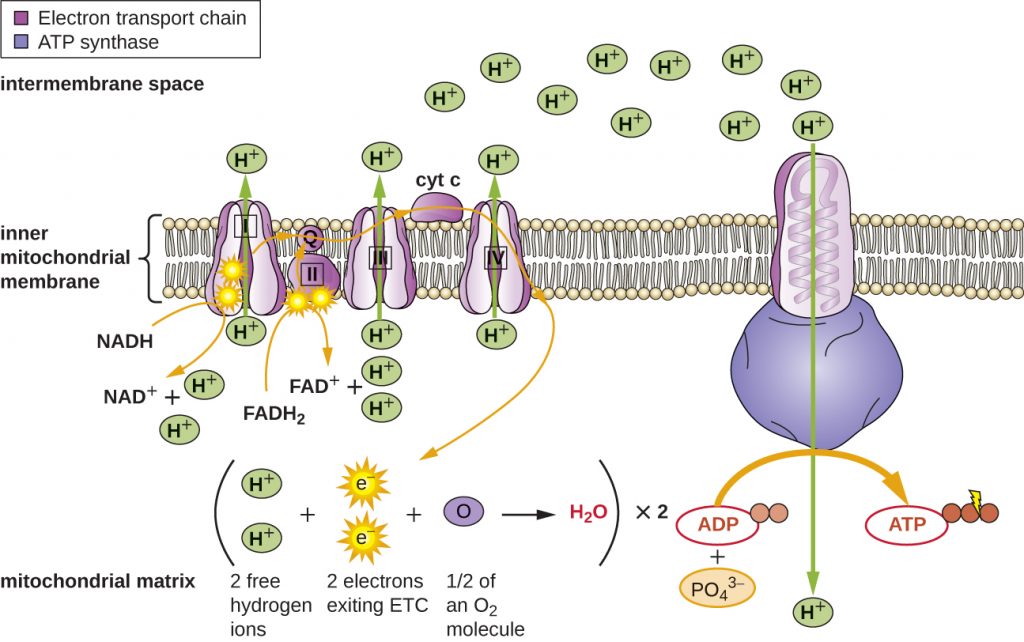
Oxidative Phosphorylation
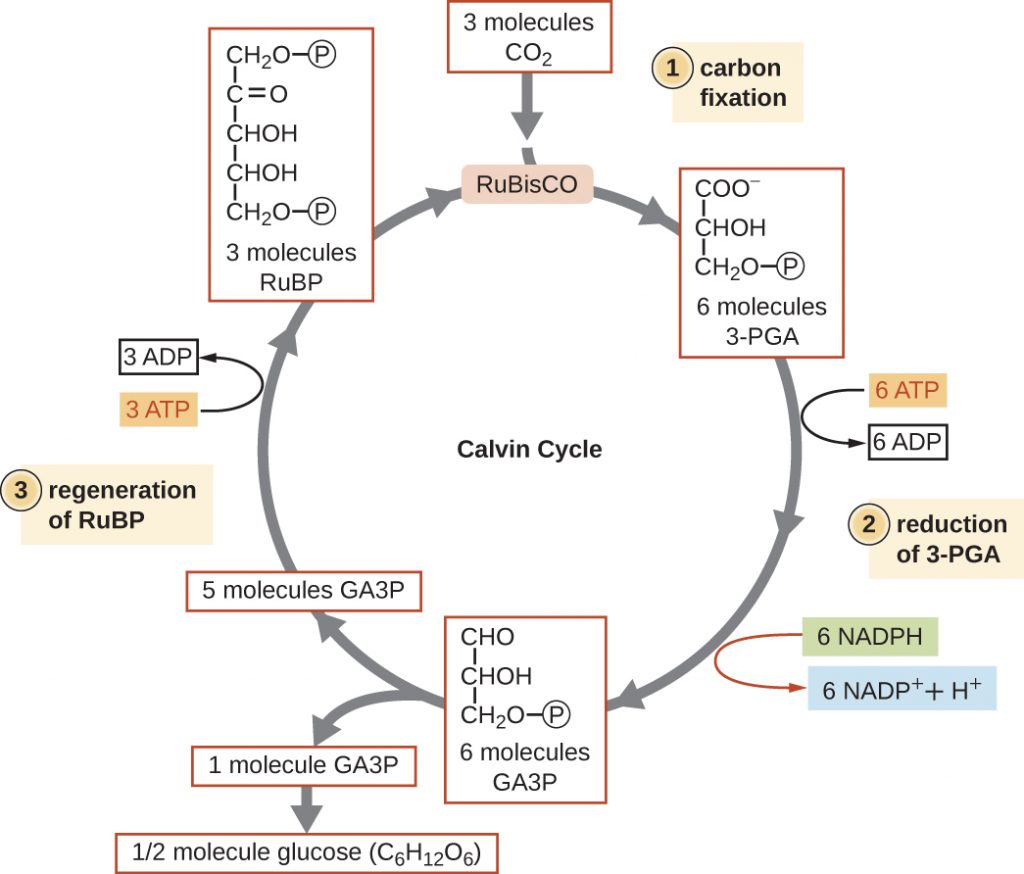
Calvin-Benson Cycle
Media Attributions
- OSC_Microbio_00_CC_glyc1
- OSC_Microbio_00_CC_glyc2
- OSC_Microbio_00_CC_ED
- OSC_Microbio_00_CC_PP
- OSC_Microbio_00_CC_ACA
- OSC_Microbio_00_CC_TCA
- OSC_Microbio_00_CC_BO
- OSC_Microbio_00_CC_OP
- OSC_Microbio_00_CC_CB
