12.8. Analysis and Reporting Tools
The idea behind analysis tools that allow queries and reporting is to present users with a subset of requested data, selected, sorted, ordered, calculated, and compared, as needed. Managers use these tools to see and explore what’s happening inside their organizations. Canned reports provide regular summaries of information in a predetermined format. They’re often developed by information systems staff and formats can be difficult to alter. By contrast, ad hoc reporting tools allow users to dive in and create their own reports, selecting fields, ranges, and other parameters to build their own reports on the fly.
A subcategory of reporting tools is referred to as Online Analytical Processing (OLAP)(pronounced “oh-lap”). Data used in OLAP reporting is usually sourced from standard relational databases, but it’s calculated and summarized in advance, across multiple dimensions, with the data stored in a special database called a data cube. This extra setup step makes OLAP fast (sometimes one thousand times faster than performing comparable queries against conventional relational databases). Given this kind of speed boost, it’s not surprising that data cubes for OLAP access are often part of a firm’s data mart and data warehouse efforts.
A manager using an OLAP tool can quickly explore and compare data across multiple factors such as time, geography, product lines, and so on. In fact, OLAP users often talk about how they can “slice and dice” their data, “drilling down” inside the data to uncover new insights. And while conventional reports are usually presented as a summarized list of information, OLAP results look more like a spreadsheet, with the various dimensions of analysis in rows and columns, with summary values at the intersection.
Data Visualization
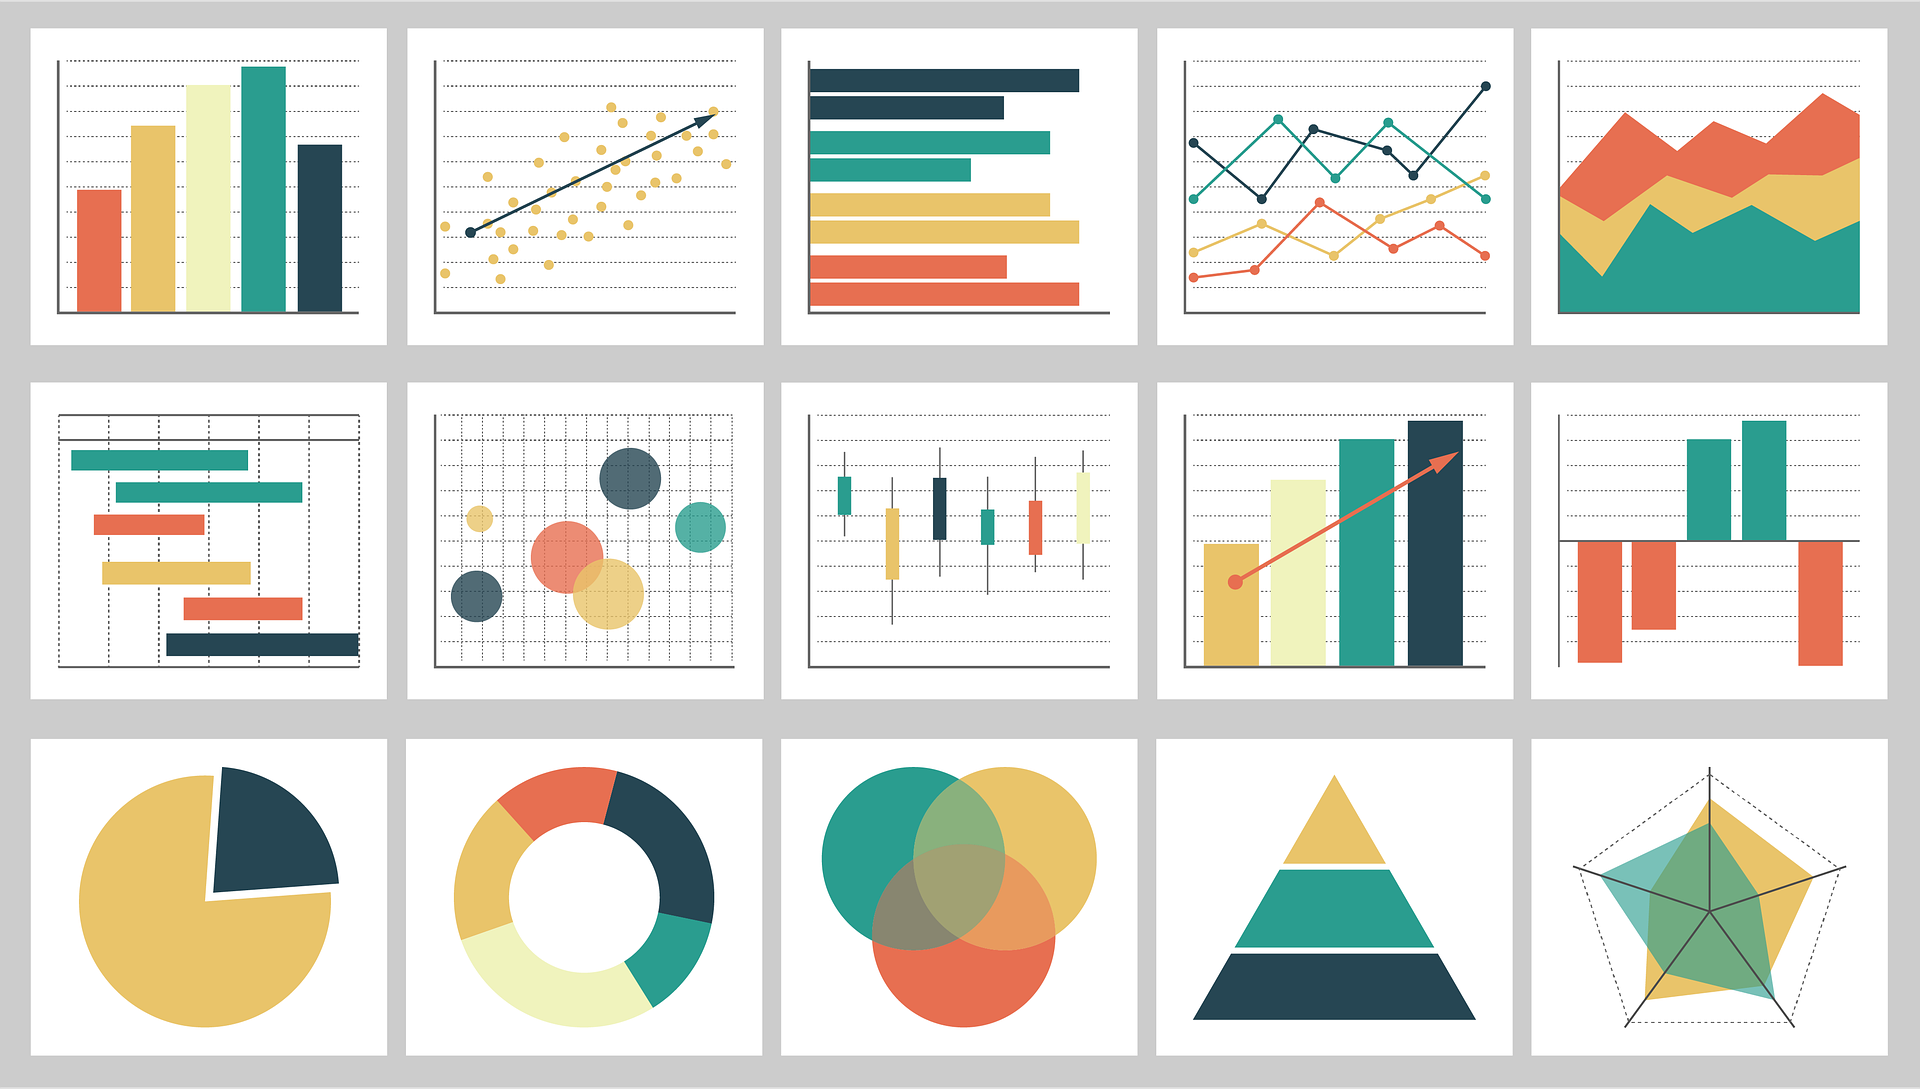
Data visualization is the graphical representation of information and data. These graphical representations (such as charts, graphs, and maps) can quickly summarize data in a way that is more intuitive and can lead to new insights and understandings. Just as a picture of a landscape can convey much more than a paragraph of text attempting to describe it, graphical representation of data can quickly make meaning of large amounts of data. Many times, visualizing data is the first step towards a deeper analysis and understanding of the data collected by an organization. Examples of data visualization software include Tableau and Google Data Studio.
Dashboards are a type of data visualization that provide a heads-up display of critical indicators, letting managers get a graphical glance at key performance metrics. Some tools may allow data to be exported into spreadsheets. Even the lowly spreadsheet can be a powerful tool for modelling “what if” scenarios and creating additional reports. However, if data can be easily exported, then it can potentially leave the firm dangerously exposed, raising privacy, security, legal, and competitive concerns.
Data Mining
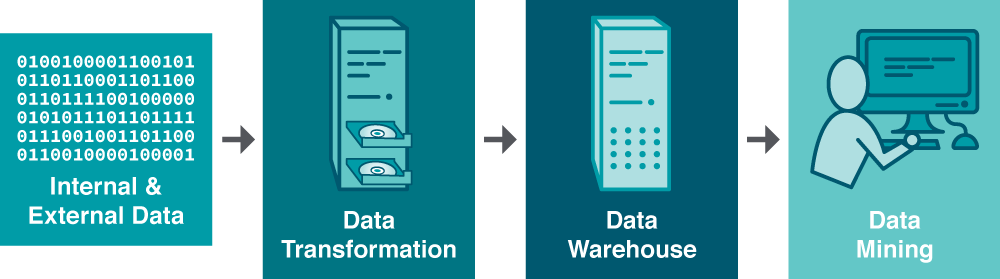
While reporting tools can help users explore data, modern data sets can be so large that it might be impossible for humans to spot underlying trends. That’s where data mining can help. Data mining is the process of analyzing data to find previously unknown and interesting trends, patterns, and associations in order to make decisions. Generally, data mining is accomplished through automated means against extremely large data sets, such as a data warehouse. Some of the key areas where businesses are leveraging data mining include the following:
| Customer segmentation | Figuring out which customers are likely to be the most valuable to a firm. |
| Marketing and promotion targeting | Identifying which customers will respond to which offers at which price at what time. |
| Market basket analysis | Determining which products customers buy together, and how an organization can use this information to cross-sell more products or services. |
| Collaborative filtering | Personalizing an individual customer’s experience based on the trends and preferences identified across similar customers. |
| Customer churn | Determining which customers are likely to leave, and what tactics can help the firm avoid unwanted defections. |
| Fraud detection | Uncovering patterns consistent with criminal activity. |
| Financial modeling | Building trading systems to capitalize on historical trends. |
| Hiring and promotion | Identifying characteristics consistent with employee success in the firm’s various roles. |
Model Considerations
For data mining to work, two critical conditions need to be present:
- Clean and consistent data. Deceive your systems with bad data and your models are worthless. It is important that the data that is input into the system is accurate and consistent
- Data should reflect current and future trends. As well historical consistency should be considered. Computer-driven investment models can be very effective when the market behaves as it has in the past. But models are blind when faced with extreme and unusual events that never occurred in the data used to build the model.
Data mining presents a host of other perils, as well. It’s possible to over-engineer a model, building it with so many variables that the solution arrived at might only work on the subset of data you’ve used to create it. You might also be looking at a random but meaningless statistical fluke. One way to test to see if you’re looking at a random occurrence in the numbers is to divide your data, building your model with one portion of the data, and using another portion to verify your results. This is the approach Netflix has used to test results achieved by teams in the Netflix Prize, the firm’s million-dollar contest for improving the predictive accuracy of its movie recommendation engine. Finally, sometimes a pattern is uncovered but determining the best choice for a response is less clear. First findings don’t always reveal an optimal course of action.
Skills Required
These modelling considerations highlight the importance of recruiting a data mining and business analytics team that possesses three critical skills:
| Information technology | For understanding how to pull together data, and for selecting analysis tools. |
| Statistics | For building models and interpreting the strength and validity of results. |
| Business knowledge | For helping set system goals, requirements, and offering deeper insight into what the data really says about the firm’s operating environment. |
Miss one of these key functions and your team could make some major mistakes.
“11.6 The Business Intelligence Toolkit” by University of Minnesota is licensed under a Creative Commons Attribution-NonCommercial-ShareAlike 4.0 International License, except where otherwise noted.
Data Visualization definition adapted from “Chapter 4: Data and Databases” from Information Systems for Business and Beyond (2019) by David Bourgeois is licensed under a Creative Commons Attribution-NonCommercial 4.0 International License, except where otherwise noted.
“Chapter 15: Managing Information and Technology” from Maritime Management: Micro and Small Businesses Copyright © 2019 by Matthew Pauley is licensed under a Creative Commons Attribution-NonCommercial-ShareAlike 4.0 International License, except where otherwise noted.
