12.6. Business Intelligence & Data Analytics
With the rise of Big Data and a myriad of new tools and techniques at their disposal, businesses are learning how to use information to their advantage. The term business intelligence describes the process that organizations take to collect and analyze data in the hopes of obtaining a competitive advantage. Business intelligence is really an organizational process as much as it is a set of technologies. Besides using their own data, stored in data warehouses (more on this later), firms often purchase information from data brokers to get a big-picture understanding of their industries and the economy. The results of analysis can drive organizational strategies and provide competitive advantage.
Data Brokers
Data brokers collect and sell data based on online activity. Digital marketing company WebFX estimates that there are more than 4,000 data brokers worldwide. Digital marketers use this information to help direct their advertising and product development efforts. The data broker market in Canada is flourishing due to less safeguards on personal information (McClelland, 2021, August 27).
All the terminology around business intelligence can be confusing, as often the terms are used interchangeably. What is the difference between business intelligence, data science and data analytics? Much like information technology and information systems, the terms are differentiated on the components involved. In the data world, the components consist of engineering, analysis, and communication. Combining the terms in different ways will yield various ‘areas of focus’.
| Data Engineering | Refers to the design, creation, and structure of data and datasets. |
| Data Analysis | Refers to the techniques used to refine and manipulate data into information. |
| Data Communication | Is defined as the flow of data from a source(s) to the user. |
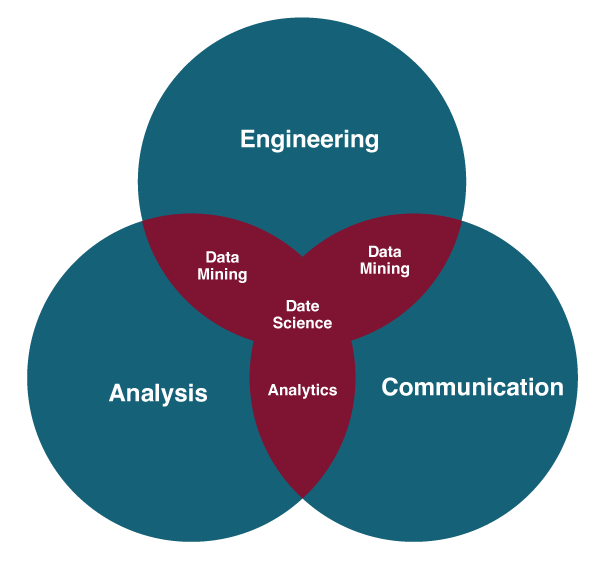
Data Science
Combining all three areas (engineering, communication and analysis) results in the field of data science. Data Science is the analysis of large data sets to find new knowledge. The field of data science is constantly changing, and data scientists are on the cutting edge of work in areas such as artificial intelligence and neural networks. While a data scientist does many different things, their focus is generally on analyzing large data sets using various programming methods and software tools to create new knowledge for their organization. For example, data scientists look at building new models and algorithms to extract data in different ways. Data scientists are skilled in machine learning.
Data Analytics
Combining analysis and communication results in data analytics. Data analytics looks at the past data to try and understand what happened and can also make predictions for the future. Data analytics is focused on finding answers to questions by analyzing trends and creating visual representations, like dashboards whereas data science is a broad concept that focuses on figuring out the questions that should be asked of the data. Whereas business intelligence focuses on what happened in the past up until now. It helps to identify trends in the past, and data analysis can look to the future. To learn more about the history of business intelligence and its evolution see this see this infographic.
Data Analytics Types
Analytics is a very broad term, but no matter the type of data, or size of data you are using, generally all analytics can be categorized in four ways: describe, diagnose, predict, and prescribe. These four categories range from summarizing historical information to providing insight for the future by investigating the data and attempting to answer the following questions:
| Descriptive Analytics | What happened? |
| Diagnostic Analytics | Why did it happen? |
| Predictive Analytics | What might happen? |
| Prescriptive Analytics | What to do next? |
Calculating some summary statistics such as mean, median, mode and standard deviation is an example of descriptive analytics. Similarly matching, or creating a scatter plot diagram are examples of diagnostic techniques that can help identify outliers. Predictive techniques involve using regression analysis and attempts to find similarities between historical data sets to be able to forecast into the future. Lastly, prescriptive analytics involve using decision support systems, machine learning and artificial intelligence to analyze the information and recommend a course of action. Multiple predictions are generated and an optimized solution is recommended. For example, if you use a GPS on a long road trip, you may have experienced ‘dynamic route updates’, or the suggestion of new alternate routes that may be quicker due to slowing traffic or an accident.
“Chapter 4: Data and Databases” from Information Systems for Business and Beyond (2019) by David Bourgeois is licensed under a Creative Commons Attribution-NonCommercial 4.0 International License, except where otherwise noted.
