9.2 Aggregate Demand
Aggregate demand ([latex]AD[/latex]) refers to total spending in an economy on domestic goods and services. It includes all four components of spending: consumption expenditure, investment expenditure, government expenditure, and net export expenditure (exports minus imports). Several factors determine this demand, but one is the aggregate price level. The aggregate demand ([latex]AD[/latex]) curve shows the total spending on domestic goods and services at each price level.
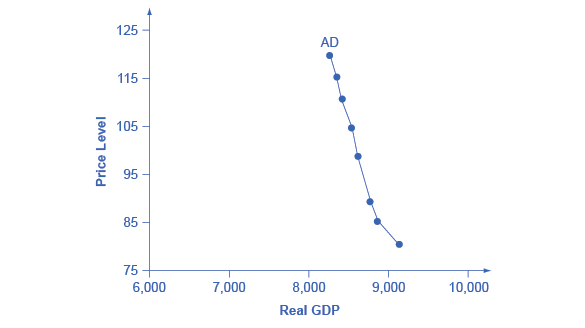
Figure 9.4 presents an aggregate demand ([latex]AD[/latex]) curve. Like the aggregate supply curve, the horizontal axis shows real GDP, and the vertical axis shows the price level. The [latex]AD[/latex] curve is downward sloping from left to right, which means that a decrease in the aggregate price level leads to an increase in the amount of total spending on goods and services. Even though the [latex]AD[/latex] curve looks like a microeconomic demand curve, it doesn’t operate the same way. Rather, the reasons behind this negative relationship are related to how changes in the price level affect the different components of aggregate demand. Recall that aggregate demand consists of consumption spending ([latex]C[/latex]), investment spending ([latex]I[/latex]), government spending ([latex]G[/latex]), and spending on exports ([latex]X[/latex]) minus imports ([latex]M[/latex]): [latex]C+I+G+X–M[/latex]. When the price level falls, the quantity of aggregate demand could increase and vice versa. This is represented by a movement along the [latex]AD[/latex] curve. We explain the relationship between the change in the price level and the AD quantity below.
There are three reasons why [latex]AD[/latex] curves are downward sloping. These are the wealth effect, the interest rate effect, and the foreign price effect. Each of them tends to affect a different component of aggregate demand.

The wealth effect holds that as the price level increases, the buying power of savings stored up in bank accounts and other assets will diminish, eaten away to some extent by inflation. Because a rise in the price level reduces people’s wealth, consumption spending will fall as the price level rises. Therefore, a rise in the price level decreases the quantity of aggregate demand and vice versa because consumption is a component of AD.
The interest rate effect is that as prices for outputs rise, the same purchases will take more money or credit to accomplish. This additional demand for money and credit will push interest rates higher. In turn, higher interest rates will reduce borrowing by businesses for investment purposes and reduce borrowing by households for homes and cars—thus reducing consumption and investment spending. So, a rise in the price level decreases the quantity of aggregate demand through increases in borrowing costs and lowering private investments.
The foreign price effect points out that if prices rise in Canada relative to other countries, then goods in Canada will be relatively more expensive than those in the rest of the world. Canadian exports will be relatively more expensive, and the quantity of exports sold will fall. Canadian imports from abroad will be relatively cheaper, so the quantity of imports will rise. Thus, a higher domestic price level, relative to other countries’ prices, will reduce net export expenditures and thus decrease the quantity of aggregate demand through net exports.
Changes or Shifts in the Aggregate Demand Curve
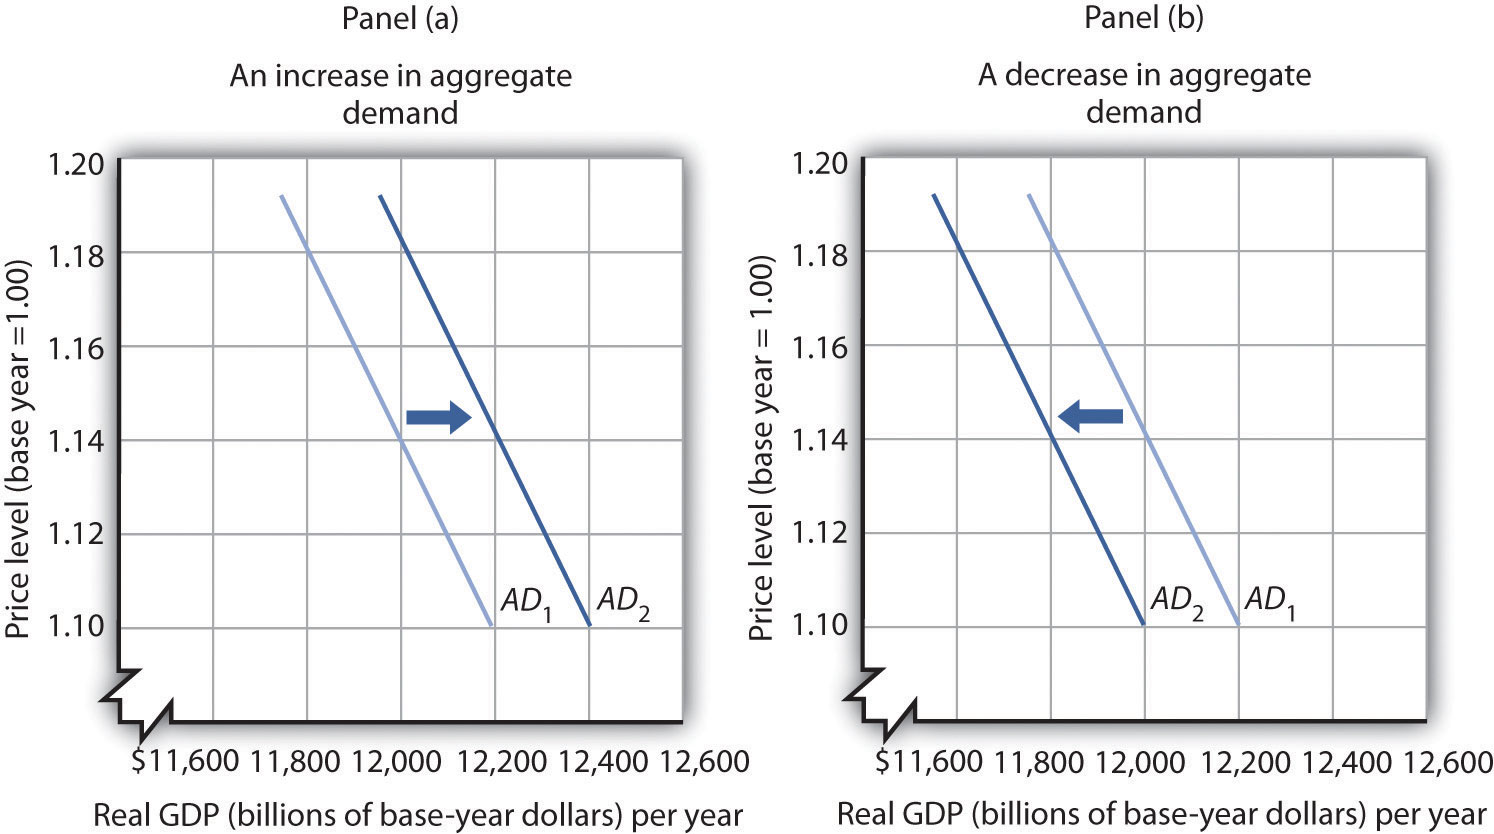
A change in the aggregate quantity of goods and services demanded at every price level changes aggregate demand, which shifts the aggregate demand curve. Increases and decreases in aggregate demand are shown in Fig 9.6 below. Changes occur when the price level is constant.
Changes in Consumption

Several events could change the quantity of consumption at each price level and thus shift aggregate demand. One determinant of consumption is consumer confidence. If consumers expect good economic conditions and are optimistic about their economic prospects, they are likelier to buy major items such as cars or furniture. The result would be an increase in the real value of consumption at each price level and an increase in aggregate demand.
Another factor that can change consumption and shift aggregate demand is tax policy. A cut in personal income taxes leaves people with more after-tax income, which may induce them to increase their consumption.
Transfer payments such as welfare and Social Security payments also affect the income people have available to spend. At any given price level, an increase in transfer payments raises consumption and aggregate demand, and a reduction lowers consumption and aggregate demand.
Changes in Investment

Investment is the production of new capital that will be used for future production of goods and services. Firms make investment choices based on what they think they will be producing in the future. The expectations of firms thus play a critical role in determining investment. If firms expect their sales to increase, they will likely increase their investment to increase production and meet consumer demand. Such an increase in investment raises the aggregate quantity of goods and services demanded at each price level; it increases aggregate demand.
Changes in interest rates also affect investment as the cost of borrowing changes and thus affects aggregate demand.
Important Note: We must carefully distinguish such changes from the interest rate effect, which causes a movement along the aggregate demand curve. A change in interest rates that results from a change in the price level affects investment in a way that is already captured in the downward slope of the aggregate demand curve; it causes a movement along the curve. A change in interest rates shifts the curve for some other reason.
Changes in Net Exports

An increase in foreign incomes or an increase in foreign GDP increases a country’s net exports and aggregate demand; a slump in foreign incomes reduces net exports and aggregate demand. For example, several major Canadian trading partners in Asia suffered recessions in 2009. Lower real incomes in those countries reduced Canadian exports and tended to reduce aggregate demand.
Exchange rates also influence net exports, all other things unchanged. A country’s exchange rate is the price of its currency in terms of another currency. A rise in the Canadian exchange rate means it takes more USD, for example, to purchase one Canadian dollar (CAD). Therefore, a rise in the Canadian exchange rate increases the price to foreigners for goods and services produced in Canada, thus reducing Canadian exports and increasing imports into Canada (a stronger CAD implies foreign goods get relatively cheaper). A higher exchange rate tends to reduce net exports, reducing aggregate demand. A lower exchange rate tends to increase net exports, increasing aggregate demand.
Attribution
“7.1 Aggregate Demand” from Principles of Macroeconomics by University of Minnesota is licensed under a Creative Commons Attribution-NonCommercial-ShareAlike 4.0 International License, except where otherwise noted.
“Building a Model of Aggregate Supply and Aggregate Demand” from Macroeconomics by Lumen Learning is licensed under a Creative Commons Attribution 4.0 International License.
“5.1. Aggregate demand & aggregate supply” from Principles of Macroeconomics by D. Curtis & I. Irvine is licensed under a Creative Commons Attribution-NonCommercial-ShareAlike 4.0 International License.
