3.4 Changes in Supply
Definition: Change in Supply
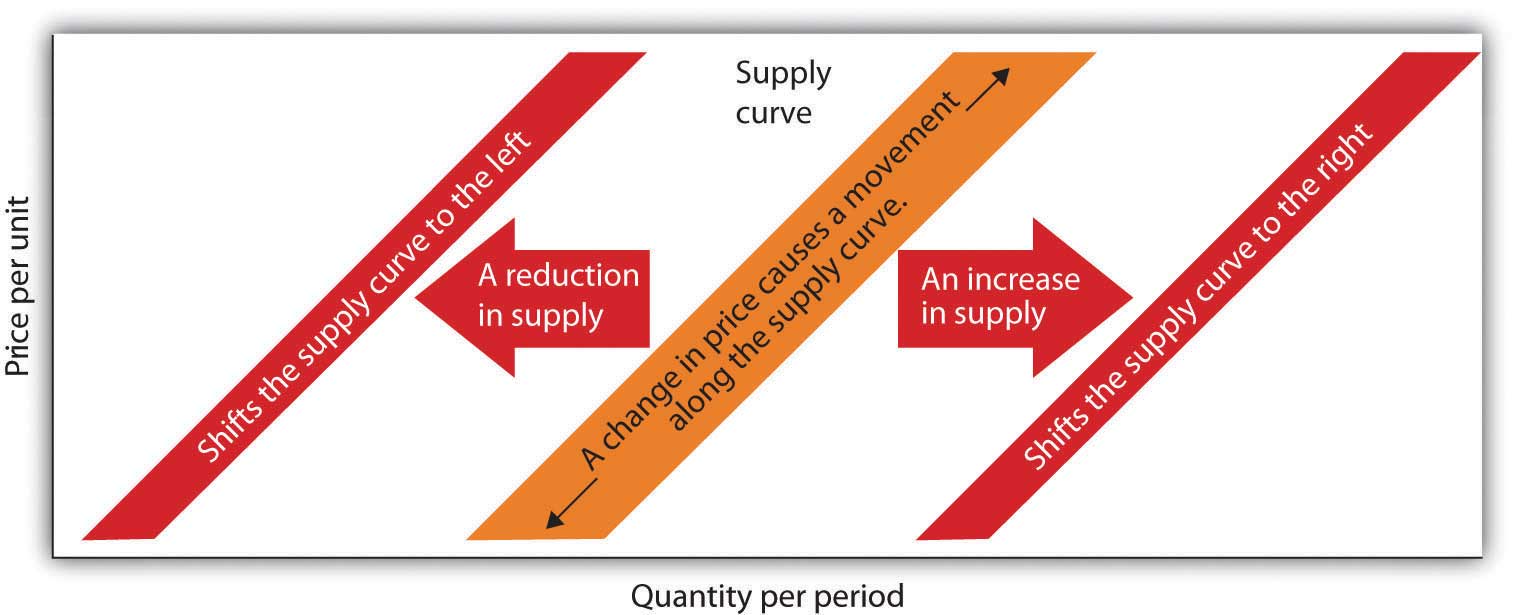
When we draw a supply curve, we assume that other variables that affect the willingness of sellers to supply a good or service are unchanged. It follows that a change in any of those variables will cause a change in supply, which is a shift in the supply curve. Suppose the cost of producing coffee decreases due to a drop in the price of coffee beans. This increases the quantity of coffee supplied at each price, shifting the supply curve to the right. This shift in the supply curve is called a change in supply.
Factors that change supply:
Prices of Factors of Production
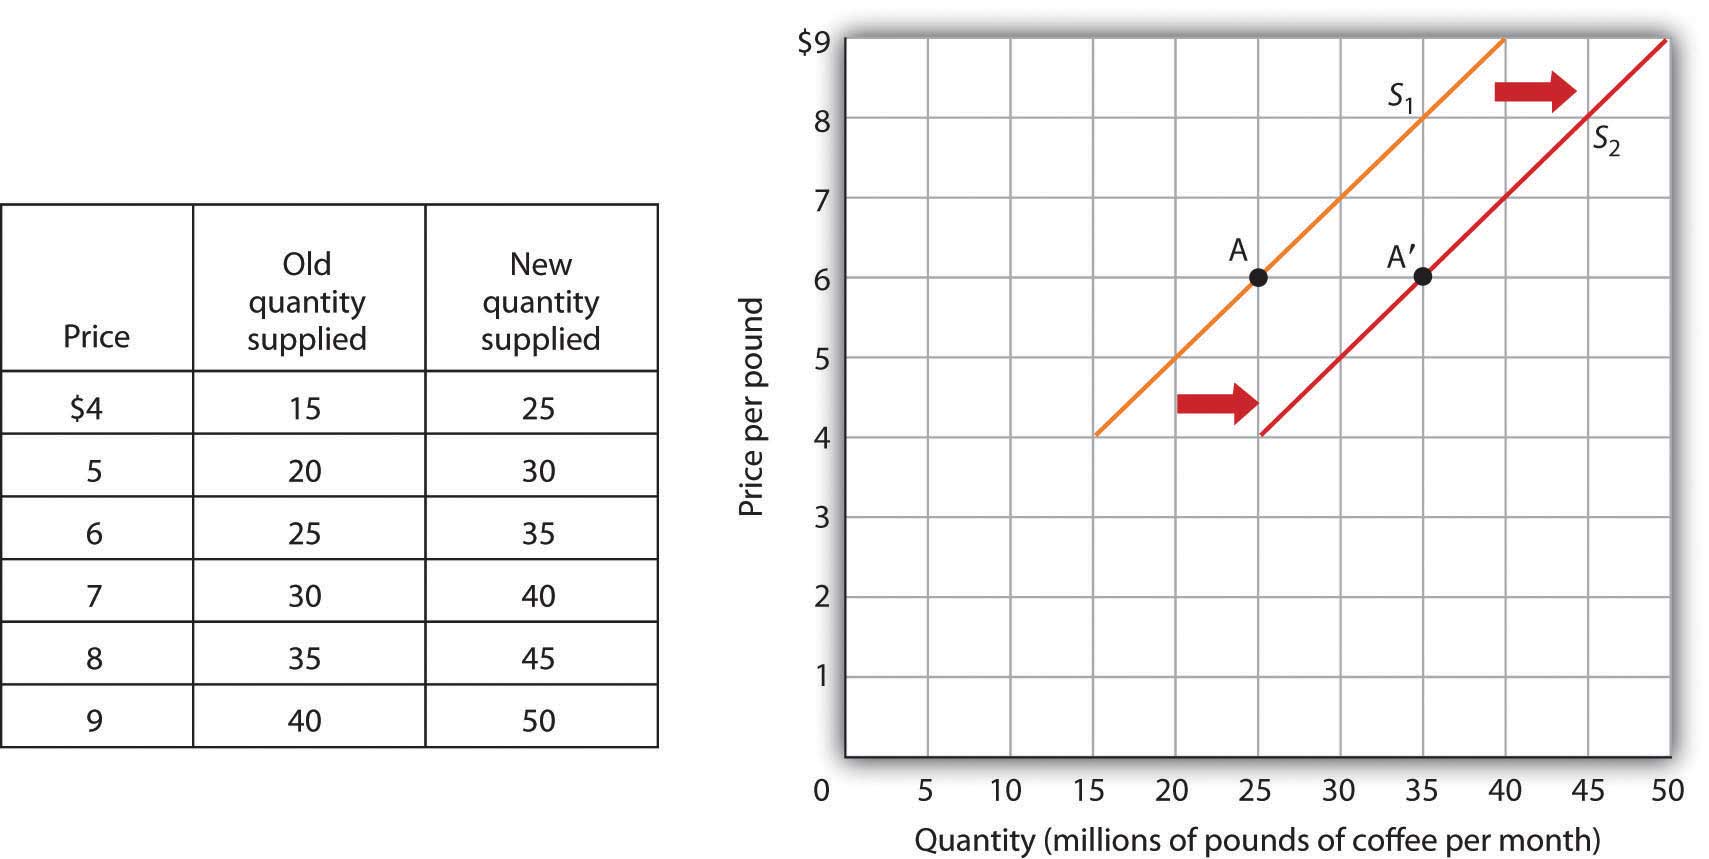
Suppose, for example, that the price of coffee beans falls. That will reduce the cost of producing coffee and thus increase the quantity of coffee producers will offer for sale at each price. The supply schedule in Fig 3.7 shows an increase in the quantity of coffee supplied at each price increase graphically as a shift in the supply curve from 1 to S2. The amount supplied at each price increases by 10 million pounds of coffee monthly. At point A on the original supply curve S1, for example, 25 million pounds of coffee per month are supplied for $6 per pound. After the increase in supply, 35 million pounds per month are supplied at the same price (point A′ on curve S2).
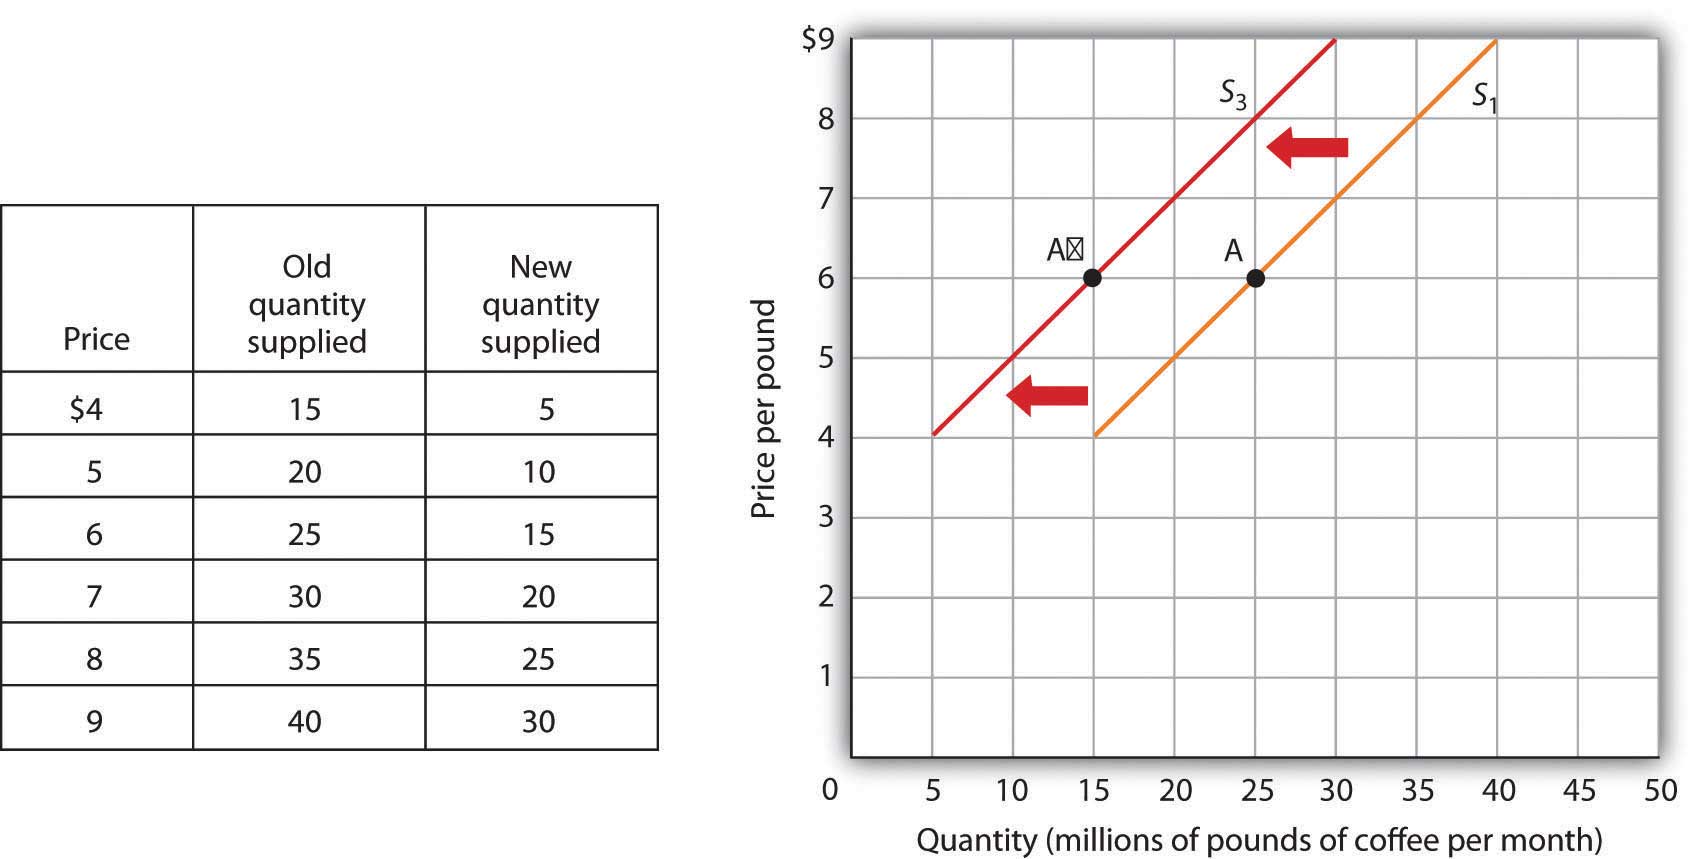
An event that reduces the quantity supplied at each price shifts the supply curve to the left. Adverse weather, such as excessive rain that reduces the yields from coffee plants, are examples of events that might reduce supply. Fig. 3.8 shows a reduction in the supply of coffee. We see in the supply schedule that the quantity of coffee supplied falls by 10 million pounds of coffee per month at each price. The supply curve thus shifts from S1 to S3.
Prices of related goods
Like demand, there could be substitutes in production as well. Suppose a producer makes cupcakes and cookies. If the relative price of cupcakes rises, the producer tends to devote more time and resources to producing cupcakes because that is more profitable, so the number of cupcakes supplied increases. At the same time, the opportunity cost of producing cupcakes increases. The opportunity cost of producing a cupcake is not producing cookies. So, the supply of cookies decreases, and the supply curve shifts leftward due to a rise in the price of a related (substitute) good.
Seller expectations about future prices
Like demand, expectations of the supply price affect production decisions. Production decisions are a lot like playing the stock market; if we are producing cupcakes and cookies to sell to the store tomorrow, we have to make them based on the current knowledge we have about those prices. Usually, you will be confident that these prices will stay relatively stable. Still, if you have reason to believe the prices of cupcakes will drastically rise from next week, you may devote less of your attention to producing them today and increase the quantity supplied next week when the price rises. Expectations are usually based on some form of evidence or signal and can cause supply shifts quite suddenly. If the firm expects future prices to rise, supply will decrease today. If the firm expects future prices to fall, supply will increase in the current period.
Number of producers
An increase in the number of sellers supplying a good or service shifts the supply curve to the right; a reduction in the number of sellers shifts the supply curve to the left. If, for example, four new coffee-producing stores enter the market, more will be supplied at each price. The market for cellular phone service has been affected by an increase in the number of firms offering the service. Over the past decade, new cellular phone companies emerged, shifting the supply curve for cellular phone service to the right.
Technology
A technology change alters the combinations of inputs or the types of inputs required in the production process. Technological improvement usually means that the same amount of input can now produce more due to increased productivity from the advanced technology. With more produced at every price, the supply curve will shift to the right, meaning an increase in supply.
Impressive technological changes have occurred in the computer industry in recent years. Computers are much smaller and are far more powerful than they were only a few years ago due to innovation. The result has been a massive increase in the supply of computers, shifting the supply curve to the right.
Natural events
Storms, insect infestations, and drought affect agricultural production and, thus, the supply of agricultural goods. If something destroys a substantial part of an agricultural crop, the supply curve will shift to the left. The terrible cyclone that killed more than 50,000 people in Myanmar in 2008 also destroyed some of the country’s prime rice-growing land. That shifted the supply curve for rice to the left. If there is an excellent harvest, the supply curve will shift to the right.
Attribution
“3.2 Supply” in Principles of Macroeconomics by the University of Minnesota is licensed under a Creative Commons Attribution-NonCommercial-ShareAlike 4.0 International License.
“3.3 Other Determinants of Demand” in Principles of Microeconomics by Dr. Emma Hutchinson, University of Victoria, is licensed under a Creative Commons Attribution 4.0 International License.
