3.6 Shifts in Demand and Supply
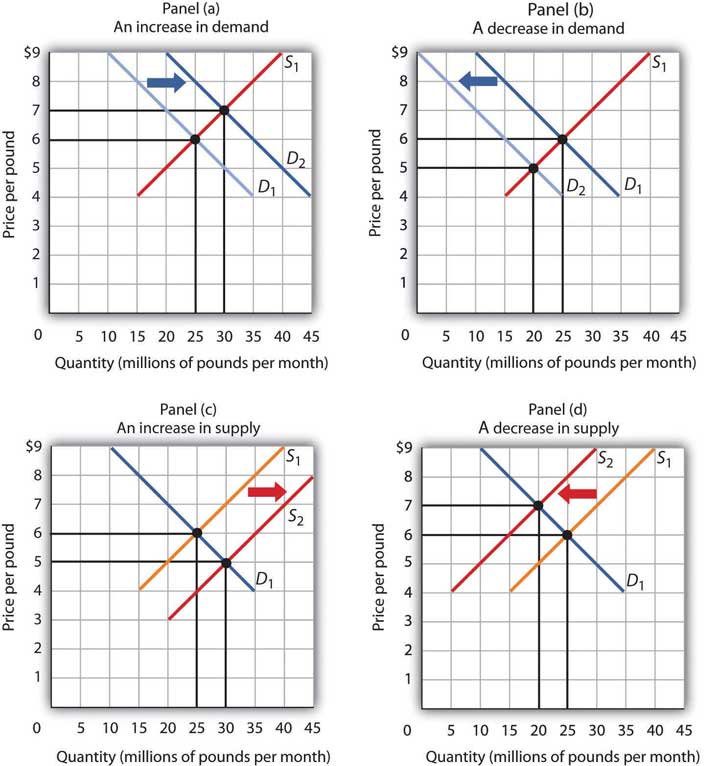
The above graphs show the market for coffee. Refer to Panel A; suppose the original equilibrium price and quantity of coffee are $6 and 25 pounds, respectively. Assuming coffee is a normal good, an increase in income, with no change in the price of coffee and other factors, will increase the demand for coffee and shift the demand curve to the right. The equilibrium price of coffee rises to $7, and the equilibrium quantity increases to 30 pounds. Panel B shows the decrease in the demand for coffee when income decreases, and the demand curve shifts to the left. The equilibrium price of coffee falls, and the equilibrium quantity decreases.
Refer to Panel C; suppose the initial equilibrium price and quantity of coffee are $6 and 25 pounds, respectively. If the cost of producing coffee decreases, ceteris paribus, the supply of coffee increases and shifts the supply curve to the right, resulting in a fall in the equilibrium price of coffee to $5 and an increase in the equilibrium quantity to 30 pounds. Panel D shows the decrease in the supply of coffee when the production cost increases and the supply curve shifts to the left. The equilibrium price of coffee rises, and the equilibrium quantity decreases.
Simultaneous Shifts in Demand and Supply
As we have seen, when either the demand or the supply curve shifts, the results are unambiguous; that is, we know what will happen to both equilibrium price and equilibrium quantity, so long as we know whether demand or supply increases or decreases. However, in practice, several events may occur around the same time that cause both the demand and supply curves to shift. To figure out what happens to equilibrium price and equilibrium quantity, we must know not only in which direction the demand and supply curves have shifted but also the relative amount by which each curve shifts. Of course, the demand and supply curves could shift in the same or opposite directions, depending on the specific events causing them to shift.
Example: Shifts in Demand and Supply
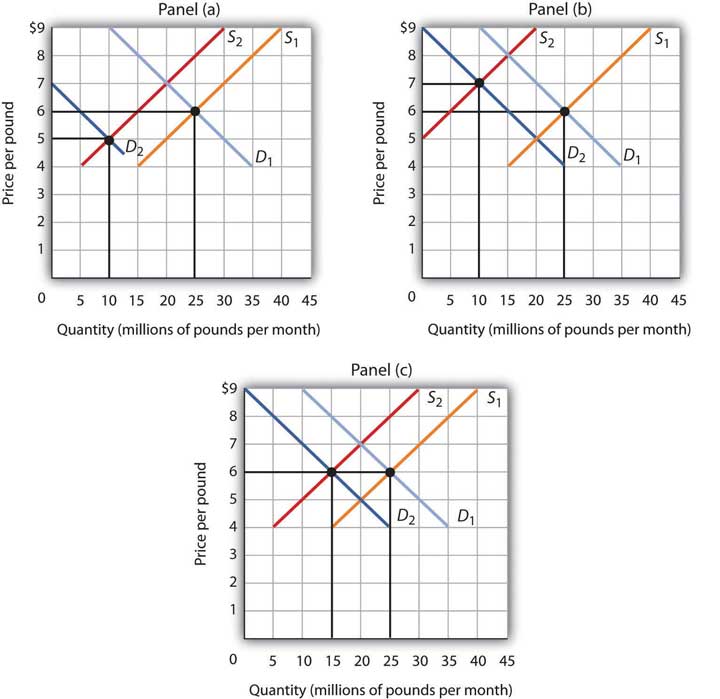
All three panels of Fig 3.15 show a decrease in demand for coffee (caused perhaps by a decrease in the price of a substitute good, such as tea) and a simultaneous decrease in the supply of coffee (caused perhaps by bad weather). Since reductions in demand and supply, considered separately, each causes the equilibrium quantity to fall, the impact of both curves shifting simultaneously to the left means that the new equilibrium quantity of coffee is less than the old equilibrium quantity. The effect on the equilibrium price, though, is ambiguous. Whether the equilibrium price is higher, lower, or unchanged depends on how much each curve shifts.
If the demand curve shifts farther to the left than does the supply curve, as shown in Panel A of Fig 3.15, then the equilibrium price will be lower than it was before the curves shifted. In this case, the new equilibrium price falls from $6 per pound to $5 per pound. If the shift to the left of the supply curve is greater than that of the demand curve, the equilibrium price will be higher than before, as shown in Panel B. In this case, the new equilibrium price rises to $7 per pound. In Panel C, since both curves shift to the left by the same amount, the equilibrium price does not change; it remains $6 per pound.
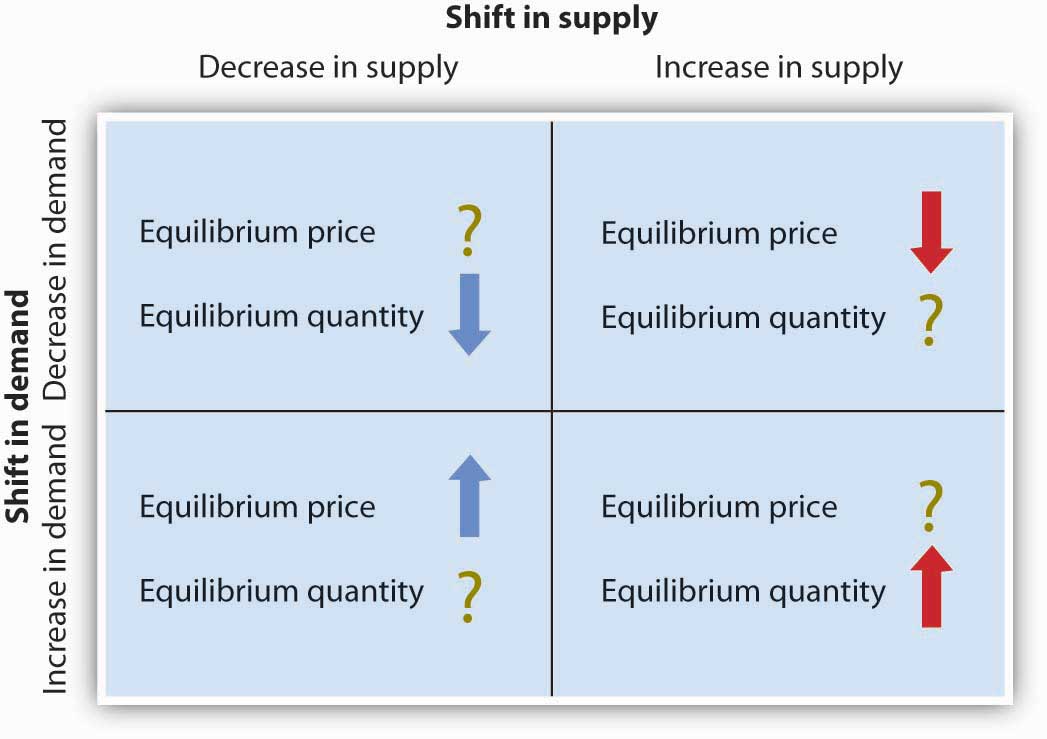
Regardless of the scenario, changes in equilibrium price and equilibrium quantity resulting from two different events need to be considered separately. If both events cause the equilibrium price or quantity to move in the same direction, then clearly, the price or quantity can be expected to move in that direction. If one event causes price or quantity to rise while the other causes it to fall, the extent by which each curve shifts is critical to figuring out what happens. Fig 3.15 summarizes what may happen to equilibrium price and quantity when demand and supply both shift.
Attribution
“3.3 Demand, Supply, and Equilibrium” in Principles of Macroeconomics by the University of Minnesota is licensed under a Creative Commons Attribution-NonCommercial-ShareAlike 4.0 International License.
