4.1 GDP Measured by Components of Demand
GDP is the market value of all final goods and services produced within an economy in a given period. We will explain the definition in the following few paragraphs. This method of estimating the GDP is called the Expenditure Approach.
First, have you considered who buys (demands) all of this production? We can divide this demand into four main parts: consumer spending (consumption), business spending (private investment), government spending on goods and services (government), and spending on net exports (net exports).
[latex]\small{\text{GDP}=\text{consumption}(C)+\text{private investment}(I)+\text{government purchases}(G)+\text{net exports}(X)}[/latex]
Or
[latex]\text{GDP}= C+I+G+NX\text{, where }NX=\text{Exports}(X)–\text{Imports}(M)[/latex]
We will examine each of these components and see how each fits into the pattern of macroeconomic activity. Before we begin, it will be helpful to distinguish between two types of variables: stocks and flows. A flow variable is a variable that is measured over a specific period. A stock variable is a variable that is independent of time. Income is an example of a flow variable. For example, saying one’s income is $1,000 is meaningless without a time dimension. Is it $1,000 per hour? Per day? Per week? Per month? Until we know the period, we have no idea what the income figure means. The balance in a checking account is an example of a stock variable. When we learn that the balance in a chequing account is $1,000, we know precisely what that means; we do not need a time dimension. We will see that stock and flow variables play very different roles in macroeconomic analysis.
We also need to distinguish between Intermediate and Final Goods before discussing GDP. GDP is the total value of all final goods and services produced. That is not the same as the total value of all goods and services produced during a period. Suppose, for example, a logger cuts some trees and sells the logs to a sawmill. The mill makes lumber and sells it to a construction firm, which builds a house. The value of the final good, house, will be added to the economy’s total output or GDP. We will not add the value of the logs or lumber used in making the house to the GDP. The house’s value already includes the value of the lumber and the log used in making the house, so adding these intermediate goods to the GDP will result in double counting. Therefore, we do not add the value of intermediate goods while measuring the value of total production or GDP.
Personal Consumption
Personal consumption is a flow variable that measures the value of goods and services households purchase during a period. Household purchases of groceries, health-care services, clothing, and automobiles—all are counted as consumption.
The production of consumer goods and services accounts for about 70% of total output. Because consumption is such a large part of GDP, economists seeking to understand the determinants of GDP must pay special attention to the determinants of consumption.
Figure 4.1 “Personal Consumption in the Circular Flow” presents a circular flow model for an economy that produces only personal consumption goods and services. (We will add the other components of GDP to the circular flow as we discuss them.) Spending on goods flows from households to firms; it is the arrow labelled “Personal consumption.” Firms produce these goods and services using factors of production: labour, capital, and natural resources. Households ultimately own these factors. The production of goods and services thus generates income for households; we see this income as the flow from firms to households labelled “Factor incomes” in the exhibit.
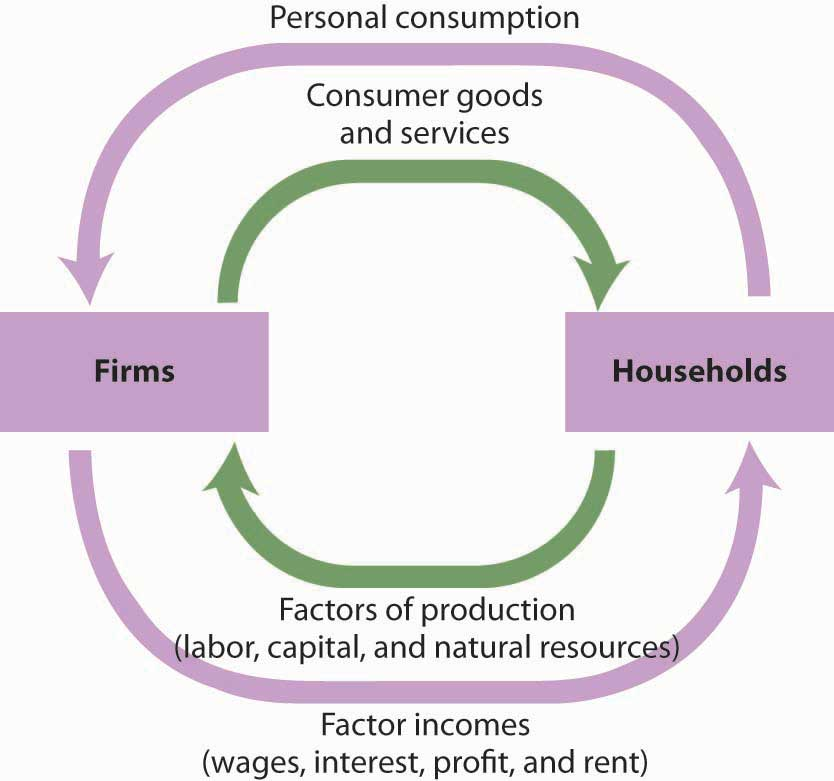
In exchange for payments that flow from households to firms, consumer goods and services flow from firms to households. This flow is shown in Fig 4.1 as an arrow going from firms to households. When you buy a soda, for example, your payment to the store is part of the flow of personal consumption; the soda is part of the flow of consumer goods and services that go from the store to the household.
In thinking about the flow of consumption spending from households to firms, we emphasized demand and supply in particular markets — markets such as blue jeans, haircuts, and apartments (Chapter 3). In thinking about the flow of income payments from firms to households, we focused on the demand and supply for particular factors of production, such as textile workers, barbers, and apartment buildings. Because our focus now is macroeconomics, the study of aggregates of economic activity, we will think in terms of the total of personal consumption and the sum of payments to households.
Private Investment
Gross private domestic investment is the value of all goods produced during a period for use in producing other goods and services. Like personal consumption, gross private domestic investment is a flow variable. It is often referred to as “private investment.” A hammer produced for a carpenter is a private investment. A printing press produced for a magazine publisher is a private investment, as is a conveyor-belt system built for a manufacturing firm. Capital includes all the goods produced for other goods; it is a stock variable. Private investment is a flow variable that adds to the stock of capital during a period.
Important Note
The term “investment” can generate confusion. In everyday conversation, we use the term “investment” to use money to earn income. We say we have invested in a stock or invested in a bond. Economists, however, restrict “investment” to activities that increase the economy’s stock of capital. The purchase of a share of stock does not add to the capital stock; it is not an investment in the economic meaning of the word. By investment, we mean purchasing physical capital to produce goods or services that add to production. Confusing the economic concept of private investment with the concept of financial investment can cause a misunderstanding of how critical components of the economy relate to one another.
Gross private domestic investment includes three flows that add to or maintain the nation’s capital stock: expenditures by business firms on new buildings, plants, tools, equipment, and software that will be used in the production of goods and services; expenditures on new residential housing; and changes in business inventories. If a clothing store stocks 1,000 pairs of jeans, the jeans represent an addition to inventory and are part of gross private domestic investment.
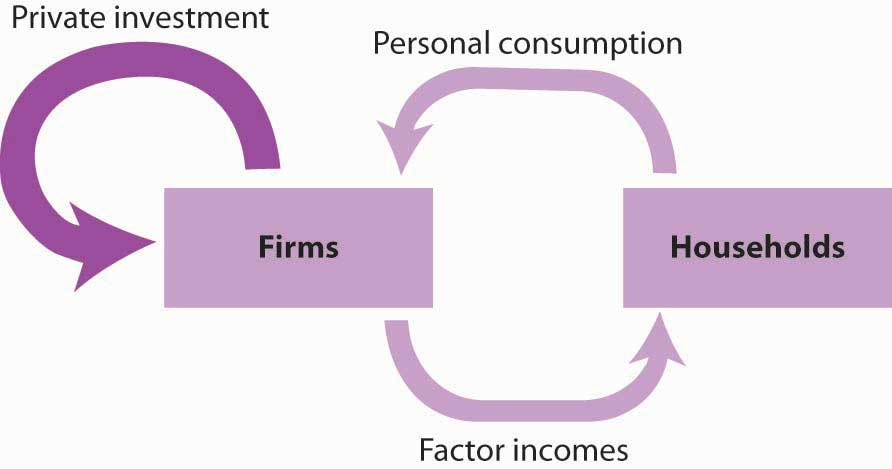
In the circular flow model in Figure 4.2, “Private Investment in the Circular Flow,” we see a flow of investment going from firm to firm. The production of goods and services for consumption generates factor incomes for households; the production of capital goods for investment generates income for households.
Government Purchases
Government agencies at all levels purchase goods and services from firms. They buy office equipment, vehicles, buildings, janitorial services, etc. Many government agencies also produce goods and services. Police departments produce police protection. Public schools produce education. The Banks produce financial services.
Government purchases are the sum of purchases of goods and services from firms by government agencies plus the total value of output produced by government agencies themselves during a period.
Important Note
Government purchases are not the same thing as government spending. Much government spending takes the form of transfer payments, which are payments that do not require the recipient to produce a good or service to receive them. Transfer payments include Social Security and other types of assistance to retired people, welfare payments to poor people, and unemployment compensation to people who have lost their jobs. Transfer payments are undoubtedly significant—they account for roughly half of all federal government spending in Canada. They do not count in a nation’s GDP because they do not reflect the production of a good or service.
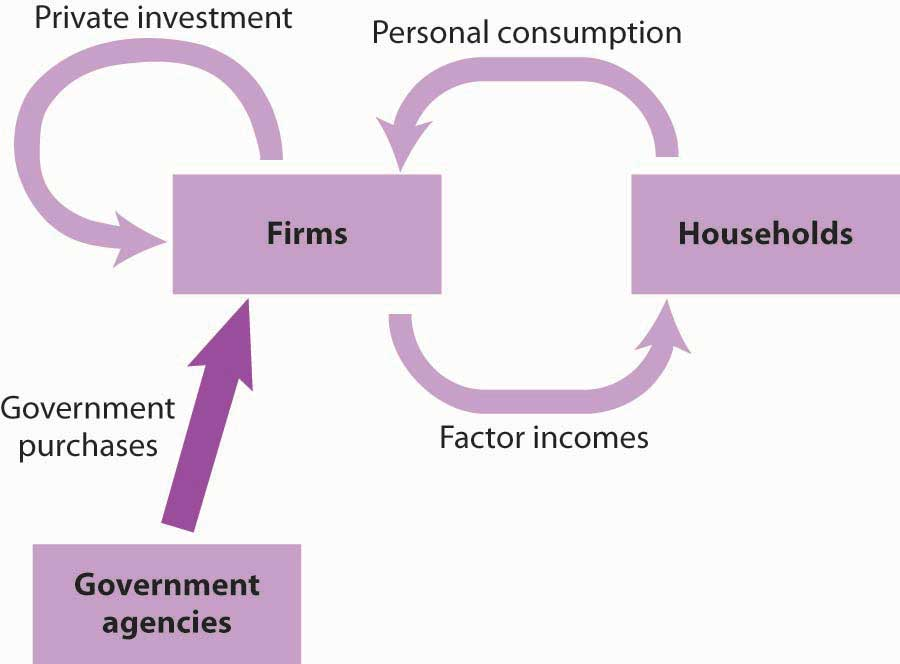
Government purchases represent a demand placed on firms, characterized by the flow shown in Figure 4.3, “Government Purchases in the Circular Flow.”
Net Exports
Sales of a country’s goods and services to buyers in the rest of the world during a particular period represent its exports. A purchase by a buyer of a Ford Taurus produced in Canada by someone in Japan is Canada’s export. Exports also include such transactions as purchasing accounting services from a Toronto accounting firm by a shipping line based in Hong Kong. Imports are purchases of foreign-produced goods and services by a country’s residents during a period. Canadian imports include such transactions as the purchase by Canadians of cars produced in Japan, tomatoes grown in Mexico, or a stay in a French hotel by a tourist from Canada. Subtracting imports from exports yields net exports.
Net exports can be negative if imports exceed exports. Negative net exports constitute a trade deficit. The amount of the deficit is the amount by which imports exceed exports. When exports exceed imports, there is a trade surplus.
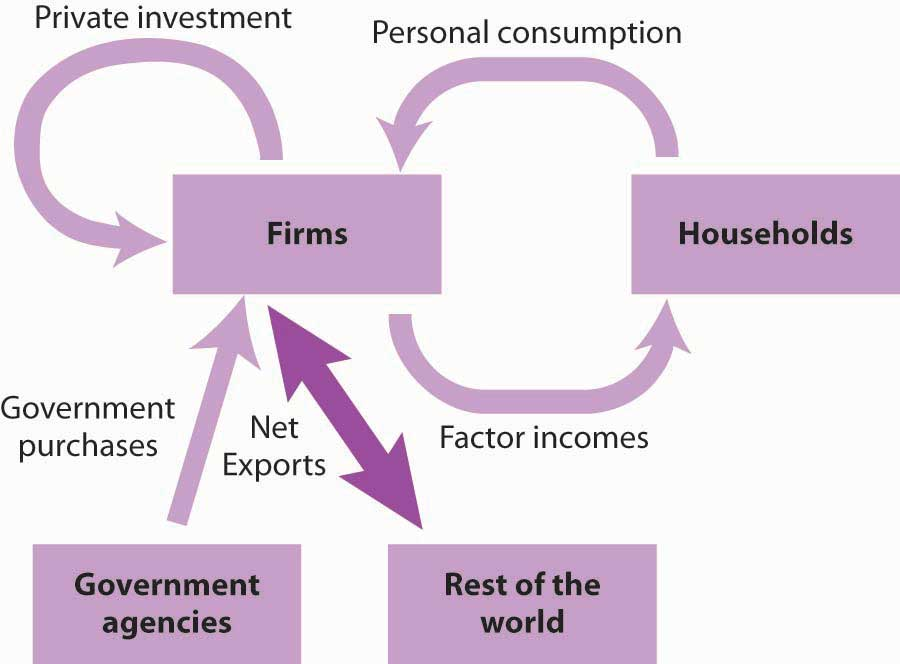
In the circular flow diagram in Figure 4.4, “Net Exports in the Circular Flow,” net exports are shown with an arrow connecting firms to the rest of the world. The balance between the flows of exports and imports is net exports. When there is a trade surplus, net exports are positive and add spending to the circular flow. A trade deficit implies negative net exports; spending flows from firms to the rest of the world.
| Component | Spending in Trillions of CAD | Pct. of Total |
|---|---|---|
| Consumption | $16.7 | 70.5 |
| Investment | $3.8 | 16.0 |
| Government | $3.8 | 16.0 |
| Net Exports | -$0.6 | -2.5 |
| Exports | $2.5 | 10.5 |
| Imports | -$3.1 | 13.0 |
| Total GDP | $23.7 | 100.0 |
| Rank | Country | GDP (trillion US$) |
|---|---|---|
| 1 | United States | 28.8 |
| 2 | China | 18.9 |
| 3 | Japan | 6.9 |
| 4 | Germany | 5..2 |
| 5 | India | 3.9 |
| 6 | United Kingdom | 3.6 |
| 7 | France | 3.6 |
| 8 | Italy | 2.7 |
| 9 | Brazil | 2.4 |
| 10 | Canada | 2.3 |
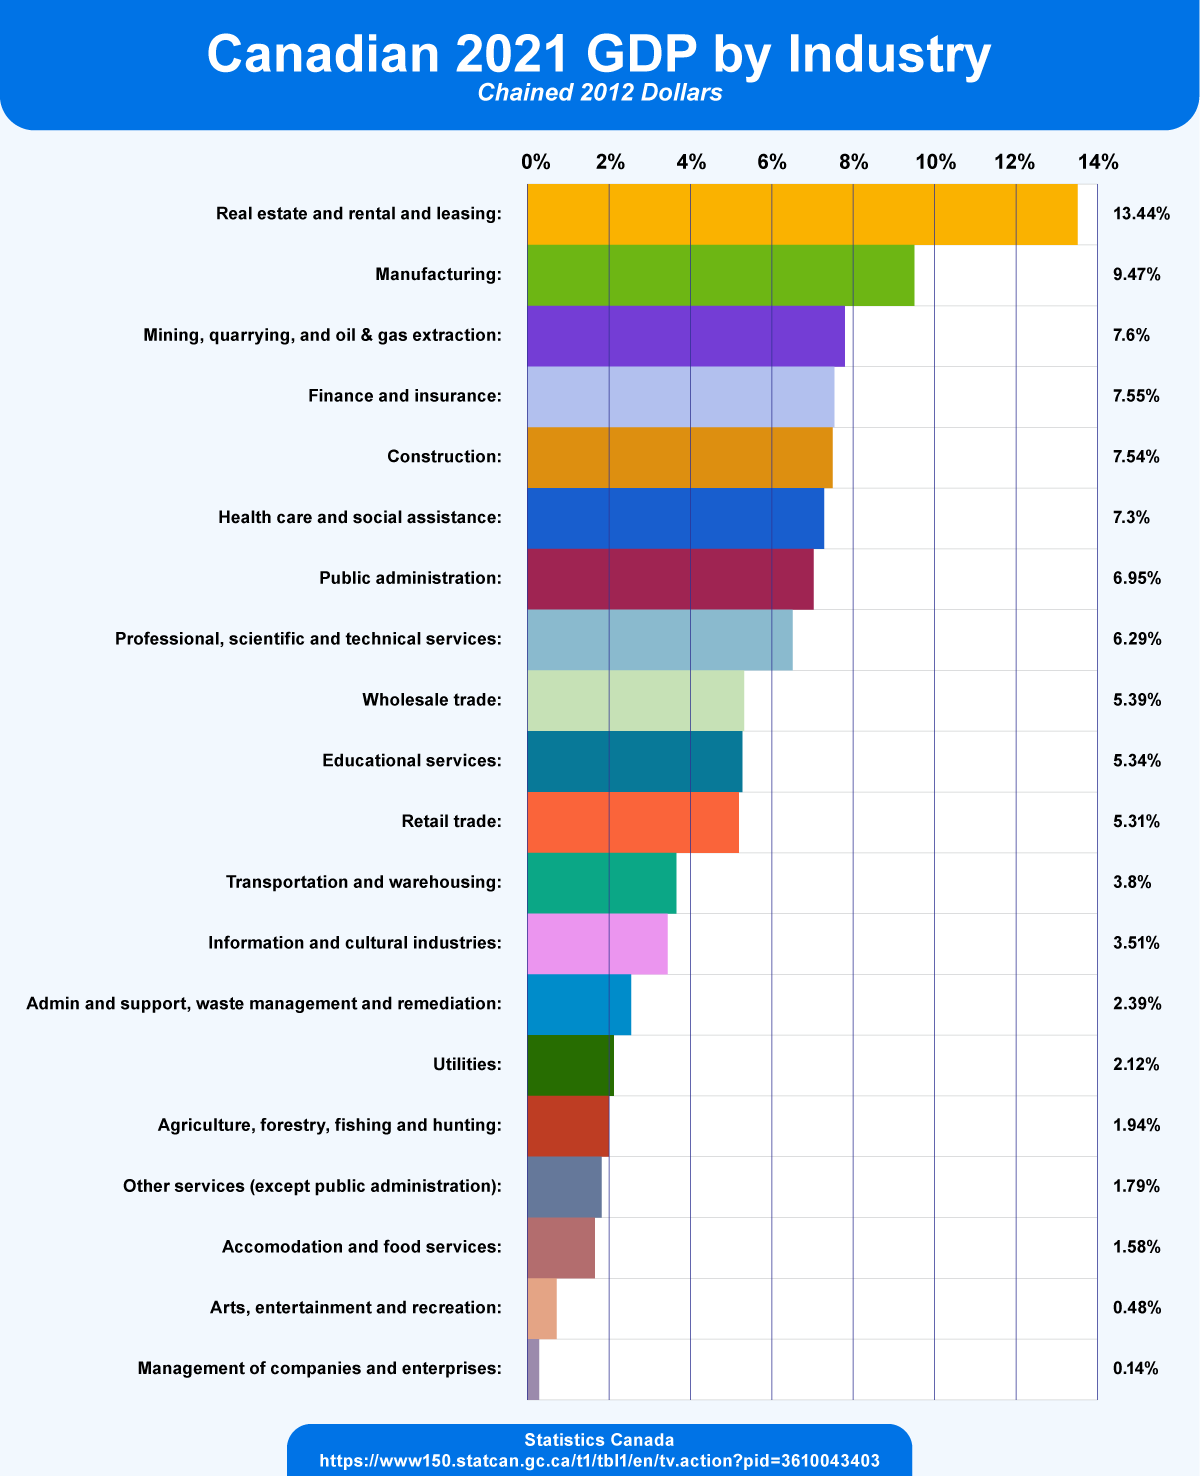
The following chart shows the percentage contribution of the various goods and services sectors to Canada’s total GDP.
| Industry | % of GDP |
|---|---|
| Real estate and rental and leasing | 13.44 |
| Manufacturing | 9.47 |
| Mining, quarrying, and oil and gas extraction | 7.60 |
| Finance and insurance | 7.56 |
| Construction | 7.54 |
| Health care and social assistance | 7.31 |
| Professional, scientific and technical services | 6.30 |
| Wholesale trade | 5.39 |
| Educational services | 5.34 |
| Retail trade | 5.32 |
| Transportation and warehousing | 3.81 |
| Information and cultural industries | 3.52 |
| Administrative and support, waste management and remediation services | 2.40 |
| Utilities | 2.13 |
| Agriculture, forestry, fishing and hunting | 1.95 |
| Other services (except public administration) | 1.79 |
| Accommodation and food services | 1.59 |
| Arts, entertainment and recreation | 0.49 |
| Management of companies and enterprises | 0.14 |
Attribution
“6.1 Measuring the Size of the Economy: Gross Domestic Product” from Principles of Macroeconomics 3e by OpenStax-Rice University is licensed under a Creative Commons Attribution 4.0 license except where otherwise noted.“6.1 Measuring Total Output” from Principles of Macroeconomics by the University of Minnesota is licensed under a Creative Commons Attribution-NonCommercial-ShareAlike 4.0 International License, except where otherwise noted.
