3.3 Supply
Price and Quantity Supplied
In Perspective
What determines the quantity of a good or service sellers are willing to offer for sale?
Price is one factor; ceteris paribus, a higher price is likely to induce sellers to offer a greater quantity of a good or service. Production cost is another determinant of supply. Variables that affect production cost include the prices of factors used to produce the good or service, returns from alternative activities, technology, the expectations of sellers, and natural events such as weather changes. We will discuss first how price affects the quantity supplied of a good or service and then how other variables affect supply.
Definition: Quantity supplied
The quantity supplied of a good or service is the quantity sellers are willing to sell at a particular price during a particular period, all other things unchanged. Ceteris paribus, receiving a higher price increases profits and induces sellers to increase the quantity they supply. In general, an increase in price results in an increase in quantity supplied, and this relationship is often referred to as the Law of supply, with other factors remaining unchanged.
The relationship between price and quantity supplied is suggested in a supply schedule. This table shows quantities supplied at different prices during a particular period, all other things unchanged. Fig 3.5 gives a supply schedule for the quantities of monthly coffee supplied at various prices, ceteris paribus. For $4 per pound, for example, producers are willing to supply 15 million pounds of coffee per month. A higher price, say $6 per pound, induces sellers to provide a greater quantity — 25 million pounds of coffee per month.
| Price | Old Quantity Supplied | New Quantity Supplied |
|---|---|---|
| $4 | 15 | 25 |
| 5 | 20 | 30 |
| 6 | 25 | 35 |
| 7 | 30 | 40 |
| 8 | 35 | 45 |
| 9 | 40 | 50 |
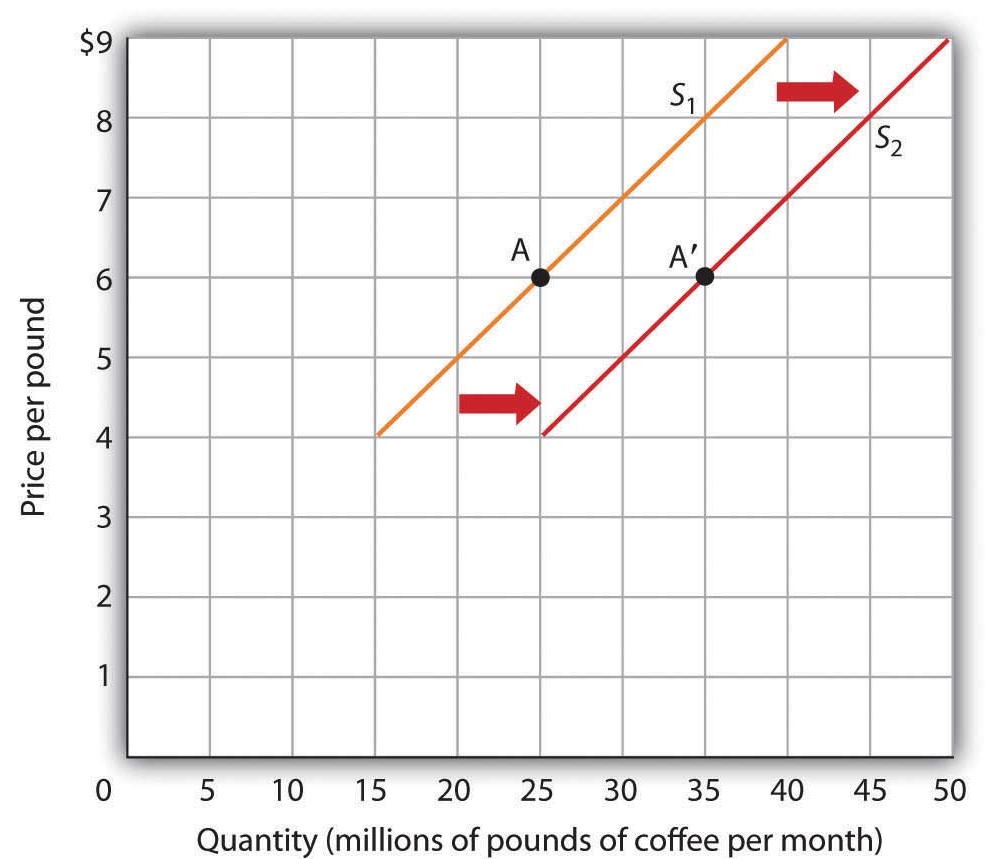
The information given in a supply schedule in Fig 3.5 can be presented with a supply curve, a graphical representation of a supply schedule, as shown in Fig 3.6. A supply curve thus indicates the relationship between the price and quantity supplied of a good or service during a particular period, all other things unchanged. Because the relationship between price and quantity supplied is generally positive, supply curves are generally upward-sloping.
A change in price causes a movement along the supply curve; such a movement is called a change in quantity supplied. As with a change in quantity demanded, a change in quantity supplied does not shift the supply curve. By definition, it is a movement along the supply curve. For example, if the price rises from $6 per pound to $7 per pound, the quantity supplied rises from 25 million pounds per month to 30 million pounds per month. That’s a movement from point A to point B along the supply curve in Fig 3.6.
Attribution
“3.2 Supply” in Principles of Macroeconomics by the University of Minnesota is licensed under a Creative Commons Attribution-NonCommercial-ShareAlike 4.0 International License.
