5.8 Price Indexes: Consumer Price Index and Inflation Rate
How do we measure inflation and deflation (that is, changes in the price level)? Price-level change is measured as the percentage rate of change in the level of prices. But how do we find a price level?
Economists measure the price level with a price index. A price index is a number whose movement reflects movement in the average level of prices. If a price index rises 10%, it means the average level of prices has risen 10%.
There are four steps one must take in computing a price index:
- Select the kinds and quantities of goods and services to be included in the index. A list of these goods and services, and the quantities of each, is the “market basket” for the index.
- Determine what it would cost to buy the goods and services in the market basket in some period that is the base period for the index. A base period is a time period against which costs of the market basket in other periods will be compared in computing a price index. Most often, the base period for an index is a single year. If, for example, a price index had a base period of 1990, the costs of the basket in other periods would be compared to the cost of the basket in 1990. However, we will encounter one index with a three-year base period.
- Compute the cost of the market basket in the current period.
- Compute the price index. It equals the current cost divided by the base-period cost of the market basket.
The Price of a Basket of Goods
Consider the simple basket of goods with only three items, represented in Fig 5.12. Say that a college student spends money on 20 hamburgers, one bottle of aspirin, and five movies in any given month. The table provides prices for these items over four years. Prices of some goods in the basket may rise while others fall. In this example, the price of aspirin does not change over the four years, while movies increase in price and hamburgers bounce up and down. The table shows the cost of buying the given basket of goods at prevailing prices.
| Hamburgers | Aspirin | Movies | |
| Quantity | 20 | 1 | 5 |
| 2017 | $3.10 | $10.00 | $6.00 |
| 2018 | $3.20 | $10.00 | $6.50 |
| 2019 | $3.10 | $10.00 | $7.00 |
| 2020 | $3.50 | $10.00 | $7.50 |
We can calculate the price of this basket of goods for each year. We will refer to the basket price as [latex]\text{BP}[/latex].
[latex]\text{BP}_{17}=(\$3.10)(20)+(\$10.00)(1)+(\$6.00)(5)=\$62.00+\$10.00+\$30.00=\$102.00\\[2ex]\text{BP}_{18}=(\$3.20)(20)+(\$10.00)(1)+(\$6.50)(5)=\$64.00+\$10.00+\$32.50=\$106.50\\[2ex]\text{BP}_{19}=(\$3.10)(20)+(\$10.00)(1)+(\$7.00)(5)=\$62.00+\$10.00+\$35.00=\$107.00\\[2ex]\text{BP}_{20}=(\$3.50)(20)+(\$10.00)(1)+(\$7.50)(5)=\$70.00+\$10.00+\$37.50=\$117.50[/latex]
Consumer Price Index
To simplify the task of interpreting the price levels for more realistic and complex baskets of goods, economists typically report the price level in each period as an index number rather than as the dollar amount for buying the basket of goods. Economists create price indices to calculate an overall average change in relative prices over time. We refer to this as the consumer price index ([latex]\text{CPI}[/latex]). Although price indices can be of different types, the most commonly used of price index that Stats Canada uses to report in the inflation rate is computed using the CPI, because CPI forms the broadest and the most comprehensive measure of consumers’ costs of living.
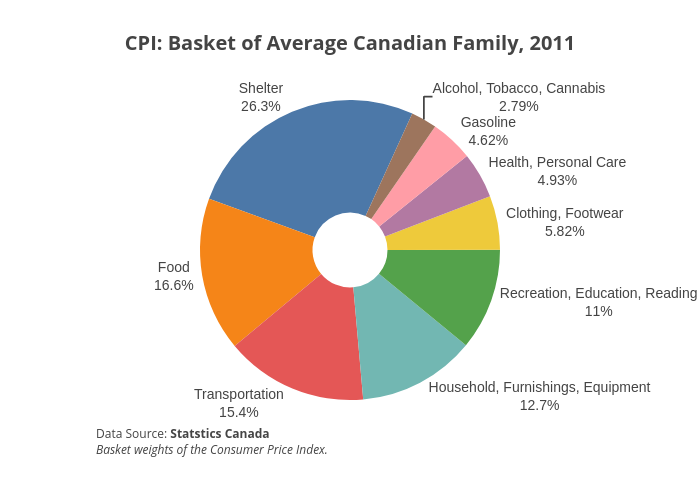
The figure below shows the [latex]\text{CPI}[/latex] basket of an average Canadian family in 2011.
To convert the money spent on the basket to an index number, economists arbitrarily choose one year as the base year or starting point from which we measure price changes. The base year, by definition, has an index number equal to 100. This sounds complicated, but it is really a simple math trick. We calculate the [latex]\text{CPI}[/latex] using the following equation:
[latex]\begin{align*}\text{CPI}_\textrm{current year}=100\times\frac{\text{BP}_\textrm{current year}}{\text{BP}_\textrm{base year}}\end{align*}[/latex]
In the example above, we choose 2017 as the base year.
[latex]\begin{align*}\text{CPI}_{2017}&=100\times\frac{102.00}{102.00}=100\times 1 = 100.00\\[2ex]\text{CPI}_{2018}&=100\times\frac{106.50}{102.00}=100\times 1.044=104.4\\[2ex]\text{CPI}_{2019}&=100\times\frac{107.00}{102.00}=100\times 1.049=104.9\\[2ex]\text{CPI}_{2020}&=100\times\frac{117.50}{102.00}=100\times 1.152=115.2\end{align*}[/latex]
CPI in 2020 turns out to be 115, thus implying the price of a basket of goods is about 15% higher in 2020 than the same basket measured in 2017, that is, at the base year prices. Similarly, the basket’s price is about 5% higher in 2019 compared to the same basket measured in 2017.
Inflation Rates (IR)
We can also calculate the inflation rates using the [latex]\text{CPI}[/latex] values. [latex]\text{IR}[/latex] is just a percentage change in the [latex]\text{CPI}[/latex]s.
[latex]\begin{align*}\text{IR}_\textrm{from last year to current year}=\frac{\text{CPI}_\textrm{current year}-\text{CPI}_\textrm{last year}}{\text{CPI}_\textrm{last year}}\times 100\end{align*}[/latex]
Therefore, looking at the above data:
[latex]\begin{align*}\text{IR}_{2017-2018}&=100\times\frac{104.4-100.00}{100}=100\times 0.044=4.4\%\\[2ex]\text{IR}_{2018-2019}&=100\times\frac{104.9-104.4}{104.4}=100\times 0.005=0.5\%\\[2ex]\text{IR}_{2019-2020}&=100\times\frac{115.2-104.9}{104.9}=100\times 0.098=9.8\%\end{align*}[/latex]
The advantage is that indexing allows easier eyeballing of the inflation numbers. If you glance at two index numbers like 107 and 110, you know automatically that the rate of inflation between the two years is about, but not quite exactly equal to, 3%. By contrast, imagine that we express the price levels in absolute dollars of a large basket of goods so that when you look at the data, the numbers were $19,493.62 and $20,040.17. Most people find it difficult to eyeball those kinds of numbers and say that it is a change of about 3%. However, the two numbers expressed in absolute dollars are exactly in the same proportion of 107 to 110 as in the previous example.
Index numbers have no dollar signs or other units attached to them. Although we can use index numbers to calculate a percentage inflation rate, the index numbers themselves do not have percentage signs. Index numbers mirror the proportions that we find in other data. They transform the other data so that it is easier to work with.
Attribution
“9.1 Tracking Inflation” from Principles of Macroeconomics 3e by OpenStax-Rice University is licensed under a Creative Commons Attribution 4.0 license except where otherwise noted.
“5.2 Price-Level Changes” from Principles of Macroeconomics by University of Minnesota is licensed under a Creative Commons Attribution-NonCommercial-ShareAlike 4.0 International License
