3.2 Changes in Demand
Price alone does not determine the quantity of a good or service people consume.
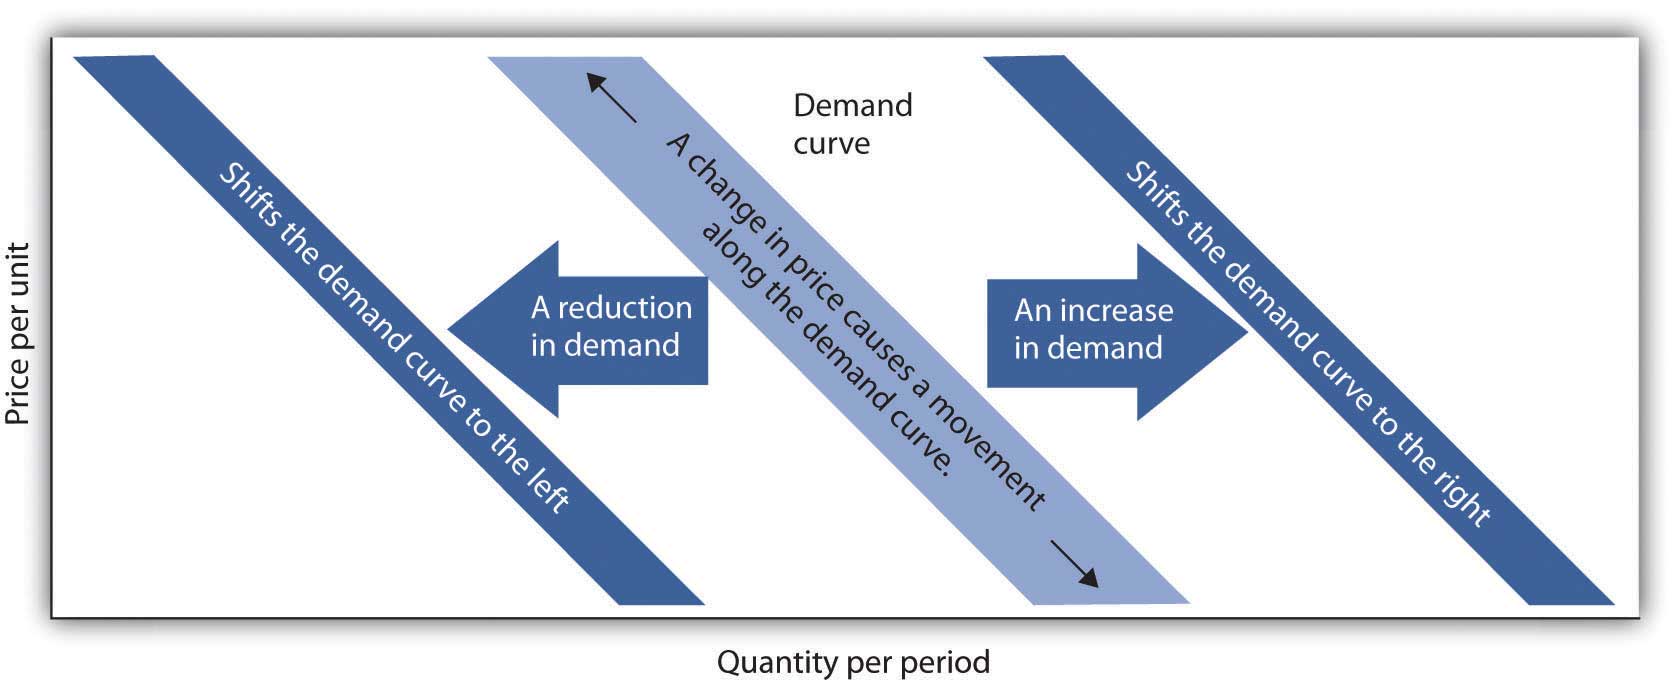
Coffee consumption, for example, will be affected by such variables as income and population. Preferences also play a role. We also expect other prices to affect coffee consumption. People often eat doughnuts or bagels with their coffee, so a reduction in the price might induce people to drink more coffee. An alternative to coffee is tea, so a decrease in tea price might result in more tea and less coffee. Thus, changing any of the variables held constant in constructing a demand schedule will change the quantities demanded at each price. The result will be a shift in the entire demand curve rather than a movement along the demand curve. A shift in a demand curve is called a change in demand.
Factors that change demand:
Prices of Related Goods and Services
In general, if a reduction in the price of one good increases the demand for another, the two goods are called complements. If a reduction in the price of one good reduces the demand for another, the two goods are called substitutes. These definitions hold in reverse as well: two goods are complements if an increase in the price of one reduces the demand for the other, and they are substitutes if an increase in the price of one increases the demand for the other. Doughnuts and coffee are complements; tea and coffee are substitutes.
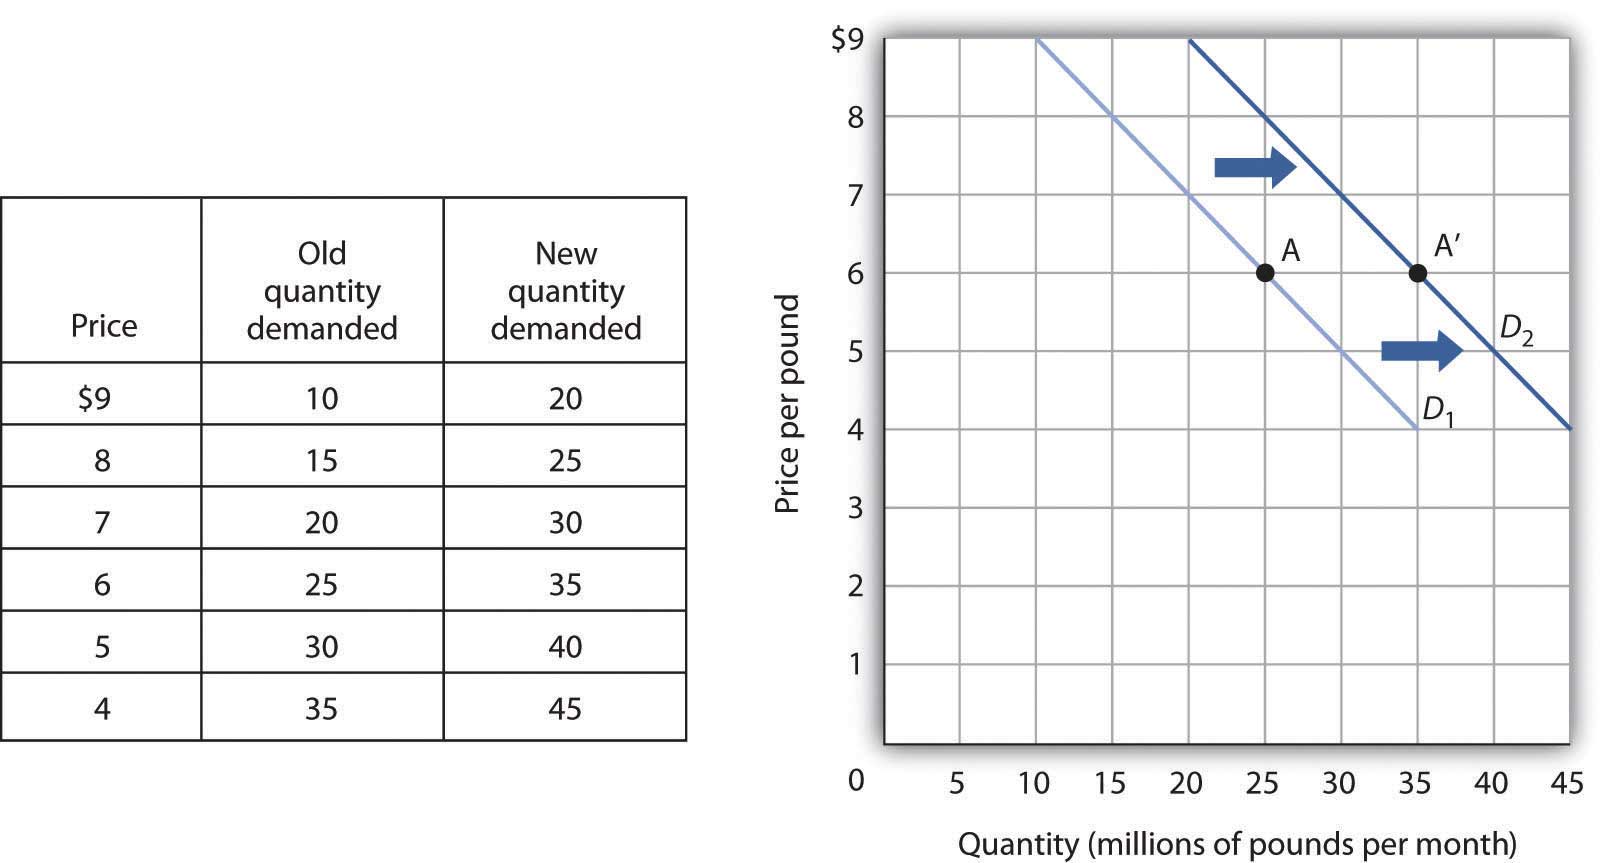
Refer to Fig 3.2; when the price of tea, a substitute for coffee, rises, more coffee is demanded at each price, as people substitute away from tea and consume more coffee. The result is a shift in demand from the original curve D1 to D2. The quantity of coffee demanded for $6 per pound rises from 25 million pounds per month (point A) to 35 million pounds per month (point A′). Note that a change in quantity demanded, ceteris paribus, refers to a movement along the demand curve, while a change in demand refers to a shift in the demand curve. A rightward shift of the demand curve is called an increase in demand.
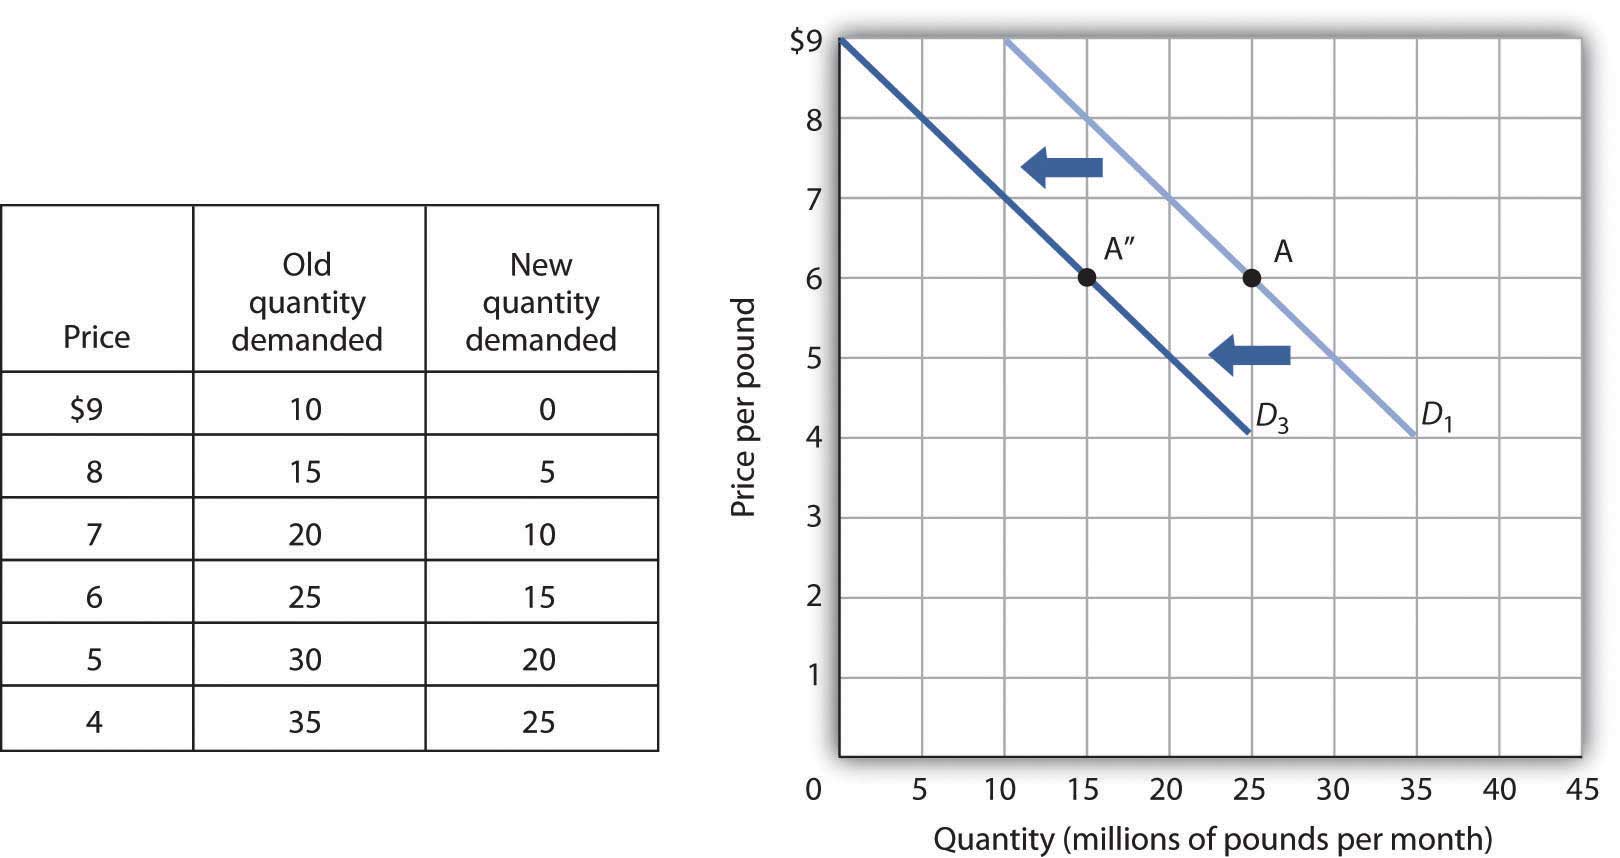
Refer to Fig 3.3; when the price of tea, a substitute for coffee, falls, less coffee is demanded at each price, as people substitute away from coffee because tea is relatively cheaper. The result is a shift in demand from the original curve D1 to D3. The quantity of coffee demanded for $6 per pound falls from 25 million pounds per month (point A) to 15 million pounds per month (point A″). Note, again, that a change in quantity demanded, ceteris paribus, refers to a movement along the demand curve, while a change in demand refers to a shift in the demand curve. A leftward shift of the demand curve is called a decrease in demand.
Income
As incomes rise, people increase their consumption of many goods and services, and as incomes fall, their consumption of these goods and services falls. An increase in income is likely to raise the demand for gasoline, ski trips, new cars, and jewellery. There are, however, goods and services for which consumption falls as income rises—and rises as income falls. As incomes rise, for example, people tend to consume more fresh fruit but less canned fruit.
A good for which demand increases when income increases is called a normal good. A good for which demand decreases when income rises is called an inferior good. An increase in income shifts the demand curve for fresh fruit (a normal good) to the right; it shifts the demand curve for canned fruit (an inferior good) to the left.
Preferences
Changes in the preferences of buyers can have significant consequences for demand. An example is the reduced demand for cigarettes caused by concern about the effect of smoking on health. A preference change that makes one good or service more popular will shift the demand curve to the right. A change that makes it less popular will shift the demand curve to the left.
Demographic Characteristics
The number of buyers affects the total quantity of a good or service that will be bought; generally, the greater the population, the greater the demand. Other demographic characteristics can affect demand as well. As the share of the population over age 65 increases, the demand for medical services increases. When birth rates rise, this raises the demand for such things as infant supplies, elementary school teachers, soccer coaches, in-line skates, and college education. Demand can thus shift as a result of changes in both the number and characteristics of buyers.
Buyer Expectations about future prices
The consumption of goods that can be easily stored or whose consumption can be postponed is strongly affected by buyer expectations. The expectation of newer TV technologies, such as high-definition TV, could slow down sales of regular TVs. If people expect gasoline prices to rise tomorrow, they will fill up their tanks today to try to beat the price increase. The same will be valid for goods such as automobiles and washing machines: an expectation of higher prices in the future will lead to more purchases today. If the price of a good is expected to fall, however, people are likely to reduce their purchases today and await tomorrow’s lower prices. For example, the expectation that computer prices will fall can reduce current demand.
Attribution
“3.1 Demand” in Principles of Macroeconomics by the University of Minnesota is licensed under a Creative Commons Attribution-NonCommercial-ShareAlike 4.0 International License.
