12.1 The Government of Canada and its Budget
The Budget is a blueprint for how the government wants to set the annual economic agenda for Canada. And it’s the job of the Department of Finance to prepare it. A basic government budget has two components:
- Government expenditures on goods and services, [latex]G[/latex], and transfer payments ([latex]G+TR[/latex]).
- Taxes are set to generate revenue to finance expenditure ([latex]T[/latex]).
The budget is estimated as the difference between ([latex]G+TR[/latex]) and ([latex]T[/latex]).
The Canadian government faces three budget situations:
- Budget deficit
- Budget surplus
- Budget balance
In case of budget deficit, total expenses exceed total revenues ([latex]G+TR>T[/latex]). In case of budget surplus, total revenues exceed total expenditures ([latex]G+TR< T[/latex]). When total expenditure and revenues match, we say the government faces a balanced budget ([latex]G+TR=T[/latex]). A budget deficit increases the government’s debt, and a budget surplus reduces public debt.
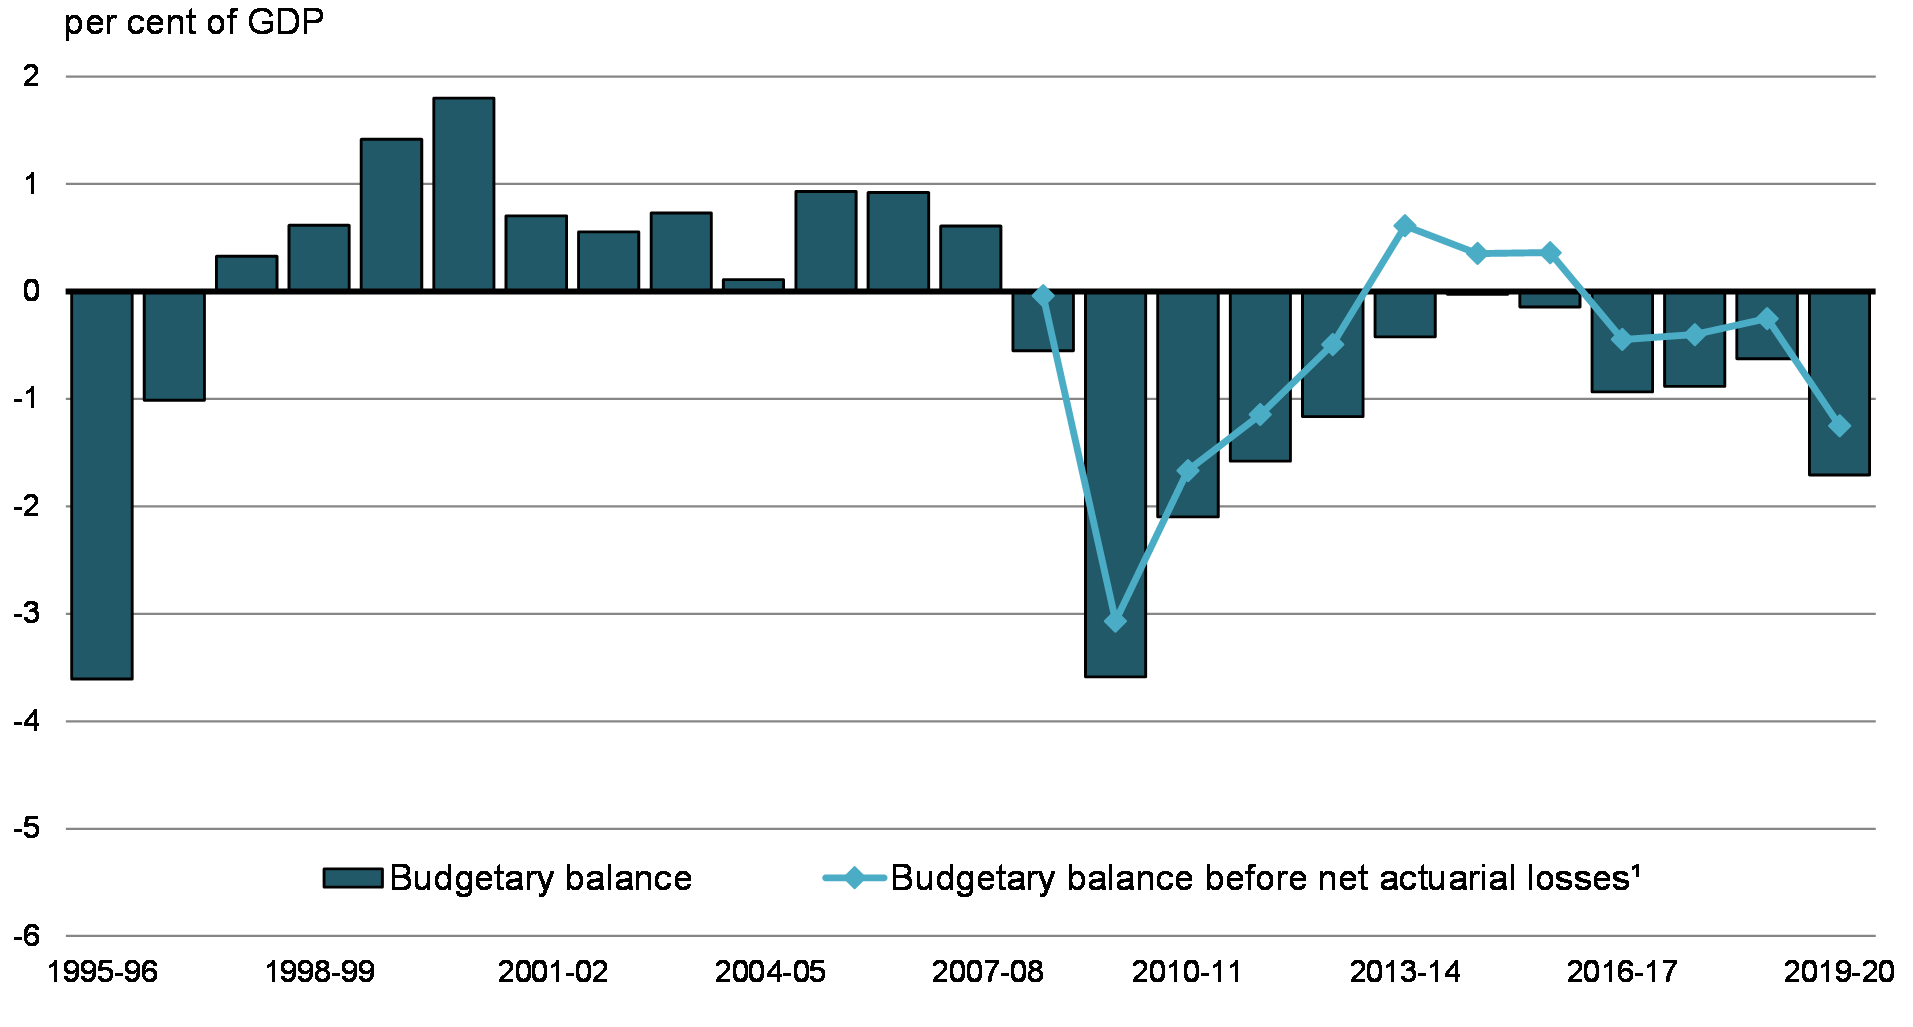
The following graph shows the government’s budgetary balance since 1995-96.
| Fiscal Year | Budgetary Balance (% of GDP) | Budgetary balance before net actuarial losses (% of GDP) |
|---|---|---|
| 1995-96 | -3.6 | |
| 1996-97 | -1.0 | |
| 1997-98 | 0.3 | |
| 1998-99 | 0.6 | |
| 1999-00 | 1.4 | |
| 2000-01 | 1.8 | |
| 2001-02 | 0.7 | |
| 2002-03 | 0.6 | |
| 2003-04 | 0.7 | |
| 2004-05 | 0.1 | |
| 2005-06 | 0.9 | |
| 2006-07 | 0.9 | |
| 2007-08 | 0.6 | |
| 2008-09 | -0.6 | 0.0 |
| 2009-10 | -3.6 | -3.1 |
| 2010-11 | -2.1 | -1.7 |
| 2011-12 | -1.6 | -1.1 |
| 2012-13 | -1.2 | -0.5 |
| 2013-14 | -0.4 | 0.6 |
| 2014-15 | 0.0 | 0.4 |
| 2015-16 | -0.1 | 0.4 |
| 2016-17 | -0.9 | -0.4 |
| 2017-18 | -0.9 | -0.4 |
| 2018-19 | -0.6 | -0.3 |
| 2019-20 | -1.7 | -1.2 |
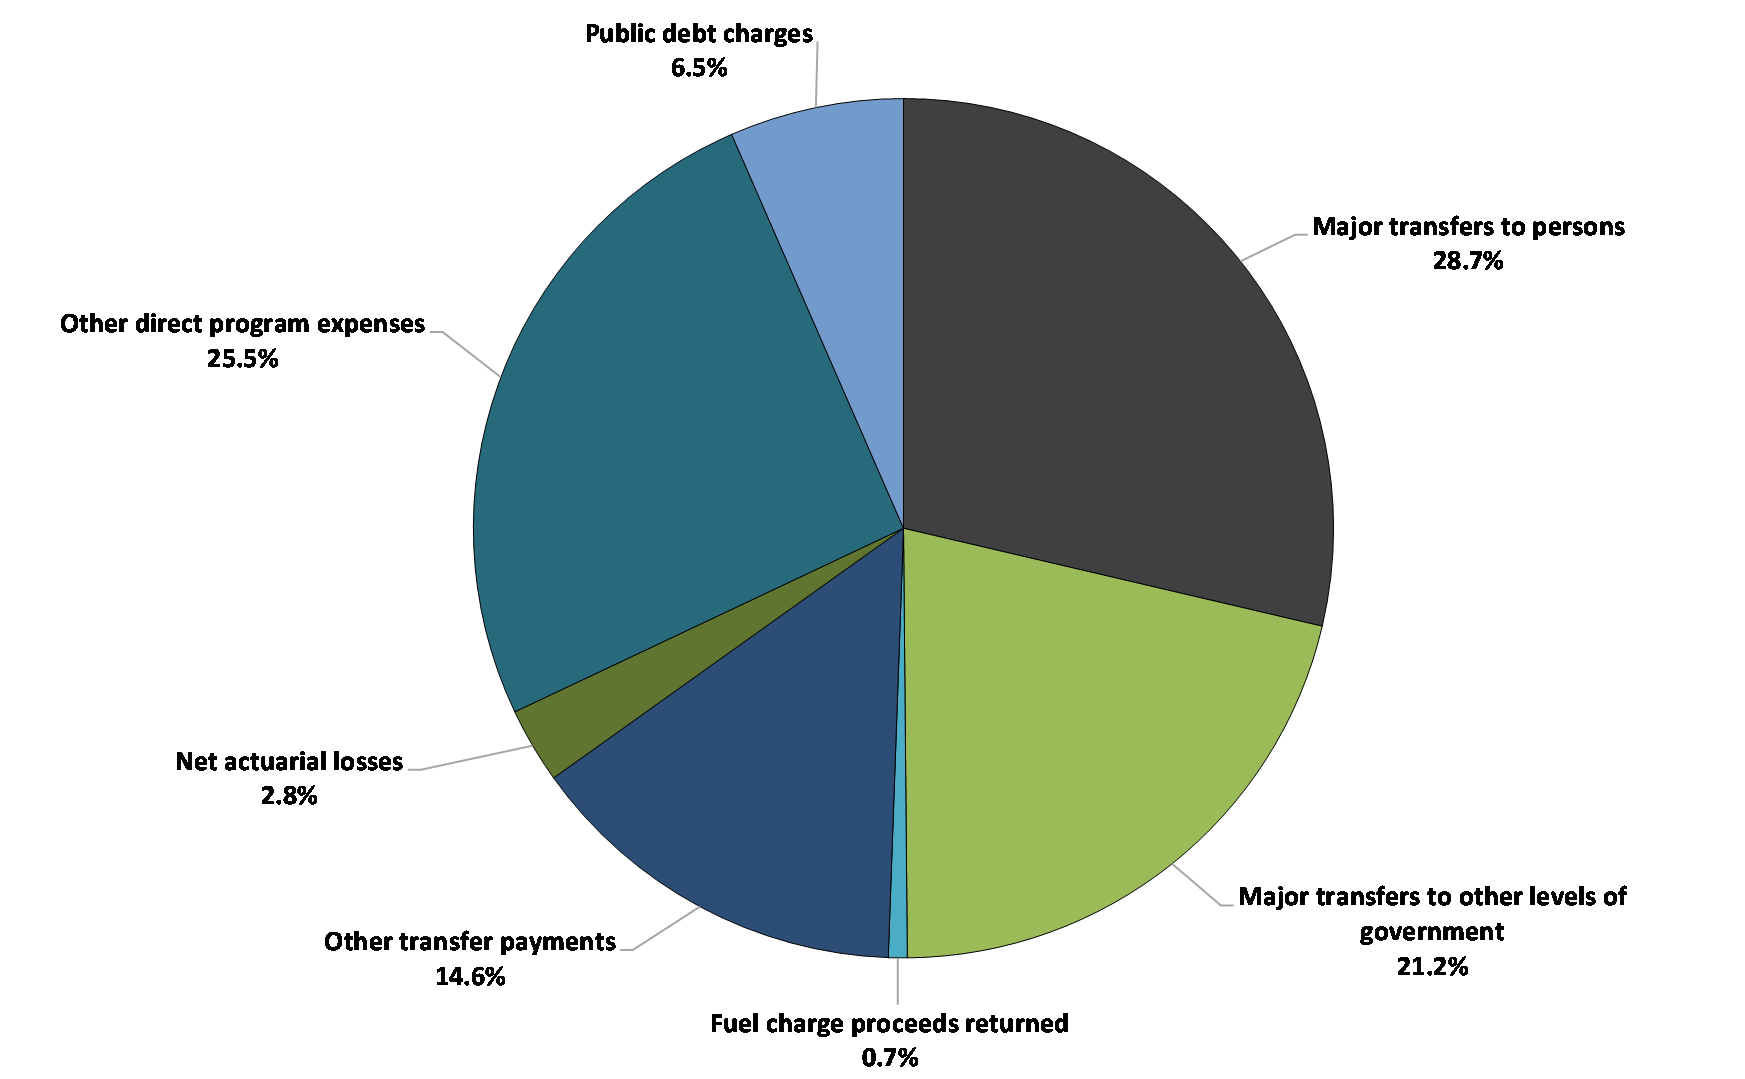
The pie charts below show the composition of Canada’s recent fiscal outlays and revenues.
Federal expenses can be divided into four main categories. The first is transfer payments, which account for roughly two-thirds of all federal spending: net actuarial losses, other direct program expenses, and public debt charges. The main category of transfer payments is major transfers to persons, which made up 28.7 percent of total expenses in 2019-20 (up from 27.8 percent in 2018-19). This category consists of the elderly, EI and children’s benefits, and Canada Emergency Response Benefit given out during COVID-19.
| Composition of expenses for 2019-20 | Percent |
|---|---|
| Major transfers to persons | 28.7 |
| Major transfers to other levels of government | 21.2 |
| Fuel charge proceeds returned | 0.7 |
| Other transfer payments | 14.6 |
| Net actuarial losses | 2.8 |
| Other direct program expenses | 25.5 |
| Public debt charges | 6.5 |
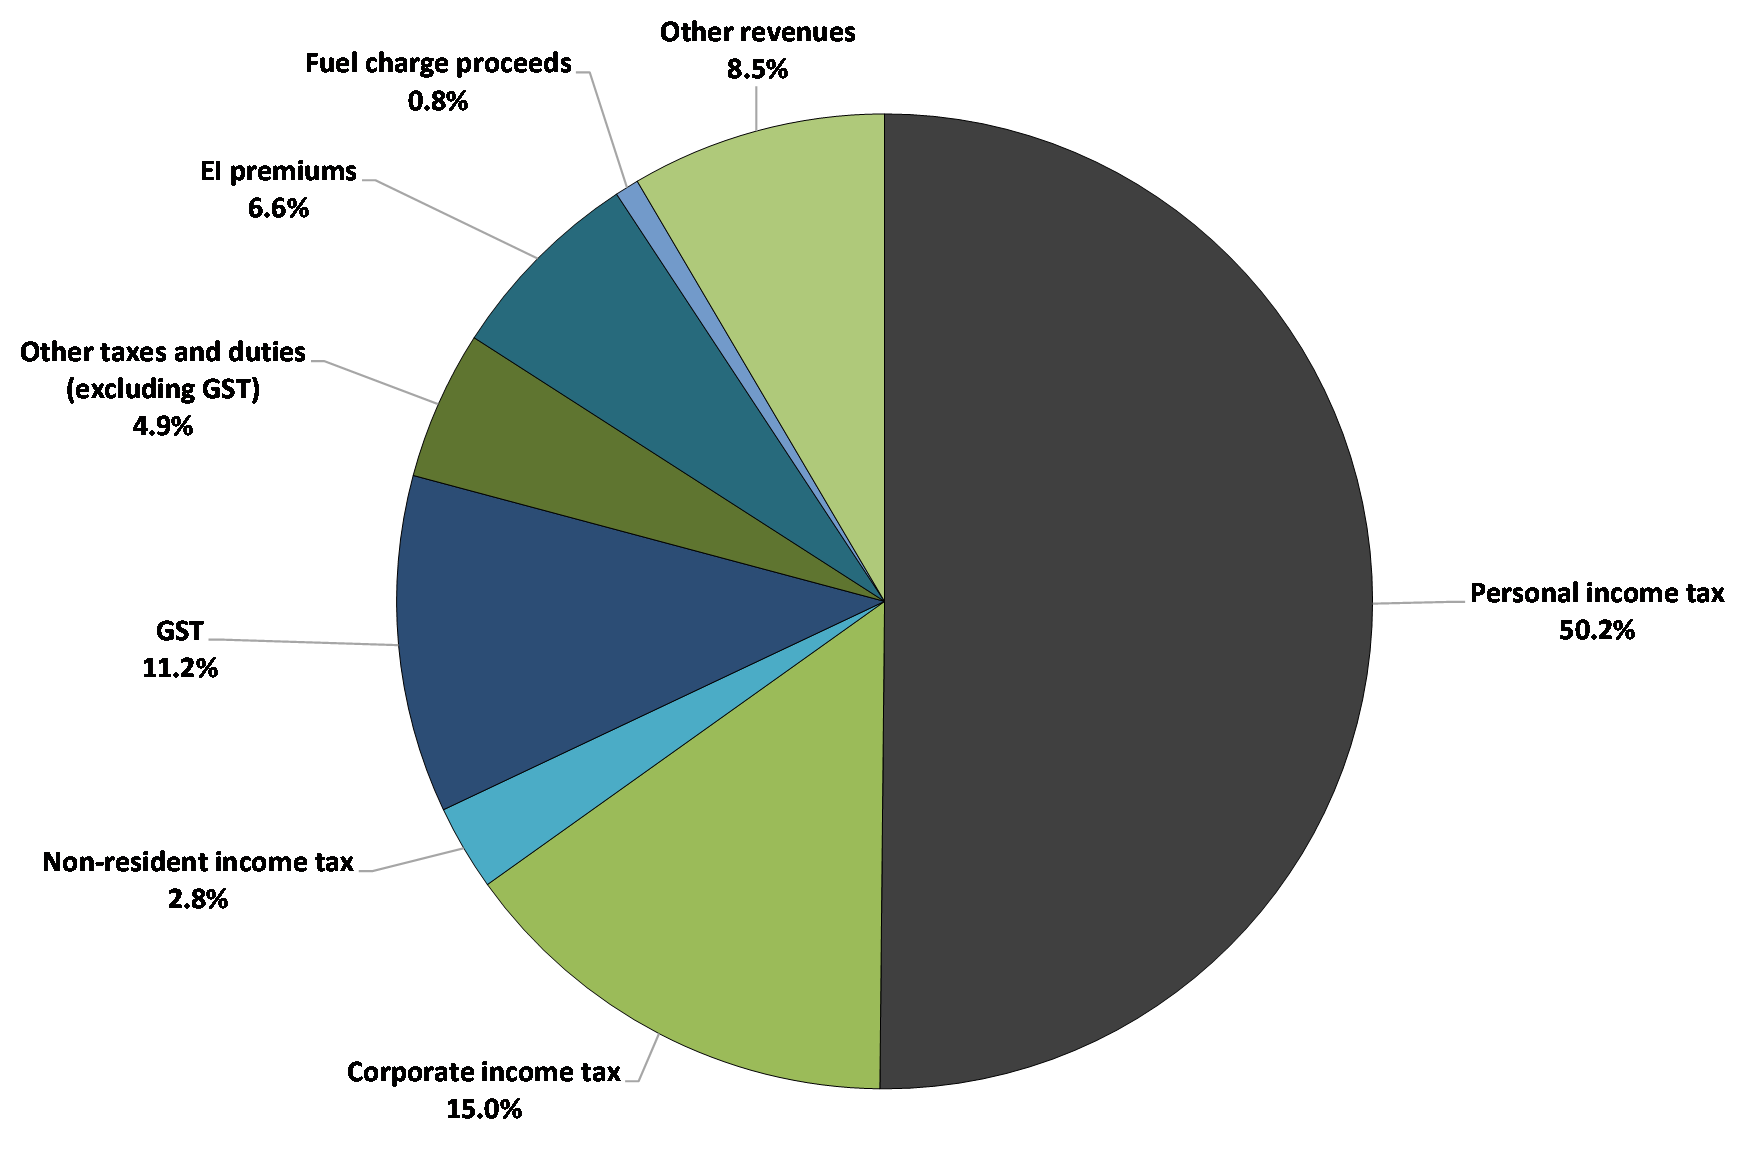
Federal revenues can be divided into five main categories: income tax revenues, other taxes and duties, Employment Insurance (EI) premium revenues, fuel charge proceeds, and other revenues. Within the income tax category, personal income tax revenues are the largest source of federal revenues, accounting for 50.2 percent of total revenues in 2019-20.
| Composition of Revenues for 2019–20 | per cent |
|---|---|
| Personal income tax | 50.2 |
| Corporate income tax | 15.0 |
| Non-resident income tax | 2.8 |
| GST | 11.2 |
| Other taxes and duties (excluding GST) | 4.9 |
| EI premiums | 6.6 |
| Fuel charge proceeds | 0.8 |
| Other revenues | 8.5 |
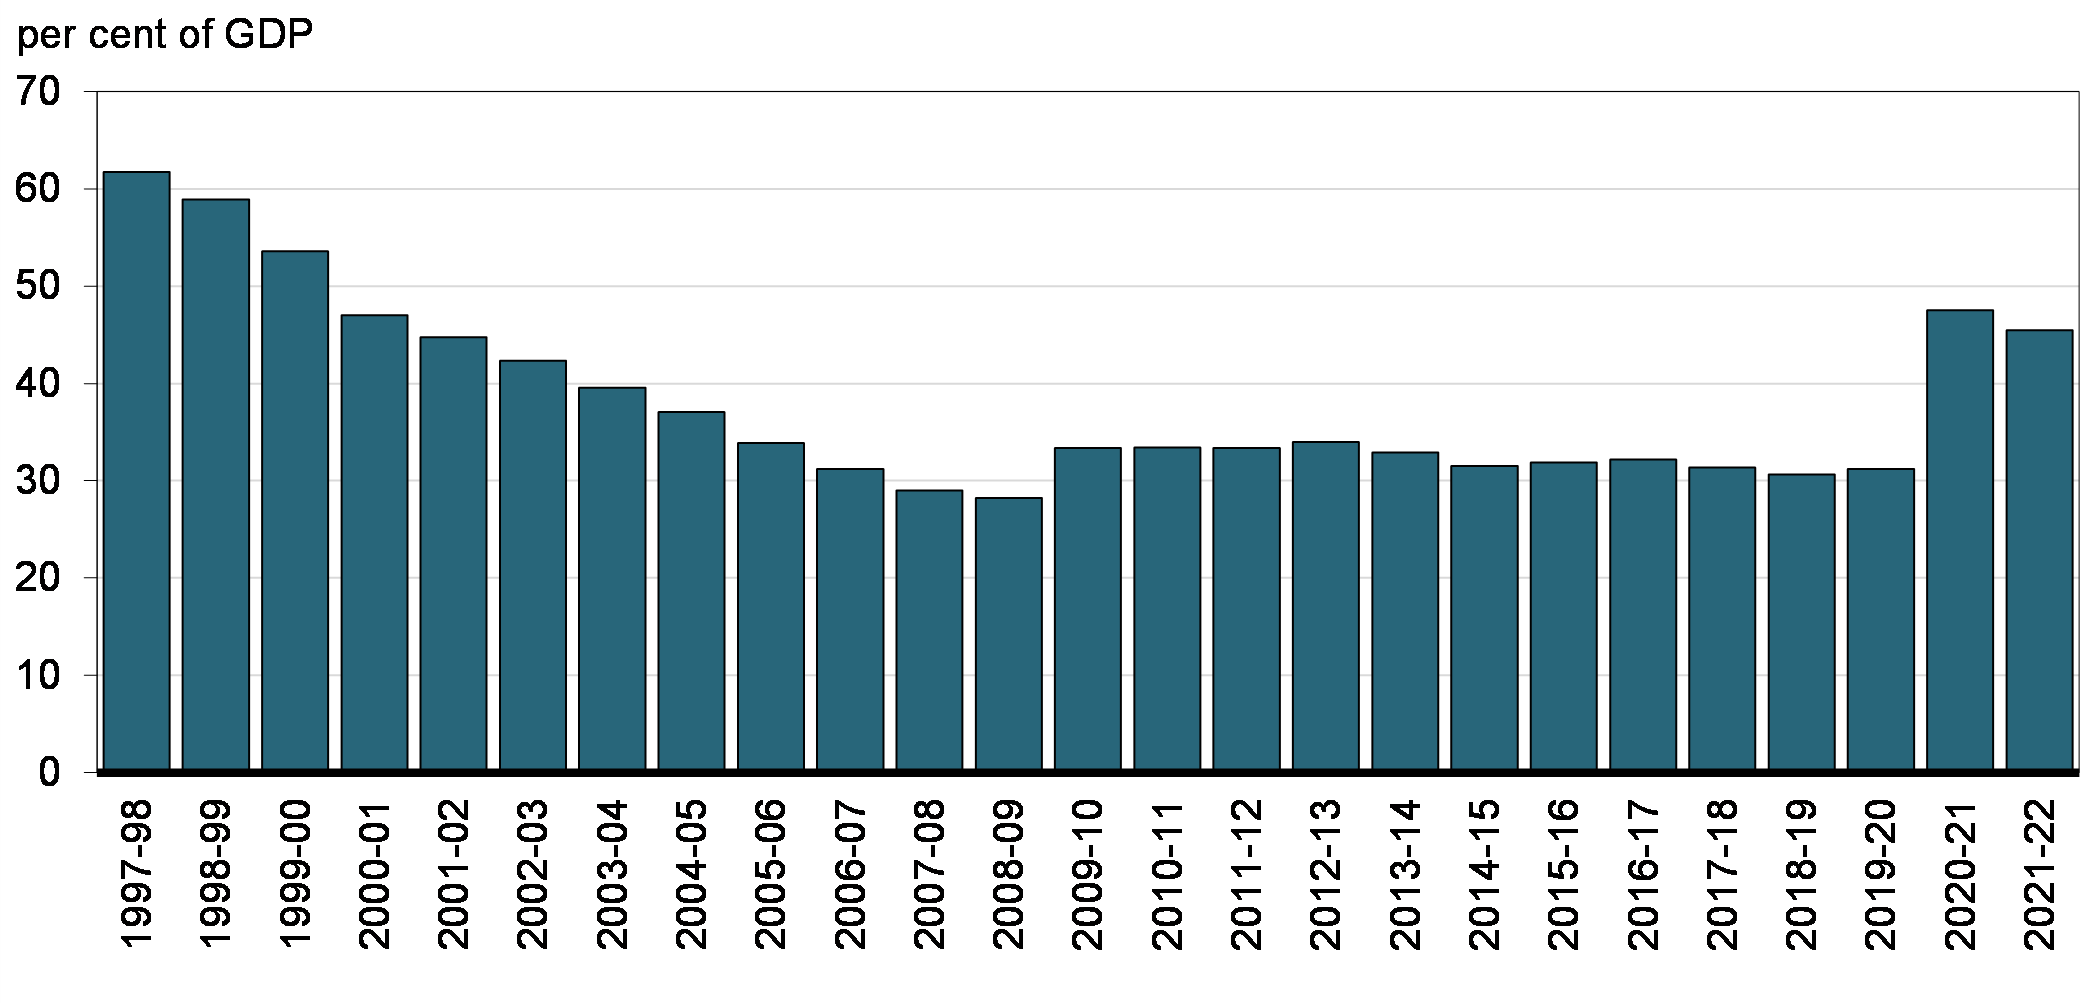
The following chart shows the federal debt since 1997–98. The federal debt stood at 45.5 percent of GDP in 2021–22, down from 47.5 percent in 2020–21. As its key fiscal anchor, the government is committed to reducing the accumulated deficit-to-GDP ratio over the medium term.
| Year | Percent of GDP |
|---|---|
| 1997-98 | 61.7 |
| 1998-99 | 58.9 |
| 1999-00 | 53.6 |
| 2000-01 | 47.0 |
| 2001-02 | 44.7 |
| 2002-03 | 42.3 |
| 2003-04 | 39.5 |
| 2004-05 | 37.0 |
| 2005-06 | 33.9 |
| 2006-07 | 31.2 |
| 2007-08 | 29.0 |
| 2008-09 | 28.2 |
| 2009-10 | 33.4 |
| 2010-11 | 33.4 |
| 2011-12 | 33.4 |
| 2012-13 | 34.0 |
| 2013-14 | 32.9 |
| 2014-15 | 31.5 |
| 2015-16 | 31.9 |
| 2016-17 | 32.2 |
| 2017-18 | 31.4 |
| 2018-19 | 30.7 |
| 2019-20 | 31.2 |
| 2020-21 | 47.5 |
| 2021-22 | 45.5 |
Attribution
“Annual Financial Report of the Government of Canada Fiscal Year 2019-2020” by Department of Finance Canada is used in accordance with the Department of Finance Canada website Terms and Conditions.
“Annual Financial Report of the Government of Canada Fiscal Year 2021-2022” by Department of Finance Canada is used in accordance with the Department of Finance Canada website Terms and Conditions.
“Composition of Expenses for 2019–20” by Department of Finance Canada. Reproduced in accordance with the Finance Canada website Terms and Conditions.
“Composition of Revenues for 2019–20” by Department of Finance Canada. Reproduced in accordance with the Finance Canada website Terms and Conditions.
Principles of Macroeconomics by D. Curtis and I. Irvine is licensed under a Creative Commons Attribution-NonCommercial-ShareAlike 4.0 International License, except where otherwise noted.
