7.5 Shifts in Demand and Supply for Loanable Funds
Change in Demand for Loanable Funds
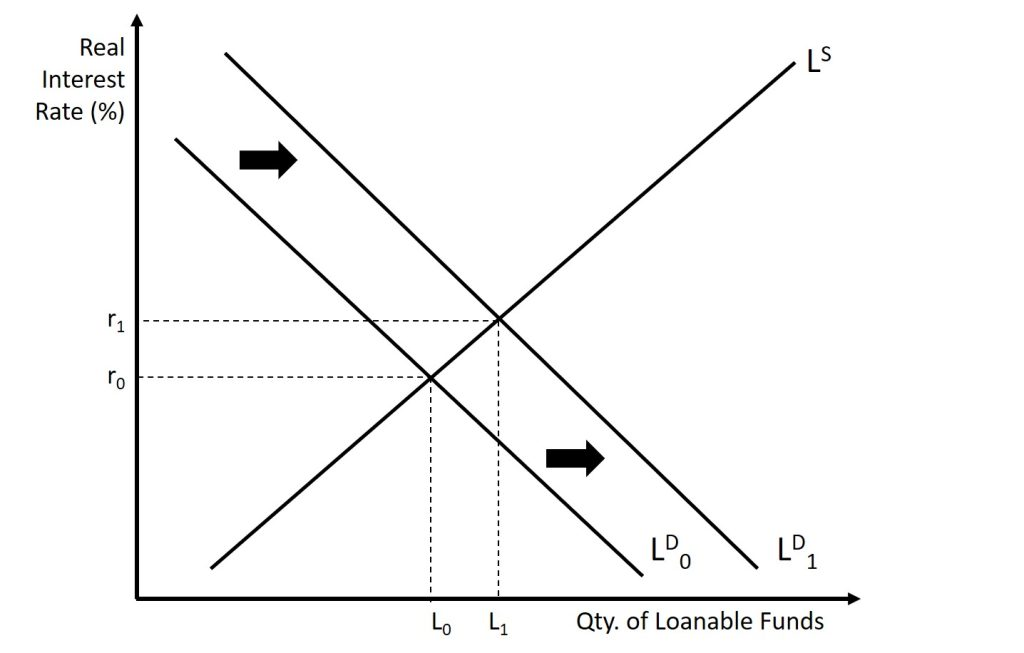
Suppose that some event causes households and businesses to demand more loans. This may be caused by increased consumer optimism, which causes people to buy (and need to finance) more. It could be because of an uptick in business leading to increased confidence in investment projects businesses seek. It could be caused by a tax credit encouraging households or businesses (or both) to buy (and borrow) more. Whatever the cause, the result will be an outward shift of the demand curve.
The interest rate will adjust until the market is in a new state of equilibrium. The real interest rate and quantity of loanable funds will increase compared to the initial equilibrium. This is shown in Figure 7.3.
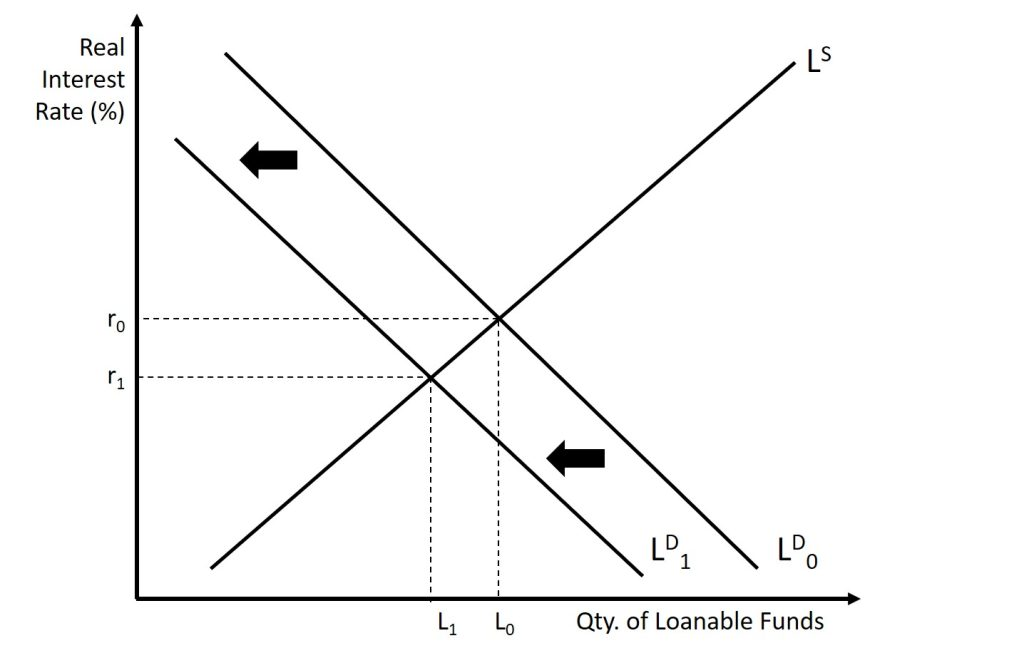
Suppose that some event causes households and businesses to demand fewer loans. This may be caused by increased consumer pessimism, which causes people to buy (and the need to finance) less. It could be because of a downturn in business leading to decreased confidence in investment projects businesses seek. Whatever the cause, the result will be an inward shift of the demand curve. The interest rate will adjust until the market is in a new state of equilibrium. The real interest rate and quantity of loanable funds will decrease compared to the initial equilibrium. This is shown in Figure 7.4.
Change in Supply of Loanable Funds
Suppose that some event causes households to save more. Such as, if there is a speculation that the economy may experience a slowdown in the near future, people tend to cut spending and are inclined to save more. The result will be an outward shift of the supply curve. This causes an increase in private savings, which increases national savings. At this point, more money is coming into the bank than going out. The interest rate will adjust until the market is in a new state of equilibrium. Compared to the initial equilibrium, the real interest rate will now be lower even though the quantity of loanable funds is now greater. This is shown in Figure 7.5.

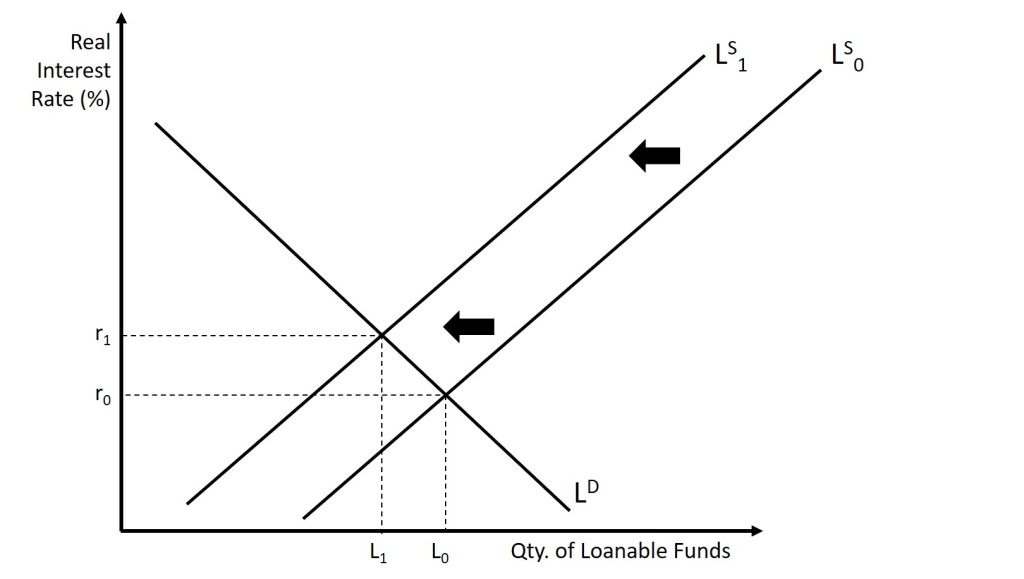
Suppose that some event causes households and businesses to save less. This may be caused by a desire to consume more (and hence save less), or a government policy may cause it. For example, suppose that the government raises the marginal tax rates on incomes, which means disposable income decreases. Therefore, households tend to save less. The result will be an inward shift of the supply curve. A decrease in private savings causes a decrease in national savings. The interest rate will adjust until the market is in a new state of equilibrium. The real interest rate and quantity of loanable funds will increase compared to the initial equilibrium. This is shown in Figure 7.6.

A Decrease in the Supply of Loanable Funds (Public Sector) – Crowding Out
When the government needs more money for its operations than it has collected in revenues, it must run a deficit. As we saw earlier, when the deficit increases, the gap between [latex]G[/latex] and [latex]T+TR[/latex] increases. Therefore, the level of government dissavings increases. As this occurs, public savings decreases, leading to a decrease in national savings. Graphically, the outcome is the same as when there is a decrease in the supply of loanable funds from Figure 7.6, but the cause is different. The result is shown below in Figure 7.7, but it is the same as the graph from Figure 7.6.
As the equilibrium interest rate rises due to a decrease in loanable funds, private investment could decrease as loans get more costly. When the government enacts policies that require borrowing, there is potentially less private investment, which is a hindrance. This phenomenon is called crowding out.
Crowding-out occurs when the government needs to spend additional money, so they spend money that the private sector could have spent instead. By reducing national savings through their dissaving, the quantity of loanable funds is less. As we will see in the chapter on Fiscal Policy, crowding out is a negative consequence of using fiscal policy; when the government enacts policies that require borrowing, there is potentially less private investment, which is a hindrance.
Attribution
“Chapter 8: The Market for Loanable Funds” in Introduction to Macroeconomics by J. Zachary Klingensmith is licensed under a Creative Commons Attribution-ShareAlike 4.0 International License.
