6.3 The Significance of Economic Growth
To demonstrate the impact of economic growth on a nation’s living standards, we must start with a clear definition of economic growth and then study its impact over time. We will also see how population growth affects the relationship between economic growth and the standard of living an economy can achieve.
Economic growth is a long-run process that occurs as an economy’s potential output increases. Earlier, we defined economic growth as the process through which an economy achieves an outward shift in its production possibilities curve. How does a shift in the production possibilities curve relate to a change in potential output? To produce its potential level of output, an economy must operate on its production possibilities curve. An increase in potential output thus implies an outward shift in the production possibilities curve.
There are three key points about economic growth to keep in mind:
- Growth is a process. It is not a single event; rather, it is an unfolding series of events.
- We define growth in terms of the economy’s ability to produce goods and services, as indicated by its level of potential output.
- Growth suggests that the economy’s ability to produce goods and services is rising. Economic growth is thus a discussion of the series of events that increase the economy’s ability to produce goods and services.
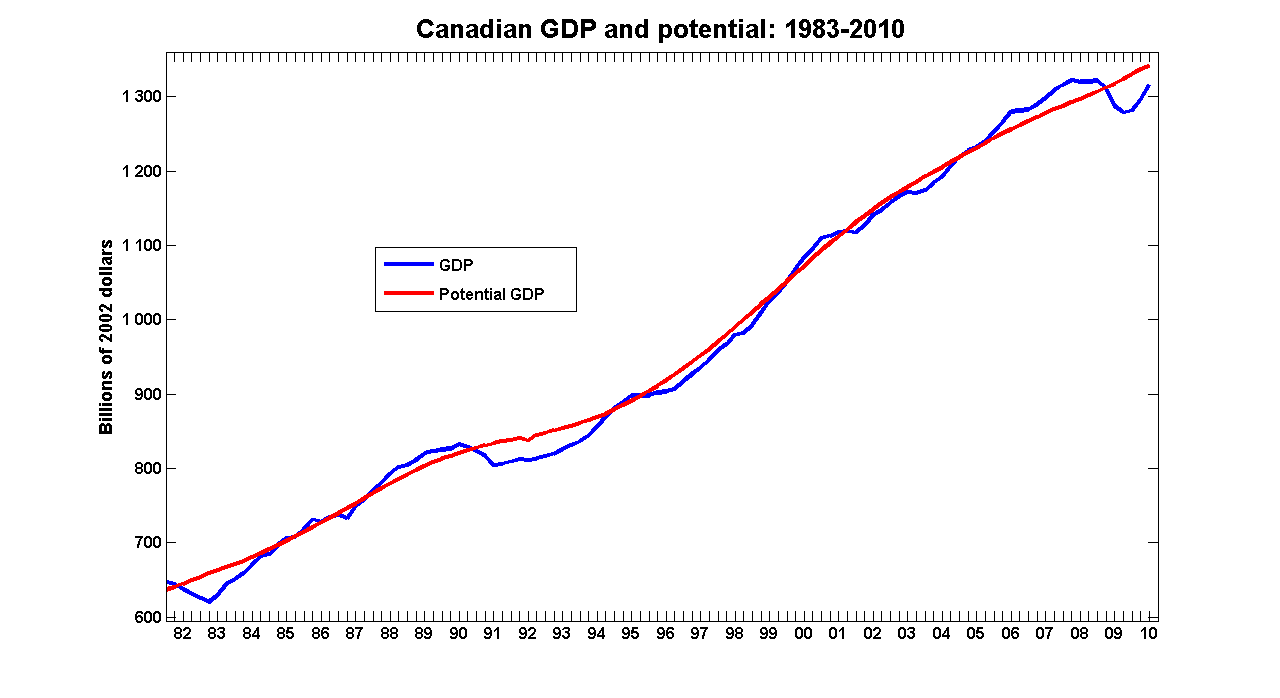
The graph (fig 6.1) shows annual levels of actual real GDP and potential output. The economy has experienced dramatic growth over the past forty years; potential and real output have soared. The figure also reminds us of a central theme of our macroeconomics analysis: real GDP fluctuates around potential output. Real GDP sagged well below its potential during the mid-’90s and rose well above its potential during 2005-06 before falling below its potential again during the financial crisis of 2008-09.
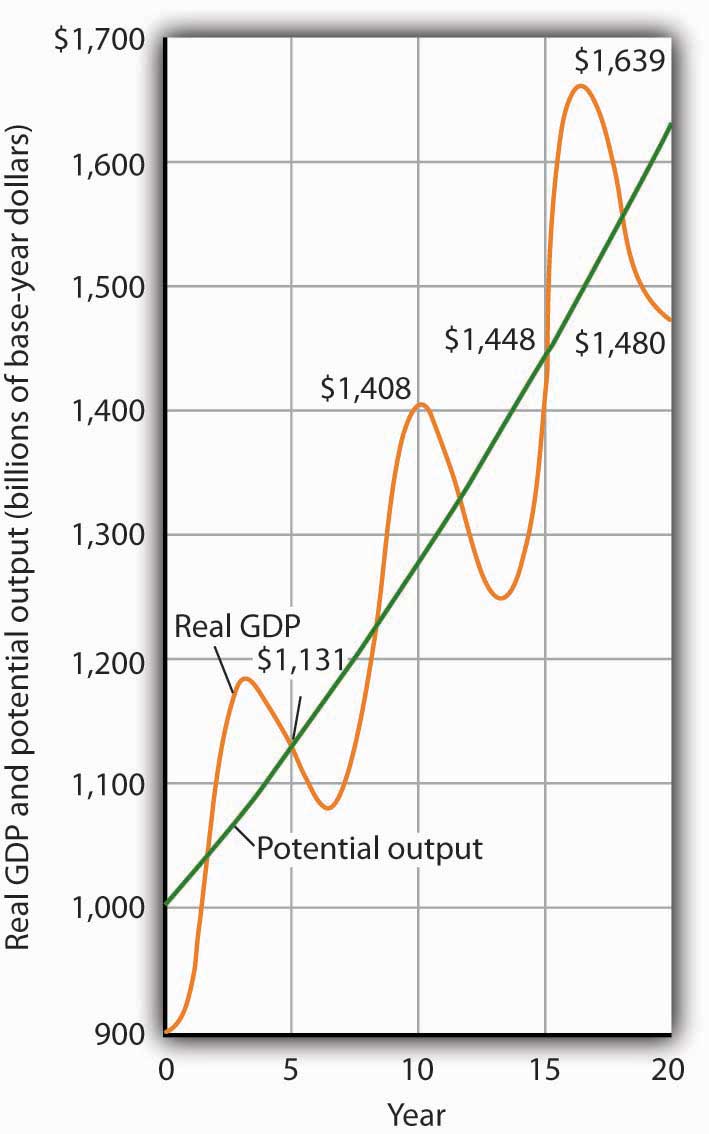
The graph below (Fig 6.2) shows the fluctuations around the potential GDP, and the changes in real GDP show the different phases of the business cycle (as discussed in Chapter 4). The rise in real GDP is the expansionary phase of the business cycle, and the fall in real GDP corresponds to the recessionary phase of the business cycle.
Attribution
“179. Reading: The Significance of Economic Growth” from Macroeconomics by Peter Turner is licensed under a Creative Commons Attribution 4.0 International License
