3.1 Demand
Price and Quantity Demand
While different variables play different roles in influencing the demands for various goods and services, economists pay special attention to one: the price of the good or service. Given the values of all the other variables that affect demand, a higher price tends to reduce the quantity people demand, and a lower price tends to increase it.
In perspective

A medium pizza typically sells for $5 to $10. Suppose the price was $30. You would probably buy fewer pizzas at that price than you do now. Suppose pizzas are typically sold for $2 each. At that price, people would likely buy more pizzas than they do now.
We will discuss first how price affects the quantity demanded of a good or service and then how other variables affect demand. Because people will purchase different quantities of a good or service at different prices, economists must be careful when discussing the “demand” for something. They have, therefore, developed some specific terms for expressing the general concept of demand.
The quantity demanded of a good or service is the quantity buyers are willing and able to buy at a particular price during a specific period, all other things unchanged (“ceteris paribus” in Latin).
Example: Demand
Suppose, for example, 100,000 movie tickets are sold monthly in a particular town for $8 per ticket. That quantity—100,000—is the quantity of movie admissions demanded monthly for $8. If the price were $12, we would expect the quantity demanded to be less. If it were $4, we would expect the quantity demanded to be greater. The quantity demanded at each price would be different if other things that might affect it, such as the town’s population, were to change. That is why we add the qualifier that other things have not changed to the definition of quantity demanded.
A demand schedule is a table that shows the quantities of a good or service demanded at different prices during a particular period, all other things unchanged. To introduce the concept of a demand schedule, let us consider the demand for coffee in Canada. The table in the figure below shows quantities of coffee demanded each month at prices ranging from $9 to $4 per pound; the table is a demand schedule. We see that the higher the price, the lower the quantity demanded and vice versa.
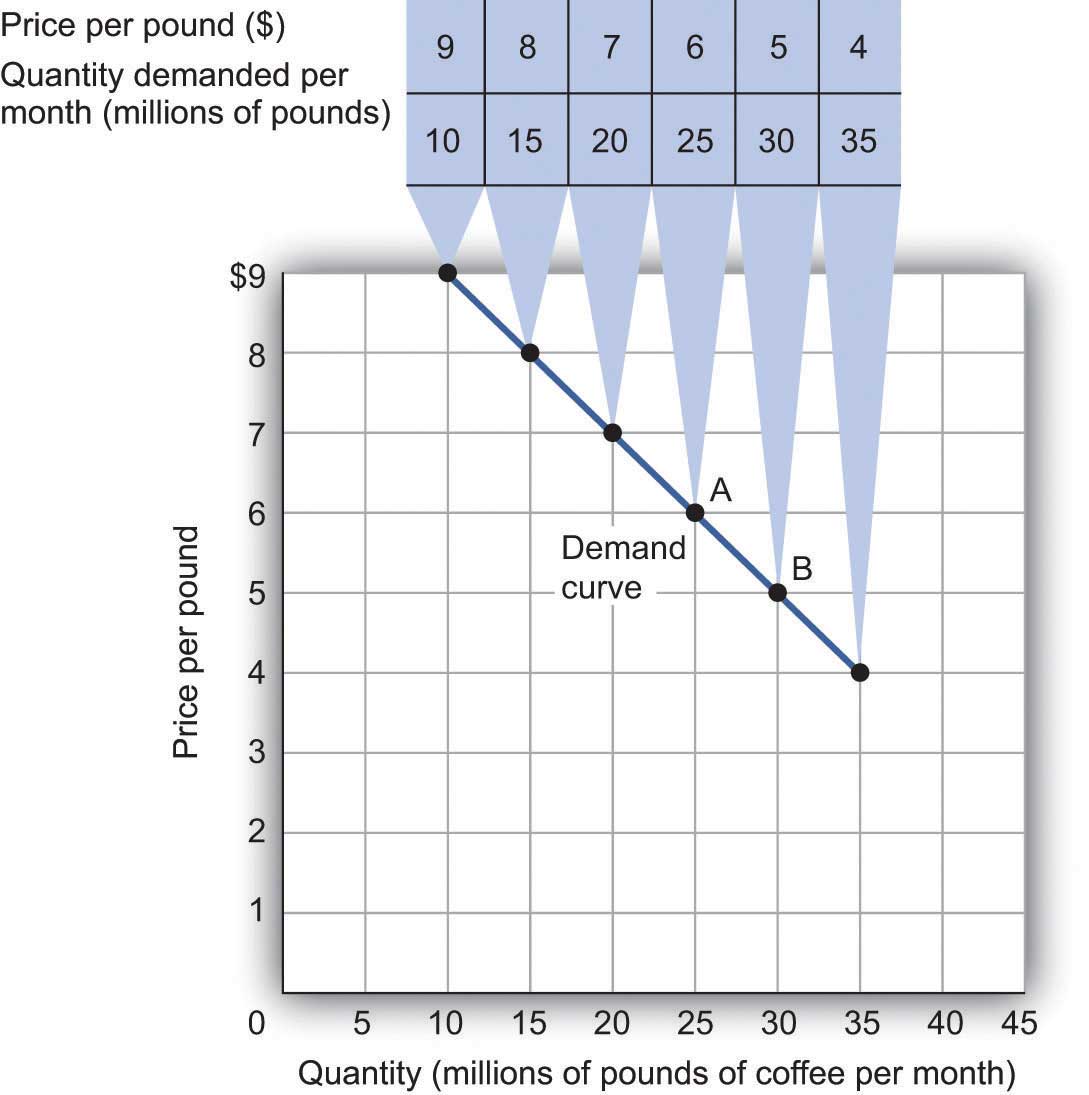
The information given in a demand schedule can be presented with a demand curve, a graphical representation of a demand schedule. A demand curve thus shows the relationship between the price and quantity demanded of a good or service during a particular period, with all other things unchanged. The demand curve in the above figure shows the prices and amounts of coffee given in the demand schedule. At point A, for example, we see that 25 million pounds of coffee per month are demanded for $6 per pound. By convention, economists graph price on the vertical axis and quantity on the horizontal axis.
A change in price, with no change in any of the other variables that affect demand, results in a movement along the demand curve. If the price of coffee falls from $6 to $5 per pound, consumption rises from 25 million pounds to 30 million pounds per month. That is a movement from point A to point B along the demand curve in Fig 3.1. A movement along a demand curve resulting from a price change is called a change in quantity demanded. Note that a change in quantity demanded is not a change or shift in the demand curve but a movement along the demand curve.
All other things unchanged, the Law of demand holds that, for virtually all goods and services, a higher price leads to a reduction in quantity demanded and a lower price leads to an increase in quantity demanded. The law of demand is called a law because the results of countless studies are consistent. Given the values of other variables that influence demand, a higher price reduces the quantity demanded. A lower price increases the quantity demanded—demand curves, in short, slope downward, as seen in the graph above.
Attribution
“3.1 Demand” in Principles of Macroeconomics by the University of Minnesota is licensed under a Creative Commons Attribution-NonCommercial-ShareAlike 4.0 International License.
