5.10 CPI and Core Inflation

Imagine driving a company truck across the country – you probably would care about things like the prices of available roadside food and motel rooms and the truck’s operating condition. However, the manager of the firm might have different priorities. He would care mainly about the truck’s on-time performance and much less about the food you were eating and the places you were staying. In other words, the company manager would pay attention to the firm’s production while ignoring transitory elements that impacted you but did not affect the company’s bottom line.
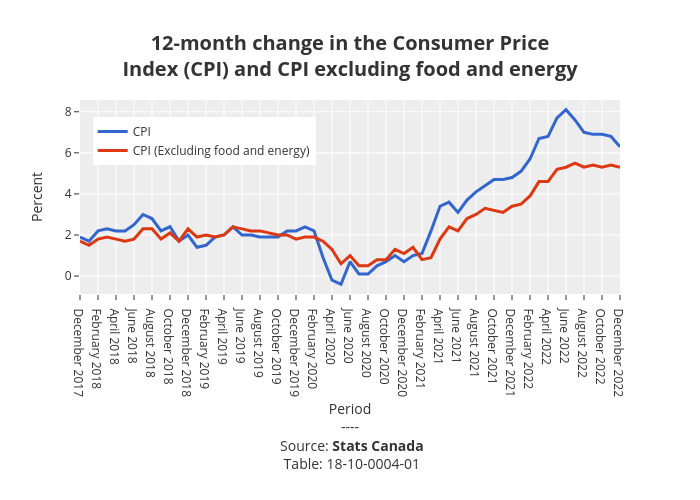
In a sense, a similar situation occurs with regard to measures of inflation. We’ve learned that CPI measures prices as they affect everyday household spending. Economists typically calculate a core inflation index by taking the CPI and excluding volatile economic variables, such as food and energy, whose prices show more swings. In this way, economists have a better sense of the underlying price trends that affect the cost of living.
Graph Data Table
| Period | CPI | CPI excluding food and energy |
|---|---|---|
| December 2017 | 1.9 | 1.7 |
| January 2018 | 1.7 | 1.5 |
| February 2018 | 2.2 | 1.8 |
| March 2018 | 2.3 | 1.9 |
| April 2018 | 2.2 | 1.8 |
| May 2018 | 2.2 | 1.7 |
| June 2018 | 2.5 | 1.8 |
| July 2018 | 3.0 | 2.3 |
| August 2018 | 2.8 | 2.3 |
| September 2018 | 2.2 | 1.8 |
| October 2018 | 2.4 | 2.1 |
| November 2018 | 1.7 | 1.7 |
| December 2018 | 2.0 | 2.3 |
| January 2019 | 1.4 | 1.9 |
| February 2019 | 1.5 | 2.0 |
| March 2019 | 1.9 | 1.9 |
| April 2019 | 2.0 | 2.0 |
| May 2019 | 2.4 | 2.4 |
| June 2019 | 2.0 | 2.3 |
| July 2019 | 2.0 | 2.2 |
| August 2019 | 1.9 | 2.2 |
| September 2019 | 1.9 | 2.1 |
| October 2019 | 1.9 | 2.0 |
| November 2019 | 2.2 | 2.0 |
| December 2019 | 2.2 | 1.8 |
| January 2020 | 2.4 | 1.9 |
| February 2020 | 2.2 | 1.9 |
| March 2020 | 0.9 | 1.7 |
| April 2020 | -0.2 | 1.3 |
| May 2020 | -0.4 | 0.6 |
| June 2020 | 0.7 | 1.0 |
| July 2020 | 0.1 | 0.5 |
| August 2020 | 0.1 | 0.5 |
| September 2020 | 0.5 | 0.8 |
| October 2020 | 0.7 | 0.8 |
| November 2020 | 1.0 | 1.3 |
| December 2020 | 0.7 | 1.1 |
| January 2021 | 1.0 | 1.4 |
| February 2021 | 1.1 | 0.8 |
| March 2021 | 2.2 | 0.9 |
| April 2021 | 3.4 | 1.8 |
| May 2021 | 3.6 | 2.4 |
| June 2021 | 3.1 | 2.2 |
| July 2021 | 3.7 | 2.8 |
| August 2021 | 4.1 | 3.0 |
| September 2021 | 4.4 | 3.3 |
| October 2021 | 4.7 | 3.2 |
| November 2021 | 4.7 | 3.1 |
| December 2021 | 4.8 | 3.4 |
| January 2022 | 5.1 | 3.5 |
| February 2022 | 5.7 | 3.9 |
| March 2022 | 6.7 | 4.6 |
| April 2022 | 6.8 | 4.6 |
| May 2022 | 7.7 | 5.2 |
| June 2022 | 8.1 | 5.3 |
| July 2022 | 7.6 | 5.5 |
| August 2022 | 7.0 | 5.3 |
| September 2022 | 6.9 | 5.4 |
| October 2022 | 6.9 | 5.3 |
| November 2022 | 6.8 | 5.4 |
| December 2022 | 6.3 | 5.3 |
Attribution
“22.2 How to measure changes in the cost of living” from Principles of Economics 2e by OpenStax is licensed under Creative Commons Attribution 4.0 International License.
