4.6 GDP Deflator
In the next chapter, we will learn about inflation. This occurs when prices in the economy increase. We may also track the impact of price changes using GDP, in addition to using other measures that we will learn in Chapter 5. This form of measurement is referred to as the GDP Deflator.”

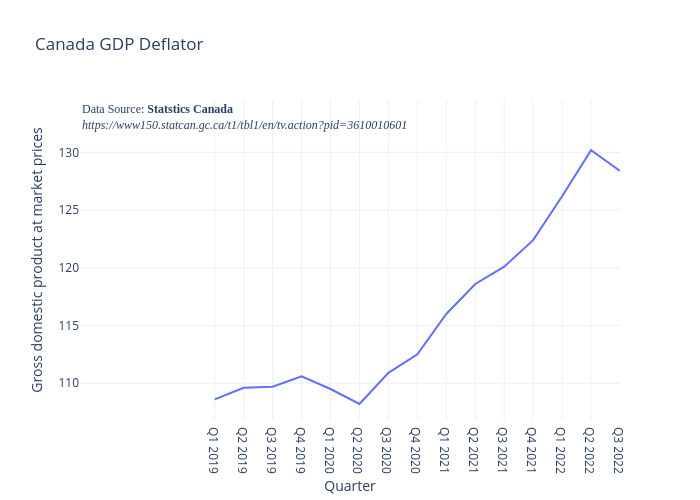
| 2019 Q1 | 2019 Q2 | 2019 Q3 | 2019 Q4 | 2020 Q1 | 2020 Q2 | 2020 Q3 | 2020 Q4 | 2021 Q1 | 2021 Q2 | 2021 Q3 | 2021 Q4 | 2022 Q1 | 2022 Q2 | 2022 Q3 |
|---|---|---|---|---|---|---|---|---|---|---|---|---|---|---|
| 108.6 | 109.6 | 109.7 | 110.6 | 109.5 | 108.2 | 110.9 | 112.5 | 116.0 | 118.6 | 120.1 | 122.4 | 126.2 | 130.2 | 128.4 |
The graph and table above show that the GDP Deflator in Canada decreased to 128.40 points in the third quarter of 2022 from 130.20 points in the second quarter of 2022.
The GDP deflator is calculated as:
[latex]\begin{align*}\text{GDP Deflator}=100\times\left(\frac{\text{Nominal GDP}}{\text{Real GDP}}\right)\end{align*}[/latex]
We multiply by 100 to make it an index. An index is an easy-to-use value that we can use to compare different years easily. The goal of the deflator is to keep track of price levels from one year to the next.
Again, using 2018 as our base year, our GDP deflators are:
[latex]\begin{align*}&\text{GDPDef}_{18}=100\times\left(\frac{470}{470}\right)=100\times\left(1\right)=100\\[2ex]&\text{GDPDef}_{19}=100\times\left(\frac{695}{615}\right)=100\times\left(1.13\right)=113\\[2ex]&\text{GDPDef}_{20}=100\times\left(\frac{975}{665}\right)=100\times\left(1.47\right)=147\end{align*}[/latex]
It should be noted that the GDP deflator in the base year is 100. This will always be the case. As mentioned earlier, the nominal GDP and the real GDP will be equal in the base year. The GDP deflator in 2019 was 113, which means prices have risen by 13 percent between 2018 and 2019. Similarly, prices have risen 47 percent over the two-year period between 2018 and 2020.
Attribution
“6.1 Measuring the Size of the Economy: Gross Domestic Product” from Principles of Macroeconomics 3e by OpenStax-Rice University is licensed under a Creative Commons Attribution 4.0 license except where otherwise noted.

