3.5 Demand, Supply and Equilibrium
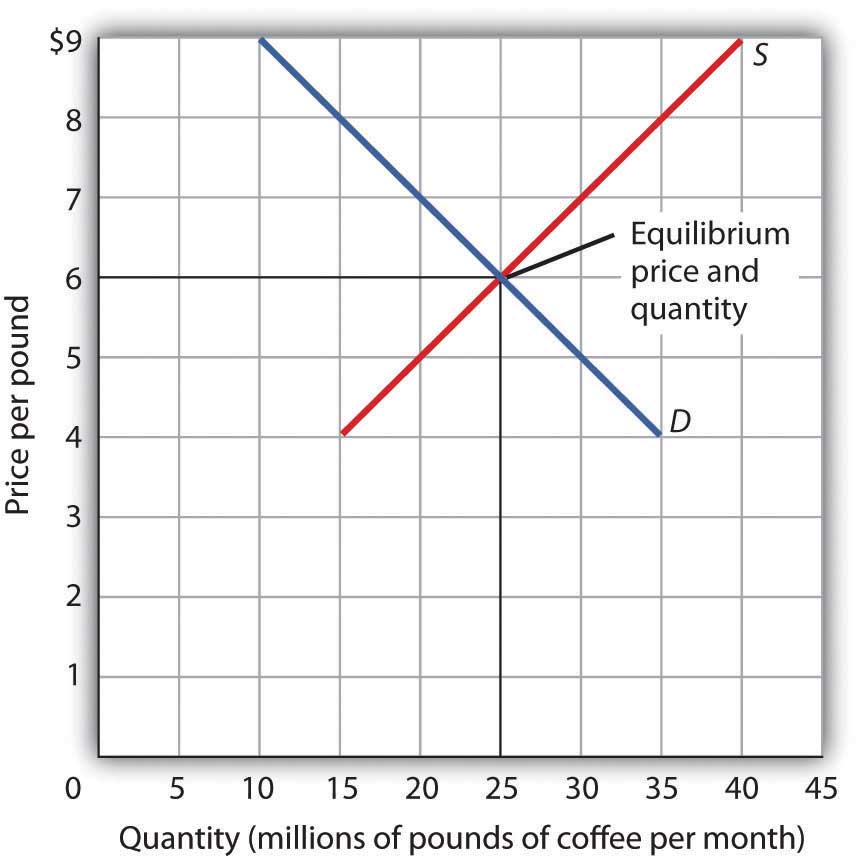
Fig 3.10 combines the demand and supply data introduced in Fig 3.1 and Fig 3.8. Notice that the two curves intersect for $6 per pound — at this price, the quantities demanded and supplied are equal. Buyers want to purchase, and sellers are willing to offer 25 million pounds of coffee per month for sale. The coffee market is in equilibrium. Unless the demand or supply curve shifts, there will be no tendency for price to change. The equilibrium price in any market is the price at which quantity demanded equals quantity supplied. The equilibrium price in the market for coffee is thus $6 per pound. The equilibrium quantity is the quantity demanded and supplied at the equilibrium price. At a price above the equilibrium, there is a natural tendency for the price to fall. At a price below the equilibrium, there is a tendency for the price to rise.

With an upward-sloping supply curve and a downward-sloping demand curve, there is only a single price at which the two curves intersect. This means there is only one price at which equilibrium is achieved. It follows that at any price other than the equilibrium price, the market will not be in equilibrium. We next examine what happens at prices different than the equilibrium price.
Surplus
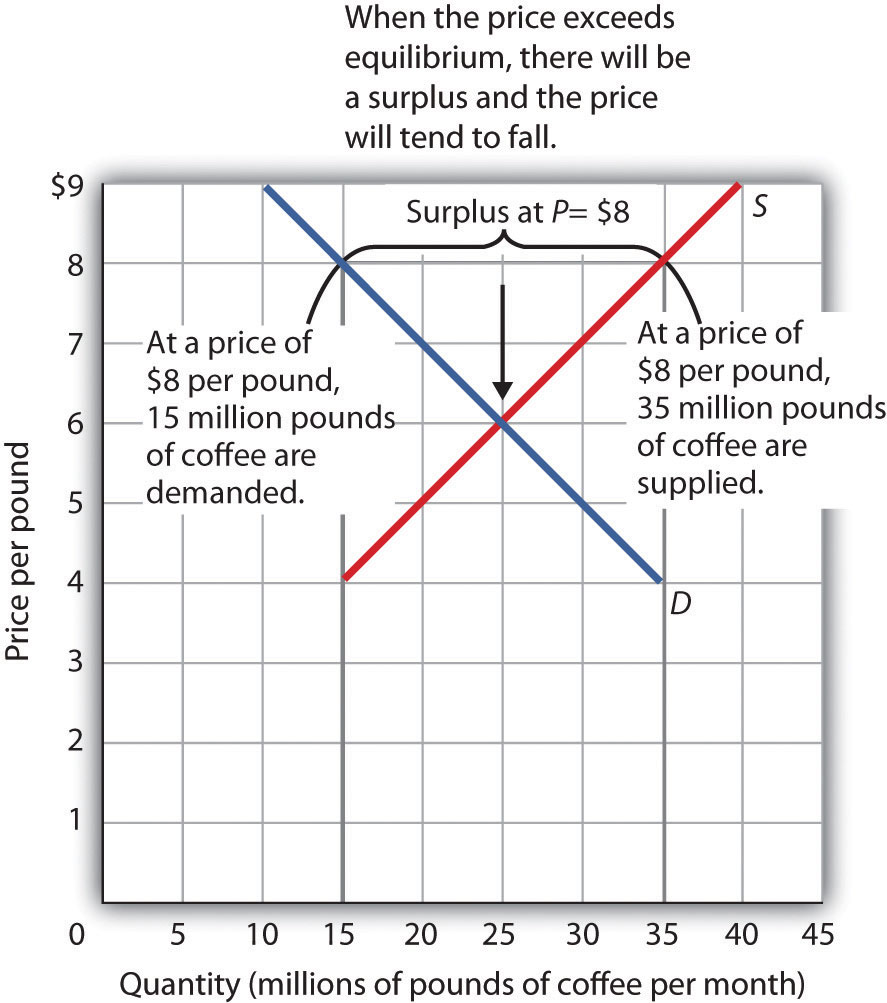
Fig 3.11 shows the same demand and supply curves we have just examined, but this time, the initial price is $8 per pound of coffee. Because we no longer have a balance between quantity demanded and quantity supplied, this price is not the equilibrium price. For $8, the amount of coffee consumers will be willing to buy — 15 million pounds per month. The supply curve tells us what sellers will offer for sale — 35 million pounds per month. The difference, 20 million pounds of coffee per month, is called a surplus.
Definition: Surplus
More generally, a surplus is the amount by which the quantity supplied exceeds the quantity demanded at the current price. A surplus occurs only if the current price exceeds the equilibrium price.

A surplus in the market for coffee will not last long. With unsold coffee on the market, sellers will reduce their prices to clear out unsold coffee. As coffee prices begin to fall, the quantity of coffee supplied declines. At the same time, the quantity of coffee demanded begins to rise. Remember that the reduced quantity supplied is a movement along the supply curve—the curve itself does not shift in response to a decrease in price.
Similarly, the increase in quantity demanded is a movement along the demand curve—the demand curve does not shift in response to a reduction in price. Price will continue to fall until it reaches its equilibrium level, at which the demand and supply curves intersect. At that point, there will be no tendency for prices to fall further. In general, surpluses in the marketplace are short-lived. The prices of most goods and services adjust quickly, eliminating the surplus.
Shortage
Just as a price above the equilibrium price will cause a surplus, a price below the equilibrium will cause a shortage.
Definition: Shortage
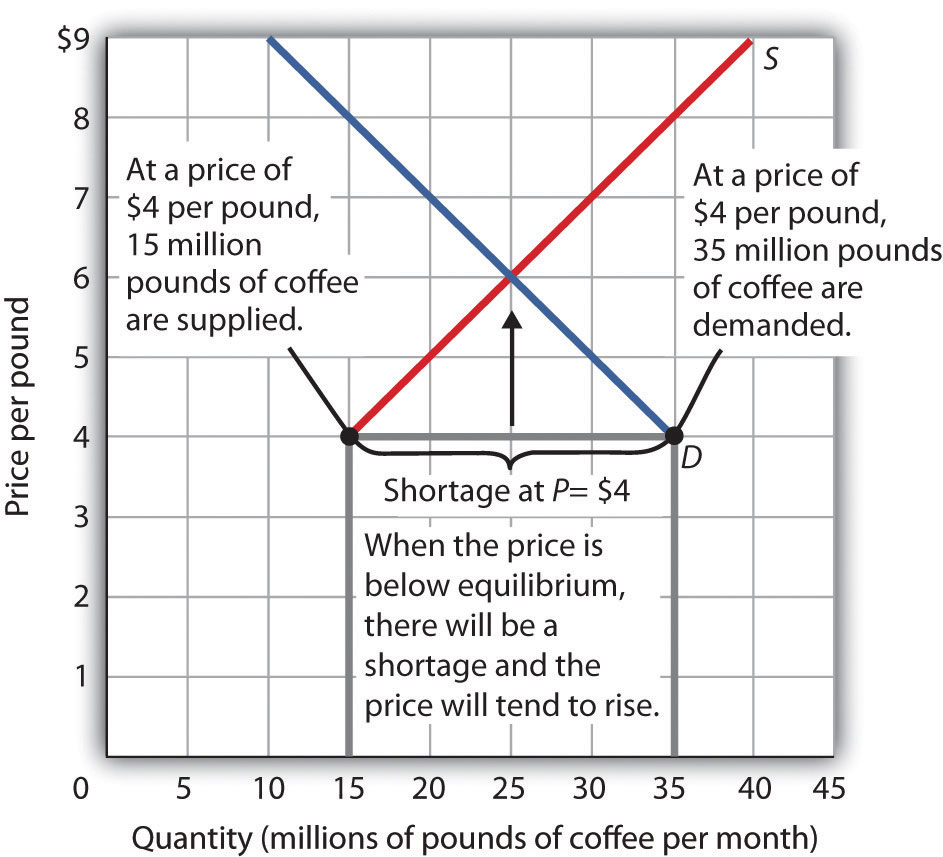
A shortage is the amount by which the quantity demanded exceeds the quantity supplied at the current price.

Fig 3.12 shows a shortage in the market for coffee. Suppose the price is $4 per pound. At that price, 15 million pounds of coffee would be supplied monthly, and 35 million pounds would be demanded monthly. When the quantity demanded exceeds the quantity supplied, there is a shortage. In the face of a shortage, sellers are likely to begin to raise their prices. As the price rises, there will be an increase in the quantity supplied (but not a change in supply) and a reduction in the quantity demanded (but not a change in demand) until the equilibrium price is achieved.
Attribution
“3.3 Demand Supply and Equilibrium” in Principles of Macroeconomics by the University of Minnesota is licensed under a Creative Commons Attribution-NonCommercial-ShareAlike 4.0 International License.

