11.3 Demand for Money
To understand the conduct of Monetary Policy, we use the money market model that constitute the demand for money and supply of money.
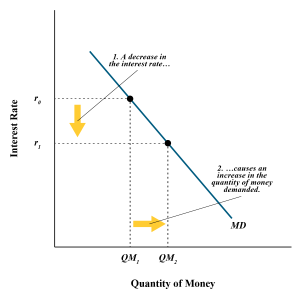
Households and businesses could either hold money or other financial assets. Below is the demand for money graph.

As the interest rate falls from [latex]r_0[/latex] to [latex]r_1[/latex], the quantity of money demand increases from [latex]QM_1[/latex] to [latex]QM_2[/latex], everything else held constant.
When the interest rate falls, the opportunity cost of holding money decreases, so people want to hold more money. At a lower interest rate, yields from other financial instruments go down, and therefore, the quantity of money demanded increases by households and businesses. Conversely, when the interest rate rises, the opportunity cost of holding money increases, so people want to hold less money. At a higher interest rate, earnings from other financial assets rise, and therefore, households and businesses decrease their quantity of money demand. The influence of the interest rate on the quantity of money demanded is represented by a movement along the money demand curve.
Changes in Money Demand
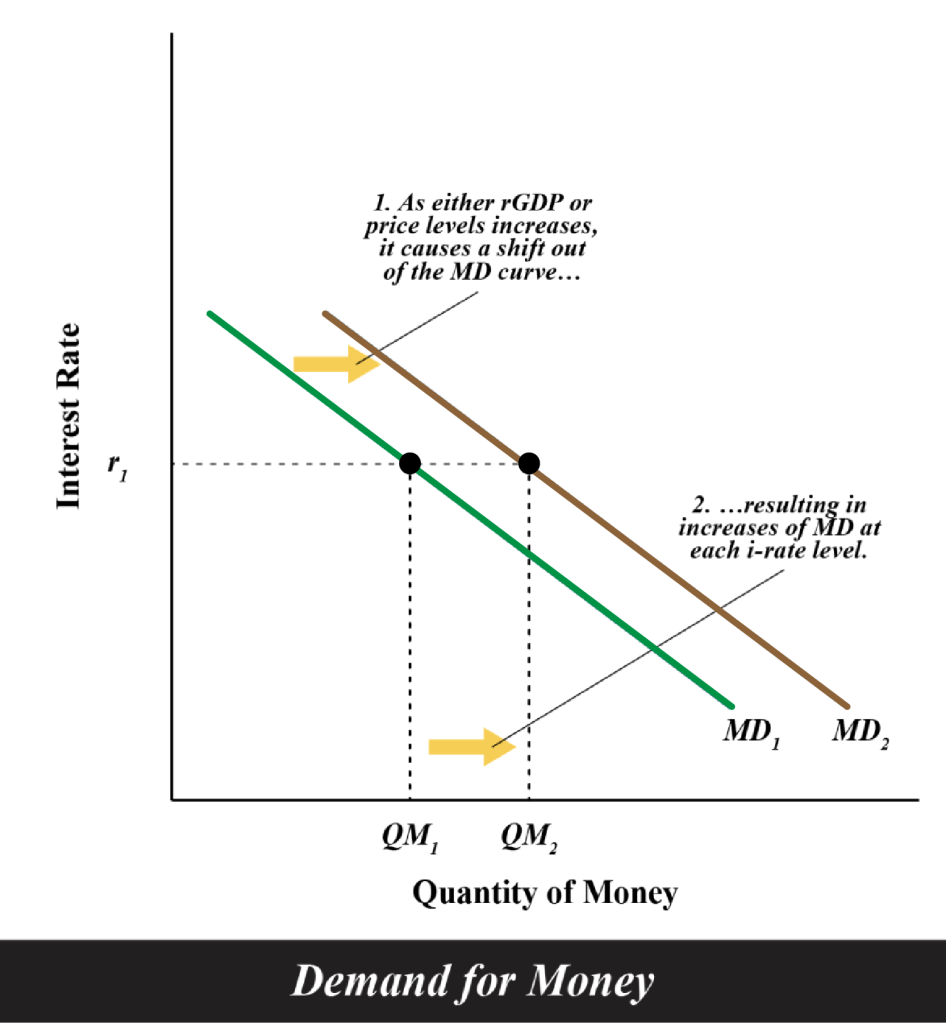
All else constant, two main factors that cause shifts in the money demand curve are changes in economic growth and inflation. An increase in GDP, for example, increases transactions, and with more trade in the marketplace, the demand for money increases and the MD curve shifts outward. When price levels rise, households and businesses need more money to pay for goods and services and the demand for money increases. MD curve shifts outward. The opposite would happen when the economy speculates a recession and households and businesses lower their spending and therefore decrease their demand for money.

Attribution
Principles of Macroeconomics by D. Curtis and I. Irvine is licensed under a Creative Commons Attribution-NonCommercial-ShareAlike 4.0 International License, except where otherwise noted.

