Overview and Background Information
In this lab, you will embark on an independent journey using bacterial cells to test the inhibition potential of an antibiotic. Scientists often use a relatively simple experimental setup to determine if an antibiotic inhibits the growth of bacterial cells. This can be performed in a liquid culture by exposing a constant number of bacterial cells to increasing concentrations of the antibiotic, allowing these cells to grow overnight, and measuring their growth using a spectrophotometer (optical density). The optical density is then graphed as a function of antibiotic concentration and the lowest concentration of the antibiotic that shows a visible growth inhibition in the bacterial cells is called the minimum inhibitory concentration (MIC) (1). This metric does not give you specific insight into the mechanism of the antibiotic (i.e. how the antibiotic is able to achieve inhibition), but it does provide useful information with respect to whether or not the antibiotic can indeed inhibit bacterial cell growth, and the concentration range at which the antibiotic is effective in the experimental setup described. Speaking of mechanism, what do we mean when we say that an antibiotic will “inhibit” the growth of bacteria? Generally speaking we can understand “inhibit” to mean preventing or limiting the replication of bacteria, but the term is a bit more complicated. Antibiotics can be broadly classified as bactericidal, meaning that the antibiotic actually kills the bacteria, or bacteriostatic which indicates that the antibiotic inhibits bacterial cells from reproducing/growing, but does not necessarily kill them.
In this lab you will use two strains of E. coli cells:
Strain 1: Wild Type (WT) – E. coli K12 cells. This cell line is susceptible to the antibiotic (Ant) that we will be using in this experiment. The concept here is to see at what concentration of antibiotic (Ant) we can begin to detect inhibition of bacterial cell growth. This can be accomplished by exposing a set concentration of bacterial cells to increasing concentrations of antibiotic. We allow the cells to grow overnight, then we check their growth using spectrophotometry. The idea here is to measure the turbidity (or cloudiness) of the cell suspension and correlate this to cell growth. The higher the turbidity (cloudiness), the higher the cell growth. Cell suspensions are placed in a spectrophotometer and the optical density (at 600 nm) is measured.
Optical density is typically described as a measurement of the amount of light scattered by the cell culture, rather than the amount of light absorbed (the latter is referred to as absorbance). We can then graph the optical density (O.D.) for each antibiotic concentration, and we should see the following trend:
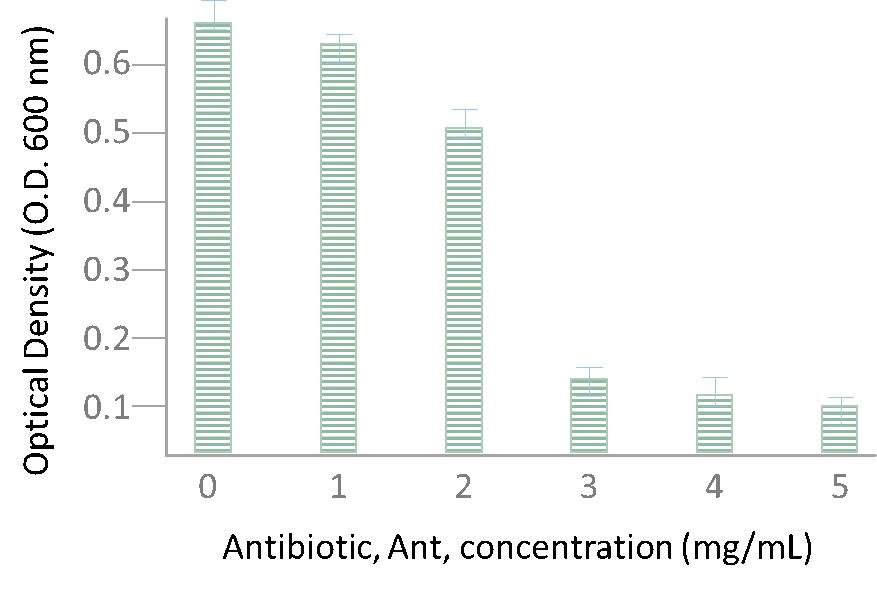
Based on this hypothetical data, we can see a high O.D. measurement (indicating bacterial cell growth) when no antibiotic is present (0 mg/mL antibiotic condition). This is completely expected and serves as our positive control indicating that bacterial cells are growing in our culture conditions. Increasing the concentration of antibiotic to 1-2 mg/mL also does not appear to severely affect cell growth inhibition. However, when we test the 3 mg/mL antibiotic condition we can observe a very high inhibition of bacterial cell growth as compared to our 0 mg/mL control. You can calculate a fold change between these two values by stating the following: the O.D. at 0 mg/mL antibiotic = ~ 0.65. The O.D. at 3 mg/mL antibiotic = ~ 0.15. The fold change = 0.65/0.15 = ~ 4-fold decrease in bacterial cell growth between the two conditions.
This type of experiment is usually more than sufficient to illustrate dose-inhibition in a cell-based assay. However, we will also provide you with a second strain of cells to test.
Strain 2: WT-AntR – E. coli K12 cells transformed with a plasmid containing an antibiotic resistance gene. This antibiotic resistance gene is downstream of a constitutive promoter (always on). Cells expressing this AntR protein are much more resistant to the antibiotic we will be using in this experiment as the AntR protein deactivates the antibiotic supplemented in the experimental media. Of course, at really high concentrations of antibiotic in the media, even an AntR protein will not be enough to inhibit cell growth. What will your graph look like if you test the same antibiotic concentrations with this strain and compare your results with the results from strain 1?
