Chapter 9 Lab Overview and Background Information
Learning Outcomes: Upon completion of this lab, students will gain practical experience in:
- Setting up SDS-PAGE apparatus
- Preparing samples and loading polyacrylamide gels
- Running SDS-PAGE gels
- Coomassie staining polyacrylamide gels
In the previous labs you purified your DHFR-His-6X tagged protein and determined the total protein concentration of key samples collected throughout the purification procedure. Next you will visualize the purification by running samples of all the fractions collected on an SDS-PAGE gel.
Sodium Dodecyl Sulfate Polyacrylamide Gel Electrophoresis (SDS-PAGE)
To learn more about the results of your protein purification, the protein content of your fractions will be analyzed using sodium dodecyl sulfate-polyacrylamide gel electrophoresis, commonly referred to as SDS-PAGE (1, 2). This electrophoresis method is a powerful separation technique used routinely in almost all biochemical laboratories. During this lab you will use precast SDS-PAGE gels, prepare your protein samples for loading on the gel, load your gels, run your gels (electrophoresis) and stain the resulting gels in a Coomassie solution.
General theory of SDS-PAGE (1-5)
This technique is related to molecular sieving chromatography in that the size of a protein is estimated by its migration through a gel matrix. In this case the gel matrix is continuous and the migration of proteins occurs under the influence of an electrical field. This migration depends on the molecular mass of the protein. The net charge and shape of the protein are standardized in SDS-PAGE. How does this occur? Mainly through the actions of SDS, reducing agents, and sample boiling.
SDS is a detergent that binds to proteins, disrupts their non-covalent structure and shape, dissociates them into polypeptide chains (in the case of multimeric proteins) and imposes comparable shapes and charge densities.
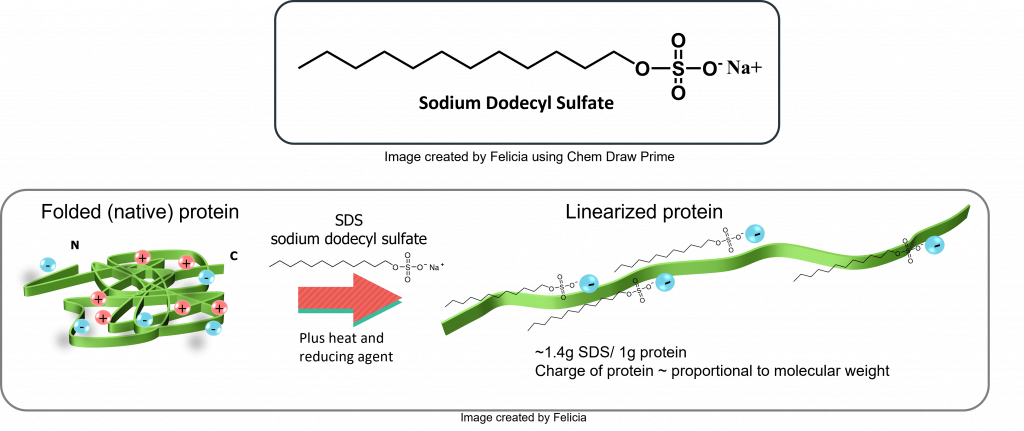
Thus, in SDS-PAGE the relative electrophoretic mobility of a protein is determined only by its mass, since SDS binding makes all proteins negatively charged to almost the same extent.
The type of SDS-PAGE performed in this experiment is known as discontinuous. Discontinuous refers to the use of two different gel systems: a stacking gel and a separating gel. The discontinuous component of this system also refers to the type of buffer used in the gel versus the electrophoresis tank (aka. electrode buffer). The stacking gel, which is the first gel that the sample enters, is at a lower polyacrylamide concentration and a lower pH than the separating gel. This allows molecules of similar size to “stack” into bands of similar size (a phenomenon known as isotachophoresis). The sample then enters the separating gel, which further separates the molecules. The use of a discontinuous system allows for greater separation of molecules.
After a current has been applied for a time, the gel is usually stained to indicate the presence and migration pattern of proteins. Common staining procedures include Coomassie Brilliant Blue and silver staining. Keep in mind that SDS-PAGE is just one of many gel electrophoresis techniques.
How does this SDS-PAGE gel differ from an agarose gel?
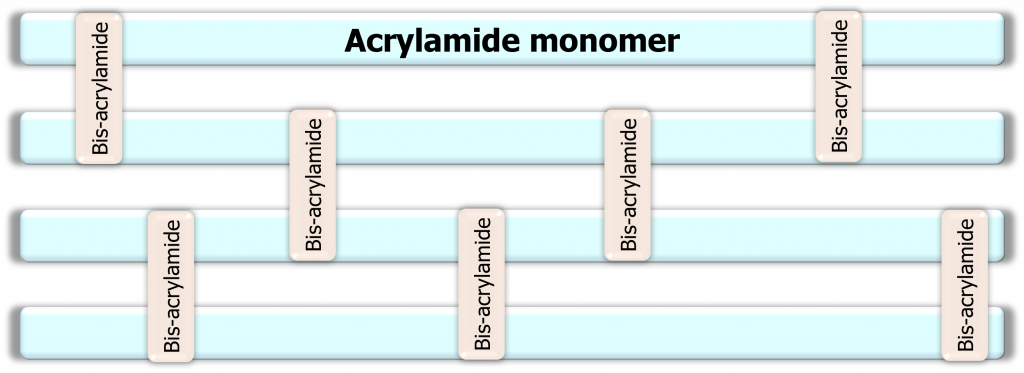
- The gel matrix is composed of acrylamide and bis-acrylamide, not agarose.
- A chemical reaction must occur for the gel matrix to form. This reaction is called a polymerization reaction … actually it’s called a vinyl addition polymerization catalyzed by free radicals (9, 10).
- Two additional chemicals are required for the polymerization reaction to occur: ammonium persulfate (APS) and Tetramethylethylenediamine (TEMED). When mixed together TEMED accelerates the rate of radical formation in APS, which moves on to convert acrylamide monomers into free radicals (7, 10). These acrylamide monomers react with other acrylamide monomers thus starting the polymerization chain. Once in awhile these polymer chains react with bis-acrylamide forming a crosslink. This is why bis-acrylamide is often referred to as a crosslinker. In practice, the concentration of bis-acrylamide relative to acrylamide monomers dictates the gel matrix pore size (7, 10).
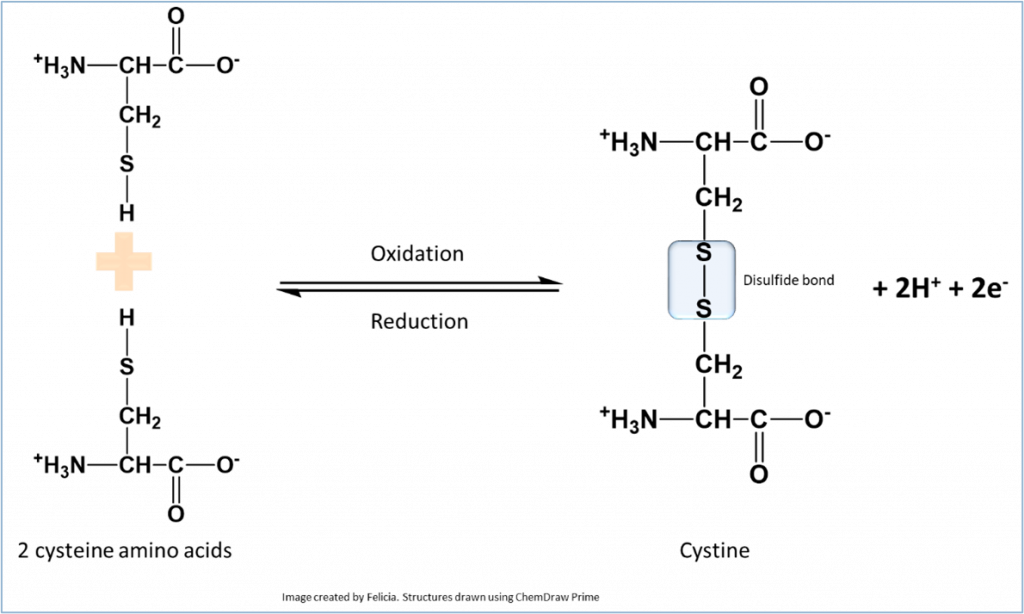
Protein sample preparation: prior to running the SDS-PAGE gel, protein samples must be prepared. To do this, a loading dye is added to the protein samples. The loading dye contains a number of chemicals -in addition to the detergent SDS – designed to help in the process of electrophoretic separation. For example, addition of β-Mercaptoethanol (β-Me) (or dithiothreitol (DTT)) serves to break disulphide bonds when present in proteins and hence separates polypeptide chains linked originally by disulphide bonds.
In SDS-PAGE, proteins are usually treated with these reagents and boiled to help denature the proteins. Before loading on the gel one more variable need to be accounted for: the AMOUNT of protein loaded in each lane. The proteins are then separated by passage through the polyacrylamide gel matrix (prepared by polymerizing acrylamide in the presence of cross-linking agents) in an electrical field.
Following SDS-PAGE, the gel is stained using Coomassie dye to visualize the protein bands.
Protein amounts: Like every other technique in science, the SDS-PAGE technique has a detection RANGE that depends on the type of gel used and the staining procedure. And so, a proper amount of protein to load on the gel depends on the distribution of proteins in the mixture. For example, if you have a samples comprised of multiple proteins, then around 20-50 µg of total protein should suffice in a minigel system. However, if the sample consists of only one protein (one band) then 20 µg would look like a “blob” on the gel (6). Here is an example of results obtained by undergraduate students at Rice University. Note that gel on the left was “overloaded” with total protein amounts that exceeded the 20-50 µg range, while the gel in the middle was under-loaded with protein amounts far less than the desired range. The gel on the right contained protein amounts around 20 µg, however keep in mind that this amount may be too much depending on the distribution of proteins in the sample:
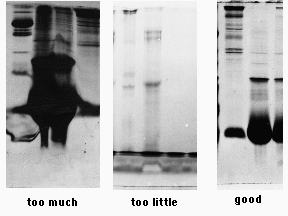
(Image obtained from: http://www.ruf.rice.edu/~bioslabs/studies/sds-page/denature.html, (6))
Expected results: what are expected results from your purification experiment (following SDS-PAGE and Coomassie staining). Please include a hypothetical gel drawing in your lab notebook with expected results prior to your lab day. Briefly describe your expected results.
