Chapter 2 Lab Overview and Background Information
Learning Outcomes: Upon completion of this lab, students will gain practical experience in:
- Working with restriction enzymes
- Preparing an agarose gel and in loading DNA samples
- Interpreting DNA gels
In this lab you will conduct the following workflow:
- Check to see if your PCR was successful. How? Using agarose gel electrophoresis. You will load a small sample from your PCR tubes on an agarose gel, then your DNA bands will be separated based on size using the electrophoresis technique. You will also analyze the NdeI/XhoI digested pET26b plasmid as a control to ensure that the restriction enzymes are functional.
2. You have now PCR amplified your folA gene. Congratulations!!!! The PCR products containing your amplicons (amplicon: technical term for amplified or replicated nucleic acids) must now be digested with the 2 restriction enzymes (REs) you engineered in your primers as 5’ extensions: NdeI and XhoI.
This will create two distinct sticky ends, which will allow us to control the direction of inserting our folA gene into the pET26b plasmid. This process is referred to as directional cloning (1). These restriction enzymes are present in the pET26b (2) multiple cloning site and should position your folA gene in the proper orientation with respect to the T7 promoter. Remember that the 5’to 3’ gene sequence translates to the N-terminal to C-terminal direction in a protein sequence. These samples will not be loaded on the agarose gel. We will store these samples until the next lab (chapter 3).
Restriction Enzyme (RE) Basics
The discovery of restriction endonucleases (or, more simply, restriction enzymes) revolutionized molecular biology (3-6). Using these enzymes scientists can “cut”, or “digest”, DNA at specific sites. The sizes of the resulting DNA fragments can be determined, providing a map of the DNA. Importantly, under the right conditions, the DNA fragments that result from digestion with restriction endonucleases can be joined, or ligated, to other DNA fragments. Such recombination is the basis of a phrase used to describe a significant aspect of biochemistry and molecular biology: “recombinant DNA technology”. In this lab, you will learn how to recombine fragments generated by these enzymes (7).
Restriction enzymes are produced mainly by bacterial cells and are used to degrade various forms of DNA. This includes foreign DNA from bacteriophages, thus such endonucleases “restrict” entry of foreign DNA into a bacterial host.
Restriction enzymes are useful for molecular cloning because they recognize specific sequences and cut double-stranded DNA. There are four main types of restriction enzymes available, but we will focus only on one basic type for this course: type II restriction enzymes.
For example, EcoRI is a restriction enzyme (RE) readily available for purchase from companies such as New England Biolabs (NEB) or Thermo Fisher Scientific. EcoRI recognizes a specific hexanucleotide sequence, G*AATTC, and the enzyme cleaves at the asterisk point (yellow arrowhead in the image).
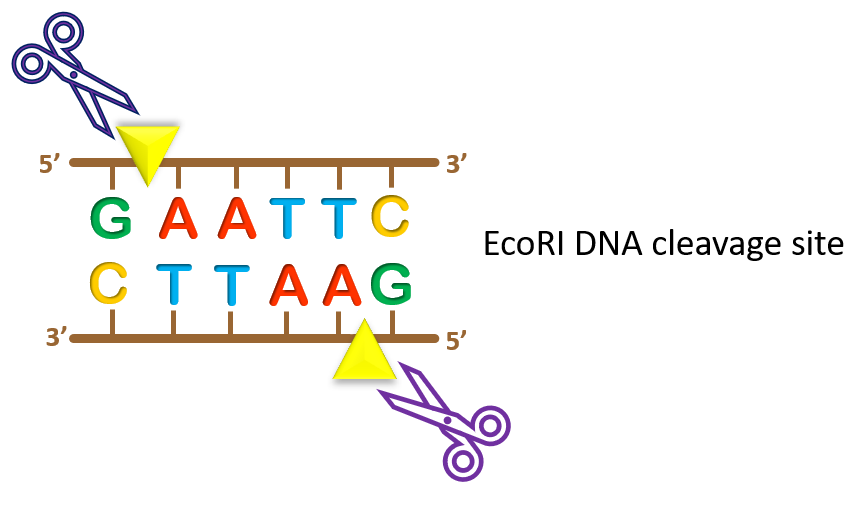 One thing to note is that restriction enzymes recognize palindromic sequences, meaning that these sequences are the same on opposite strands when read in the 5’ to 3’ direction. In our EcoRI example to the left, GAATTC can be read on both DNA strands as long as you read each strand in the 5’ to 3’ direction. This is a unique feature that allows for specific cleavage of both DNA strands.
Also, note that the naming of restriction enzymes tells you a lot about where this enzyme initially came from. EcoRI can be broken down as follows: the first 3 letters abbreviate the organism source, in this case, Escherichia coli (E. coli); the next letter represents the strain, in this case the R strain of E. coli; the Roman numeral gives us insight into the order of discovery. In this case, EcoRI was the first restriction enzyme to be discovered from the R strain. Remember that in science the name of an organism, compound, enzyme, etc. contains a LOT of history so instead of memorizing names… look them up and see how they were derived!
Agarose Gel Electrophoresis
DNA is super small and not readily visible to the naked eye. As such, once we “cut” our DNA with restriction enzymes we will obtain a number of different DNA fragments. These fragments are typically different in size: some are short and some are long. However, since we cannot see DNA we cannot easily separate the different sized DNA pieces … or can we? Enter a cool technique called agarose gel electrophoresis.
The main component of this technique is a slab of gel. That’s right, a gel. Though this gel is not made up of Jell-O, it is very similar in concept to Jell-O. You can actually look at a slab of Jell-O and a slab of agarose and you will note many similarities: both slabs are jelly-like substances that can be soft or firm depending on their temperature. Now the main ingredient in Jell-O is gelatin. The main ingredient in an agarose gel is agarose.

Schematic diagram of an agarose gel. Image created by Felicia.

Agarose is a linear polymer made up of the repeating unit of agarobiose: a disaccharide composed of alternating residues of D-galactose and 3,6-anhydro-L-galactopyranose. Agarose polymers create a meshwork through which DNA migrates when an electric field is applied. Because DNA has a negative charge it will migrate towards the positive pole in an electric field (electrophoresis). The agarose matrix serves as a “molecular sieve” that will separate larger DNA fragments from smaller fragments.
There are several factors that influence the rate of migration of DNA through agarose gels. These are highlighted in the table below (adapted from Sambrook, 2001, page 5.4-5.7, (3)).
In this lab, you will use agarose gel electrophoresis to visualize and analyze the results of your PCR amplification. You will prepare your own gels and gain experience in interpreting DNA gels.
|
Molecular size of DNA |
Double-stranded (ds) DNA molecules migrate through the gel at rates inversely proportional to log10 of base pairs. Therefore, the larger the DNA fragment, the slower the rate of migration through an agarose gel. |
|
Concentration of agarose |
The resolution of DNA fragments in a gel depends on agarose concentrations. Typically, agarose gels are made in the 0.7 % – 2 % concentration range. The lower range of agarose concentrations is better for the separation of larger DNA fragments and results in a greater distinction between bands that are close in size. |
|
Conformation of DNA |
Superhelical circular, nicked circular and linear forms of DNA migrate at different rates in an agarose gel. The order of migration between the 3 forms depends on a number of factors, from agarose concentration to buffer ionic strength, etc. Thus, it is always important to run an “uncut DNA” and “linearized DNA” control whenever working with circular vectors.
Want to read more about this? check out this super helpful article from Bitesize Bio: How to Identify Supercoils, Nicks and Circles in DNA Plasmid Preps |
|
Presence of GelRed in the gel. |
“GelRed is a sensitive, stable, and environmentally safe fluorescent nucleic acid dye designed to replace the highly toxic ethidium bromide (EtBr) for staining dsDNA, ssDNA, or RNA in agarose gels or polyacrylamide gels”. Check out this great video that compares GelRed with EtBr (gold standard): Gel Red versus Ethidium Bromide |
In agarose gel electrophoresis, DNA is typically added into each well of a freshly prepared agarose gel slab.
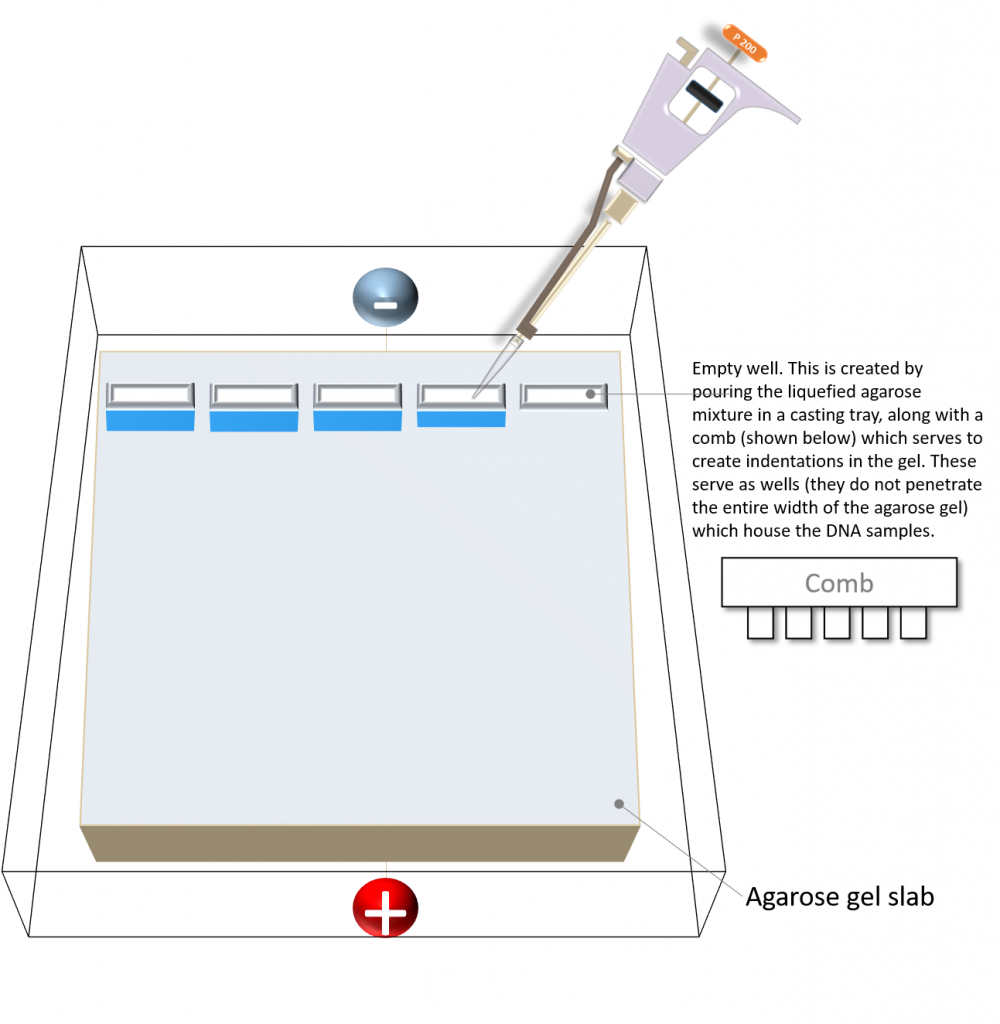
Image created by Felicia.
The agarose slab is placed in an electrophoresis tank which contains one negative and one positive electrode at either end of the gel. We can then take advantage of the overall negative charge character of the DNA backbone in order to separate DNA fragments of different sizes by applying a current running from negative to positive. DNA will readily migrate towards the positive end. The agarose matrix itself will function as a sieve to impede migration of DNA fragments of varying sizes. In this system, smaller DNA fragments migrate faster towards the positive electrode.
However, DNA is not visible to the naked eye while an agarose gel is running. Thus there we need to use other methods to monitor how electrophoresis is progressing. To accomplish this, scientists typically add tracking dyes to their samples (the resulting dye has a blue appearance). These dyes are visible to the naked eye and migrate through the gel in a manner similar to the DNA molecules. The sample buffer that you will be using (see the “Materials” section later on) includes two tracking dyes: xylene cyanol FF and bromophenol blue. While the migration rates of these dyes relative to the migration of DNA fragments of specific lengths varies with changes in the percentage of agarose in the gel, there is still a general correlation between dye migration and DNA migration. For agarose gels between 0.7 and 1.7 % agarose; xylene cyanol, light blue color, migrates at approximately the same rate as a linear double-stranded piece of DNA that is ~ 4 kbp (kilobase pair) in length. Bromophenol blue, dark blue color, migrates at approximately the same rate as a DNA fragment that is ~ 300 bp long (3).
To visualize the actual DNA bands in the gel, the DNA itself must be stained with a dye. In our case, you will be using GelRed which is added to the liquid form of the agarose gel right before it is poured into the gel casting tray. The dye itself will intercalate with DNA fragments and fluoresce when exposed to UV light. This is why it is very important to wear your UV-protective safety goggles when conducting this last step. In our lab we will be using a UV transilluminator which bypasses the need for us to look directly into the UV light. Instead, we will be visualizing the results using a camera and a laptop, however the UV light will still be employed in this process therefore safety measures must be followed at all times. Below are some examples of possible results.
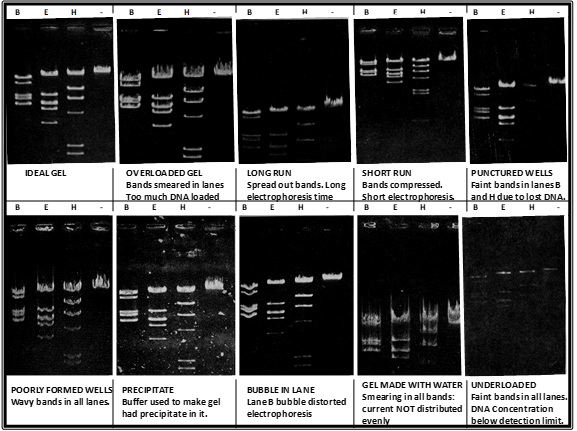
Possible agarose gel results. DNA samples were digested with BamHI (B), EcoRI (E), HindIII (H) or no restriction enzyme (-) and run on an agarose gel. Gels were visualized following DNA staining.
Figures were adapted from Micklos, David A., and Greg A. Freyer. DNA science; a first course in recombinant DNA technology. Cold Spring Harbor Laboratory Press, 1990, pp. 274.
Centrifugation – in this lab you will also be using the technique of centrifugation to “pellet” your reaction. Throughout our experiments we will be employing this technique quite a bit, thus it is important to take a moment and understand its basic use. For this lab our only concern is ensuring that our different mixture components are thoroughly mixed and brought to the bottom of our microcentrifuge tube for easy access. In later labs we will be utilizing this technique to separate our bacterial cells from growth media, as well as other uses.
