Chapter 6 Lab Overview and Background Information
Learning Outcomes: Upon completion of this lab, students will gain practical experience in:
- Calculating concentrations and amounts
- Making solutions
- Graphing a bacterial growth curve
- Bacterial cell lysis techniques
- Handling bacterial cell cultures
E. coli Dihydrofolate Reductase (DHFR) Protein Expression
This lab serves as the start of your bacterial protein expression and purification journey. In this course you will be expressing and purifying the E. coli Dihydrofolate Reductase (DHFR) protein.
For more information on general protein production and purification concepts please read review papers on the lac promoter (1) and bacterial expression systems (2).
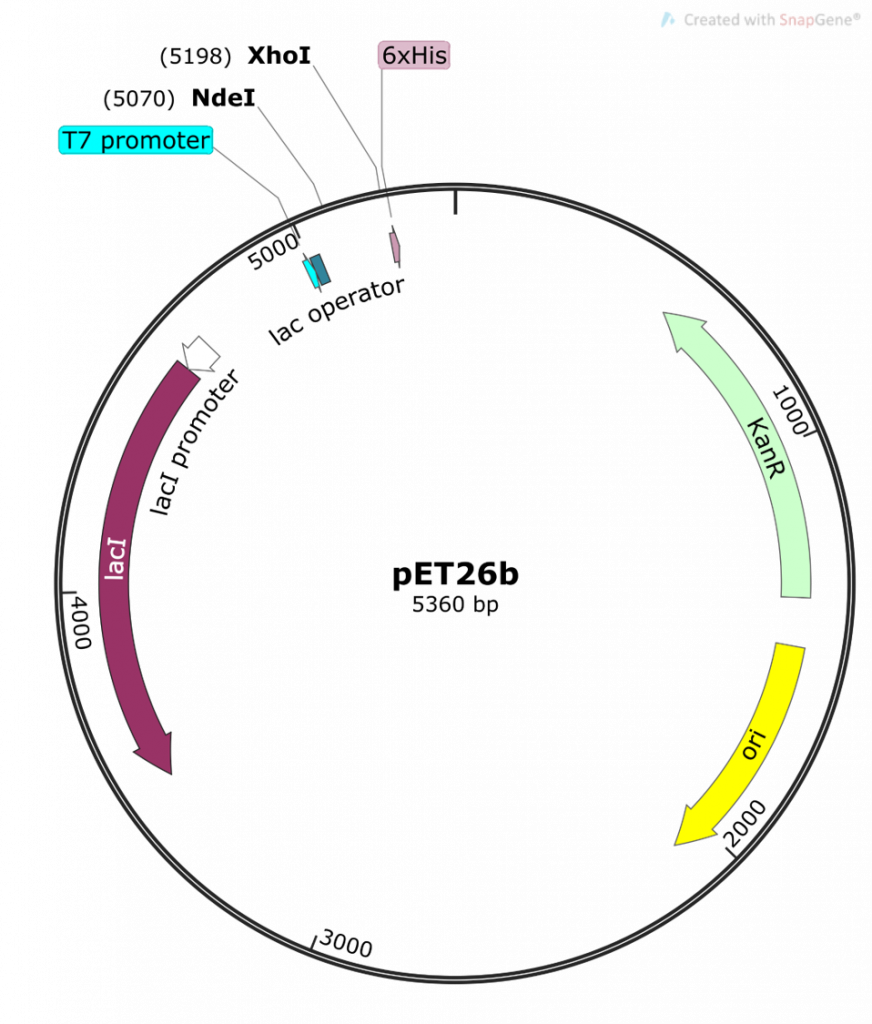
In this lab you will use a special strain of E. coli cells – E. coli BL21(DE3) (3)(4) – previously transformed with the pET26b-folA plasmid. Your folA gene will be transcribed and translated to yield your protein of interest: DHFR.
E. coli is a major star in the world of Biotechnology as it is a widely used system in both academic and commercial applications to produce recombinant proteins (5). In order for this system to work, it must be coupled to DNA recombinant technology (chapters 1-5), which allows you to genetically engineer your gene of interest into a chosen plasmid designed for optimal protein expression. Your plasmid is pET26b from Novagen (6) and is designed to express your gene of interest in a T7-compatible E. coli expression strain (namely, E. coli BL21(DE3)) (4).
You will be using a regulated (inducible) system to control the expression of your DHFR protein. This system incorporates a number of features found in both the pET26b plasmid and the BL21-DE3 strain of E. coli.
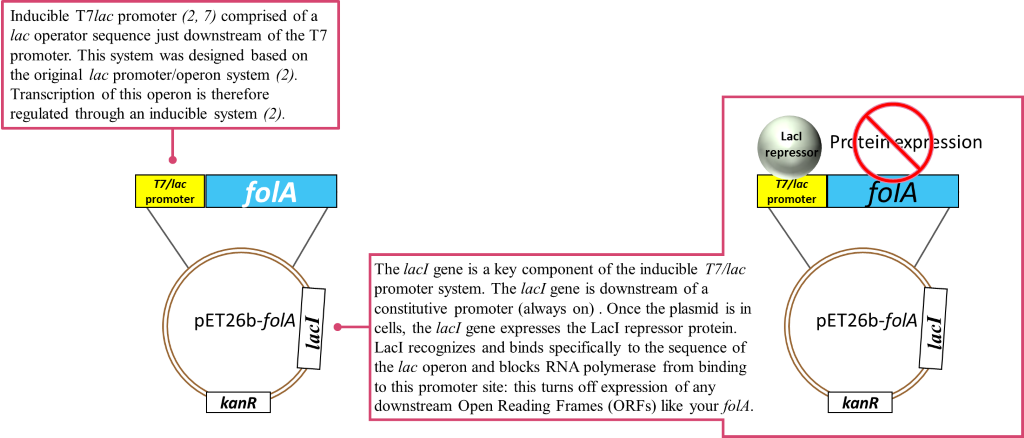
Image created by Felicia Vulcu.
The term “inducible” promoter system comes into play when we look at the regulation of the LacI repressor protein. In fact, this idea initially originated from the lac operon. Let us take a moment to get re-acquainted with the lac operon:
This work is licensed under a Creative Commons Attribution-NonCommercial-NoDerivatives 4.0 International License.
In these types of systems, an inducer – typically in the form of a chemical – is applied to the system. The purpose of the inducer is to bind to the LacI repressor protein and induce a conformation change in LacI such that it is released from the promoter. This means that the promoter site is now free and is recognized and bound by RNA polymerase and other transcription factors. The moral of this story is: if no LacI is bound to the promoter, transcription of your folA gene of interest can occur.
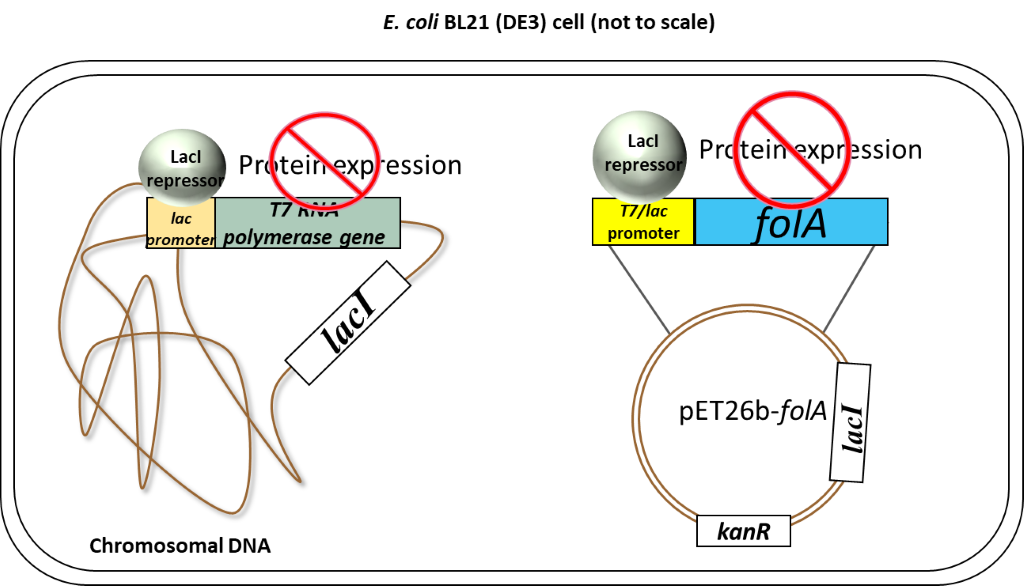
So, to recap: in the absence of an inducer, the LacI protein is expressed and bound to the T7/lac promoter on the pET26b plasmid, therefore no DHFR protein expression occurs (1-2, 6). In chapters 1-5 you cloned your gene of interest downstream of this T7/lac promoter and so your DHFR proteins of interest will only be expressed once the LacI repressor protein is removed by the addition of an inducer (in your case the inducer molecule is called IPTG).
Now on to the special features of your E.coli BL21(DE3) cells which allow this specific inducible promoter system to work. Thus far we have largely ignored the T7 part of the T7/lac promoter name. We only looked at the regulation of the promoter itself, but this is just one of two important pieces of a promoter. The second piece is the DNA region of the promoter recognized by RNA polymerase. The endogenous E. coli RNA polymerase typically recognizes a specific DNA sequence in the promoter regions of all E. coli promoters. This makes sense as it needs to transcribe a whole bunch of genes, so having a similar recognition sequence in the promoter is efficient. Now our promoter has a specific designation to it: T7. This promoter sequence was engineered specifically for your pET26b plasmid and was initially taken from a bacteriophage promoter sequence. A bacterio…what? Well, you can think of bacteriophages as bacterial viruses. These viruses (or phages as we like to call them in the bacterial world) infect bacteria specifically. Bet you never thought bacteria could get the flu! (nerd joke). Anyway, this is actually a really cool field because scientists have been studying these phages for a very long time. Actually, the techniques you are using in this course would not have been possible without understanding phages; and more importantly, how bacteria defend against phages. We visited one such defense mechanism in our discussion of restriction enzymes (RE). However, phages have also evolved their own mechanisms to manipulate bacteria. You must remember that phages (and viruses) infect a cell and then start manipulating the host cell’s machinery to make more copies of their own DNA and their own proteins. To do this, phages will often have their own RNA polymerase gene and, when expressed, the phage RNA polymerase will only recognize the phage promoter regions. So in our T7 expression system, we borrowed 2 items from a T7 bacteriophage: 1) a T7 promoter sequence which is recognized only by a T7 RNA polymerase, and 2) the T7 RNA polymerase gene. The T7 promoter sequence was genetically engineered into the pET26b plasmid as we saw previously.
The T7 RNA polymerase gene was genetically engineered into the chromosomal DNA of E. coli BL21(DE3) cells. This T7 RNA polymerase gene was inserted in the chromosomal DNA of this specific strain of E.coli, downstream of a lac promoter system. This lac promoter system is recognized by endogenous E.coli RNA polymerase and is also regulated by the LacI repressor in exactly the same fashion as described above.
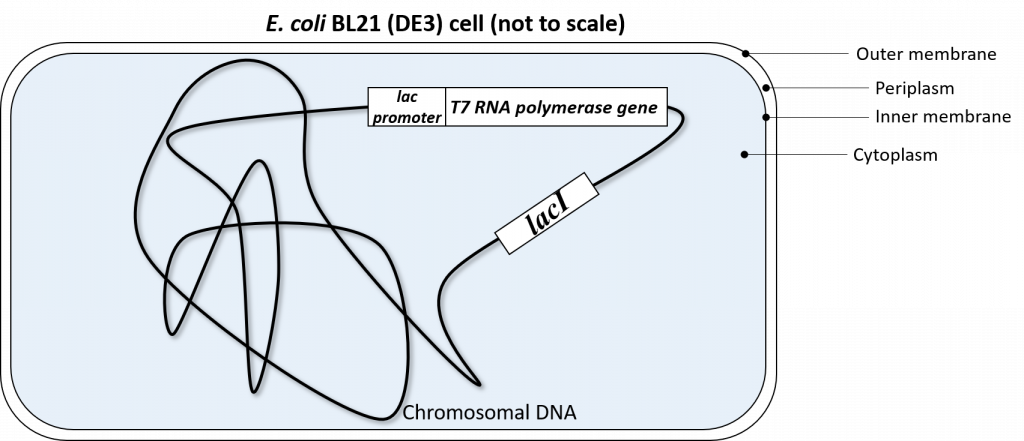
So to recap: our E. coli BL21(DE3) cells have been genetically engineered to express T7 RNA polymerase. This T7 RNA polymerase ONLY recognizes the T7 promoter sequence.
So now, let’s take another look at what’s happening in our pET26b-folA transformed E. coli BL21 (DE3) cells in 2 possible scenarios:
1. the absence of an inducer (in our case this inducer is called IPTG)
2. the presence of inducer (IPTG)
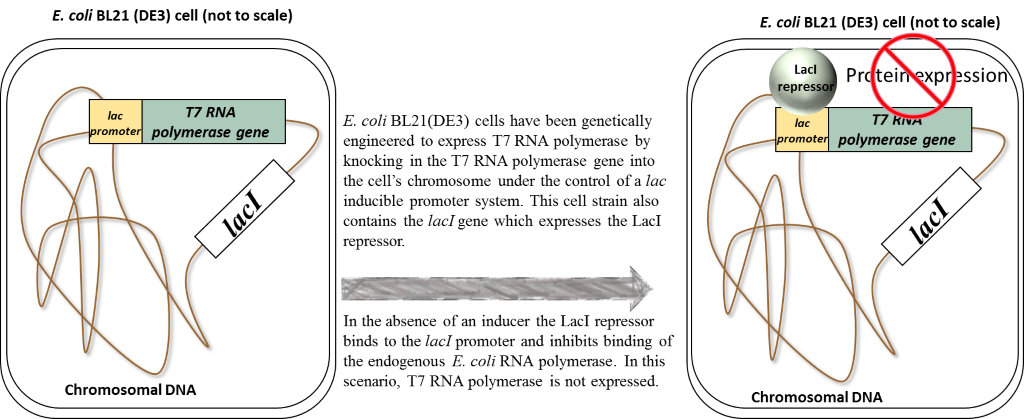
Scenario 1: Absence of inducer (IPTG)
Scenario 2: Presence of inducer (IPTG)
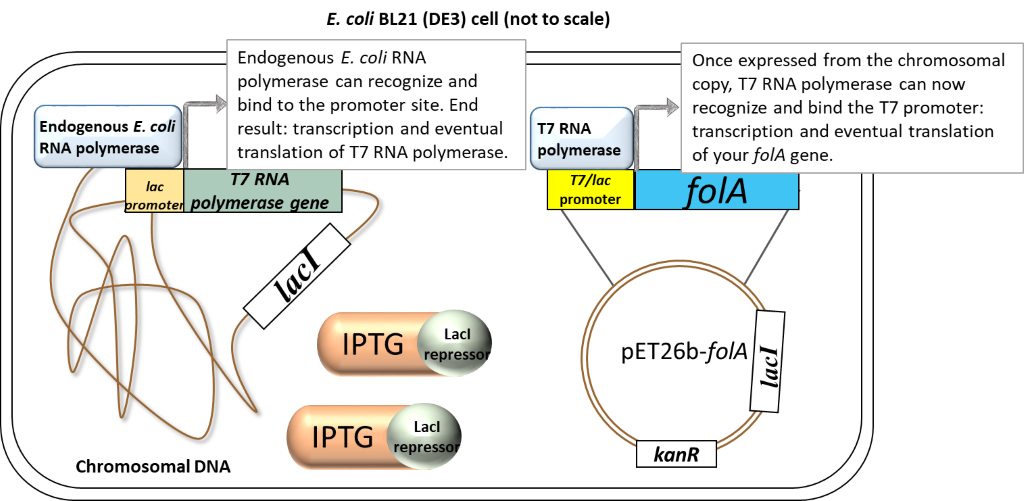
Image created by Felicia.
In the presence of IPTG (inducer), the LacI repressor protein binds IPTG and undergoes a conformational change which results in the release of LacI from promoters. Focusing on the chromosome: the LacI repressor protein no longer obstructs the lac promoter and it can be recognized and bound by the endogenous E. coli RNA polymerase. Transcription and eventual translation of T7 RNA polymerase occurs. Focusing on the pET26b plasmid: once expressed,T7 RNA polymerase can recognize and bind to the T7/lac promoter (remember that only T7 RNA polymerase will recognize and bind this T7 promoter sequence). This leads to the transcription and eventual translation of your gene of interest (aka. DHFR).
E. coli Cell Growth
E. coli grows and divides through a process called binary fission. In this process, the cell grows to twice its normal size and then divides in half to produce two identical daughter cells (11). Each of these cells divides to form two new cells and so on. As such, this type of growth is called exponential growth (2n, where n = the number of generations). Typically, E. coli cells divide every 20-30 minutes to yield a new generation. And so, after 10 hours you would have 20 generations of E. coli in your liquid culture. This is actually a great system for studying evolution in a test tube. In fact, research from the Lenski lab utilized this principle to study mutation rates in E. coli following its growth over 10 000 generations (12).

Figure 3: a graphical representation of a microbial growth curve showing the 4 phases of population growth. Graph adapted from: Bauman, Robert W. Microbiology: with diseases by body system-2nd edition (11).
When bacteria are inoculated into liquid medium there are 4 distinct phases to a population’s growth:
” Lag phase – cells are adjusting to the new environment; actively synthesize enzymes and other required material to utilize the nutrients in their new environment. Cell division is not prominent in this phase.
Log (exponential) phase – phase of rapid chromosome replication, growth and reproduction. This is a very important phase for laboratory purposes as the metabolic rate of these cells is at a maximum, protein production is at a maximum and this is the time to induce recombinant protein expression.
Stationary phase – rate of reproduction decreases as nutrients are depleted and waste accumulates.
Death phase – if nutrients are not added and waste nor removed, a population reaches a point at which cells die at a faster rate than they are produced.” (11) Adapted from: Bauman, Robert W. Microbiology: with diseases by body system-2nd edition. ISBN 978-0-321-51341-0
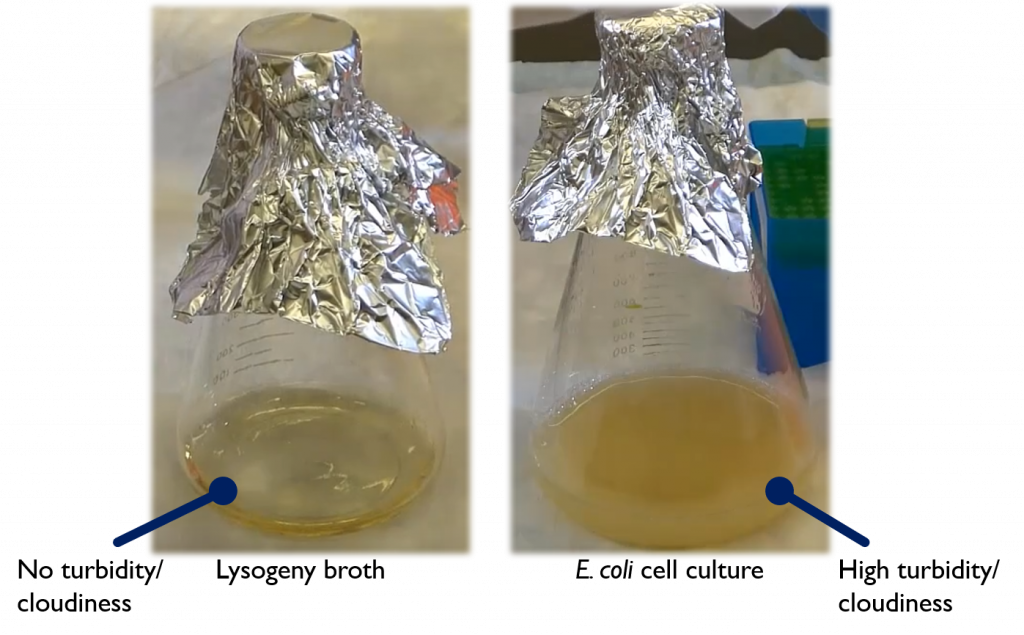
Practically speaking, how do we measure the number of cells over time? We can’t just count the cells because they are really small (we need a microscope to see individual cells) and dividing really fast. One way to do it is to count the number of cells in a small sample (using viable plate counts or microscope counts) and then estimate the number of cells in a large sample from the data obtained. For our experiments, it is not necessary to do direct cell counts as we can use another property of a growing cell culture: turbidity. Fresh LB media presents as a clear orange color, but as our E. coli culture begins to grow, the media becomes more and more turbid (13).
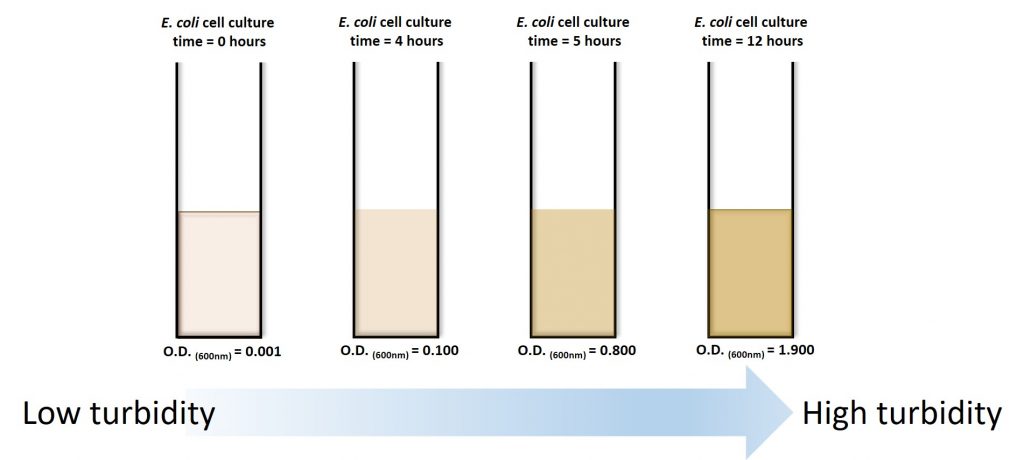
We can take advantage of this visual change and measure the turbidity of the culture over time using a spectrophotometer. The greater the concentration of bacteria within a broth, the more light will be scattered.
Because bacteria are, in essence, colorless they do not absorb light. This function is usually reserved for pigmented cells (green and purple phototrophic bacteria) or dissolved dyes (Coomassie). You can generate a curve like the one above, only the y-axis is now an O.D. measurement (or measurement of turbidity). However, keep in mind the controls. You need to ensure that you only measure the OD of your cells and not your orange-brown pigmented media. You need to first measure the media (without cells) and “blank” your spectrophotometer with this measurement.

Empirically, in our system E. coli will reach mid-log phase when the O.D. reaches 0.4-0.8. However, this ALL DEPENDS on the starting culture conditions!!! Therefore, this rule is not always true for every culture you will ever grow.
